Abstract
Insulin gene expression is regulated by several islet-enriched transcription factors. However, MafA is the only β cell-specific activator. Here, we show that MafA selectively induces endogenous insulin transcription in non-β cells. MafA was also first detected in the insulin-producing cells formed during the second and predominant phase of β cell differentiation, and absent in the few insulin-positive cells found in Nkx6.1-/- pancreata, which lack the majority of second-phase β cells. These results demonstrate that MafA is a potent insulin activator that is likely to function downstream of Nkx6.1 during islet insulin-producing cell development.
Insulin is an essential hormonal regulator of glucose, fatty acid, and amino acid metabolism by means of actions in liver, adipose tissue, and muscle. Insulin is exclusively produced in the β cells of the islet of Langerhans, whereas the hormone-specific product of the other islet cell types is glucagon (i.e., α cells), somatostatin (δ), and pancreatic polypeptide. The cis-acting elements controlling β cell selective expression are located within insulin enhancer sequences found between base pairs -340 to -91 relative to the transcription start site. Several key control elements have been identified within this region, including C2 (-309 to -303 bp in rat insulin II gene), A3 (-203 to -194 bp), C1 (-118 to -107 bp), and E1 (-100 to -91 bp) (1, 2).
The activators of insulin A3-element- and C2-element-stimulated transcription are the homeodomain containing Pdx-1 (3) and Pax6 (4) proteins, respectively. In contrast, distinct proteins in the basic helix–loop–helix (BETA2) (5) and basic leucine-zipper (MafA) (6–8) families control E1- and C1-mediated activation. Each of these insulin activators is highly enriched in islet cells, with Pax6 (4) and BETA2 (5) present in all islet cell types and Pdx-1 in β cells and a subset of δ cells (9). Notably, the recently isolated MafA protein is found only in β cells within the pancreas (8). These transcription factors are essential also for maintaining physiologically functional islet cells, likely because of their capacity to regulate β-glucokinase, islet amyloid polypeptide, glucose transporter type 2, glucagon, somatostatin, and pdx-1 gene expression (1, 2, 10). Significantly, dysfunctional mutations in Pdx-1 (11), BETA2 (12), and Pax6 (13) impact the development of diabetes in humans, presumably because of reduced expression of their target genes, which are required in glucose sensing.
Gene-ablation experiments performed in mice have established that Pax6, Pdx-1, and BETA2 play an important role in pancreas formation also. The first molecular sign of pancreatic development is the restricted expression of Pdx-1, which occurs before hormone transcription, in both the dorsal and ventral gut epithelium at embryonic day (E) 8.5 (14, 15). Pdx-1 is expressed in embryonic cells that produce islet hormone products, and it is expressed transiently in the amylase-positive exocrine precursors that appear at E13.5 (9). The expression of Pdx-1 in this precursor cell population is essential for the development of the endocrine and exocrine compartments. Pancreatic development arrests at a very early postbud stage in homozygous pdx-1 mutant mice, with resulting pancreatic agenesis (14–16). The initial stages of dorsal and ventral bud formation appear to be normal in pdx-1 null mice (14, 15), and insulin- and glucagon-expressing cells are detected (14). These insulin-producing cells likely represent the few insulin-positive cells that are normally produced within 1 day of bud formation and lack specific products required for mature islet β cell function (17, 18).
Fully differentiated β cells first appear around E13 at the start of a massive wave of β cell differentiation, termed the “secondary transition” (19). During this period, the first somatostatin- and pancreatic polypeptide-producing cells are detected at E15.5 and E18.5, respectively. Although Pax6 (4) and BETA2 (20) expression is detected around E10, they act at late developmental stages necessary in islet-cell formation (Pax-6, α) (4, 21) and maintenance (BETA2, β > α > δ) (20). Several other transcription factors are also involved in islet-cell formation, although only Nkx6.1 is specifically required for the formation of mature β cells. Thus, most of the β cells produced during the secondary transition are lost in Nkx6.1-deficient mice (22).
In this study, we have examined the significance of the β cell-specific MafA protein in insulin gene transcription in islet β cells. Consistent with having an important role in this process, MafA was shown to be essential for insulin expression in β cells and to be able to induce endogenous expression independently in non-insulin-producing islet αTC6 cells. In addition, MafA was first expressed during pancreatogenesis in the insulin-producing cells of the secondary transition and not in the islet cells of Nkx6.1-deficient mice. These results strongly indicate that MafA is required for both the formation and maintenance of mature insulin-producing islet β cells.
Research Design and Methods
Transfection Constructs. The -251 LUC and -238 LUC reporters contain human insulin gene sequences between -251 and +2bp and rat II insulin gene sequences between -238 and +2 bp (23, 24). The insulin Maf-response element (MARE) mutants were generated by using the QuikChange mutagenesis kit (Stratagene) with the following oligonucleotide primers: rat C1, -131GTGT T TGGA A ACTGCAGCT TACTACCCTCTGGCCATCTGCTG-90; rat MARE1, -107CCCTCTGGCCATCTGGCCCTCCACCCTTAATGGG-74; rat MARE2, -168TCCAATGAGCACTTTCGTAAGACCTAGCACCAGGC-134; human C1, -136CCGGAAATTGCAGCCTACTACCCCAGCCATCTGCCG-101; and human MARE3, -202GGTCCTGAGGAAGAGGGTAGGACGACCAAGGAGATC-167. All of the mutated sequences are shown in italics, and each construct was verified by sequencing. Mouse MafA sequences were subcloned downstream of the cytomegalovirus enhancer of pcDNA3.1 (Invitrogen), and the resulting plasmid was used to establish the MafA-expressing αTC6 cell line.
Cell Transfections. Monolayer cultures of βTC3 (25) and αTC6 (26) cells were maintained as described. Transfections were performed by using Lipofectamine reagent (Invitrogen) according to the manufacturer's instructions. Extracts from transfected βTC3 cells were prepared 40–48 h after transfection and analyzed for insulin-driven firefly luciferase and thymidine kinase-driven renilla luciferase from the phRL-TK vector (Promega) (8). Firefly luciferase and renilla luciferase activity were measured by using the Dual-Luciferase reporter assay system (Promega). The normalized firefly luciferase data were statistically analyzed by two-tailed t test by using prism software (version 4; GraphPad, San Diego).
The MafA and pcDNA3.1 (control) lines were derived from αTC6 cells by transfection, followed by hygromycin B (200 μg/ml) selection. Clonally selected hygromycin B-resistant cells were used for analysis.
RT-PCR Analysis. Total cellular RNA was isolated from βTC3 and αTC6 cells by using the TRIzol reagent (GIBCO/BRL) and treated by using a MessageClean kit (GenHunter, Nashville, TN) to remove DNA. The One-Step RT-PCR kit (Clontech) was used to detect RNA expression. Reverse transcription reactions were performed with 500 ng of RNA in the presence of 20 pmol of oligo(dT) primer at 50°C for 60 min and then PCR-amplified for 32 cycles with 20 pmol of 5′ and 3′ primer (94°C for 45 sec and 60°C for 45 sec). The intron-spanning mouse primer sets were as follows, with numbering relative to the ATG codon: insulin I (134 bp), -28CCAGCTATAATCAGAGACCA (forward) and +106CCAGGTGGGGACCACAAAGA (reverse); insulin II (103 bp), +139GGCTTCTTCTACACACCCAT (forward) and +241CCAAGGTCTGAAGGTCACCT (reverse); Pdx-1 (204 bp), +349CAGCTCCCTTTCCCGTGGAT (forward) and +552CAACATCACTGCCAGCTCCA (reverse); and glucagon (328 bp), +167GCACATTCACCAGCGACTACA (forward) and +494CTGGTGGCAAGATTGTCCAGA (reverse). The products were resolved on a 1.5% agarose gel run in TAE buffer (0.04 M Tris·acetate/0.001 M EDTA, pH 8) and visualized by ethidium bromide staining. The correctness of the amplified products was determined by diagnostic restriction-enzyme digestion and DNA sequencing.
Electrophoretic Mobility Shift Assay. Nuclear extracts were prepared from βTC3 cells, αTC6 cells, and binding reactions conducted with nuclear extract and insulin MARE site probes as described (8). The following double-stranded oligonucleotides to the insulin genes were used in the binding analysis: C1, -135CGGAAATTGCAGCCTCAGCCCCCAGC-110; human (MARE1, -113CAGCCATCTGCCGACCCCCCCACCCC-88; MARE2, -168TCTTCCCACAGACCCAGCACCAGGGA-143; and MAR E3, -192A AGAGGTGCTGACGACCA AGGAGATC-167); rat II (C1, -126TGGAAACTGCAGCTTCAGCCCCTCTG-101; MARE1, -104TCTGGCCATCTGCTGATCCACCCTTA-78; MARE2, -158ACTTTCTGCAGACCTAGCACCAGGCA-133; and MARE3, -182TAGAGGTGTTGTTGTCCAATGAGCAC-157). The insulin–protein complexes were resolved on a 6% nondenaturing polyacrylamide gel (29:1 acrylamide/bisacrylamide ratio) and run in TGE buffer (50 mM Tris/380 mM glycine/2 mM EDTA, pH 8.5). The gel was then dried and subjected to autoradiography.
Mice and Immunohistochemistry. The Nkx6.1 null mutation was generated by gene targeting as described (22). The day of vaginal-plug discovery was designated stage E0.5. Immunofluorescence and confocal image analyses were performed on mouse paraffin sections as described (8). The primary antibodies used were: rabbit α-MafA, 1:1500 (8); rabbit α-Nkx6.1, 1:100 (kindly provided by P. Serup, Hagedorn Research Institute, Gentofte, Denmark); guinea pig α-insulin, 1:2000 (Linco Research Immunoassay, St. Charles, MO); and guinea pig α-glucagon, 1:2000 (Linco Research Immunoassay). Secondary antibodies were Cy3- or Cy5-conjugated donkey α-guinea pig and α-rabbit (1:500 dilution; Jackson ImmunoResearch). Fluorescent images were captured with an LSM 510 confocal microscope (Zeiss) by using an optical depth of 1 μm. Nuclear counterstaining was performed by using YoPro1 (Molecular Probes).
Results and Discussion
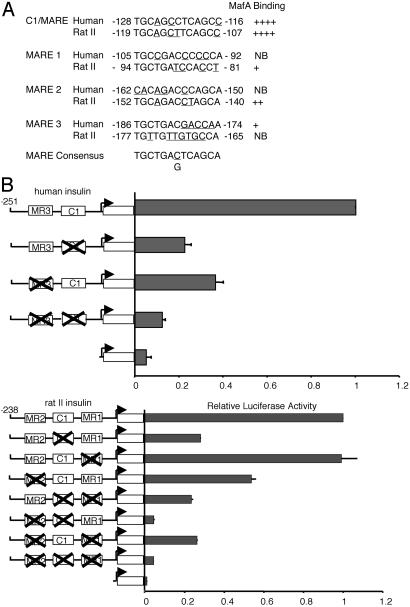
MafA Is Crucial for Insulin Transcription. MafA is a member of the large Maf family (6–8), which also includes MafB, expressed in islet α cells (8). Each member binds with similar efficacy to MARE, the consensus large Maf-response element, with MafA being fundamental to the activation of the C1 MARE in the human (23) and rat insulin II (27) genes. [Rodents have two nonallelic insulin genes (I and II), and humans more closely resemble the rodent II gene (1, 2).] Inspection of the highly homologous enhancer-region sequences of human and rat II revealed several other potential MafA binding sites. Gel-shift experiments performed with insulin MARE probes confirmed the presence of the following additional upstream MafA binding sites: human, -186 to -174 bp (MARE3); and rat insulin II, -94 to -81 bp (MARE1), -152 to -140 bp (MARE2) (Fig. 1A). These sites would be contained also in the MafA binding domain of the endogenous insulin gene detected by chromatin immunoprecipitation analysis (8). To determine whether these other MafA sites were involved in transcription, binding-defective mutants were created in insulin enhancer-driven reporters. In general, individual binding mutants had partially reduced activity in transfected βTC3 cells (Fig. 1B). Most strikingly, insulin-driven activity was essentially abrogated in the combined mutants (Fig. 1B). These insulin mutants had a similar effect on MafA-mediated transactivation in non-β cell transfection assays (data not shown).
Fig. 1.
The MARE sites are crucial for mammalian insulin gene activity. (A) The MARE-related sequences within human and rat insulin II gene enhancer are shown in relation to the consensus MARE (see ref. 31) binding site. Underlined letters indicate sequences that deviate from the consensus. Strong binding (++++) to no binding (NB) was found in gel-shift experiments conducted with the labeled insulin MARE probes and βTC3 nuclear extracts (see Fig. 5, which is published as supporting information on the PNAS web site). The authenticity of the MafA-containing complex was determined by αMaf antisera supershift analysis. (B) βTC3 cells were transfected with the wild-type and MARE site mutants of human (-251-LUC) and rat II (-238-LUC) insulin enhancer- and promoter-driven luciferase reporters. Enhanced BETA2:E47 activator-binding at the E1 site contiguous to MARE1 presumably masks the effect on rat -238 mutant activation (data not shown); although, because we were unable to generate mutants at this site that did not influence BETA2:E47 binding, it is possible also that this element is not an important MafA regulatory site. Shown are normalized activity values ± SEM, compared with wild-type insulin-reporter activity.
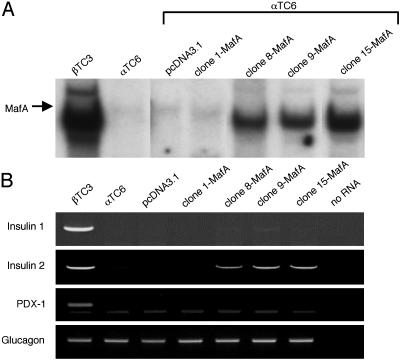
To test more rigorously the ability of MafA to activate insulin transcription, islet αTC6 cells were stably transfected with MafA, and expression from the endogenous insulin gene was analyzed by RT-PCR. These cells do not normally express MafA or insulin (Fig. 2). However, ectopic expression of MafA in αTC6 cells did induce detectable, but low level, insulin II mRNA (Fig. 2). In contrast, other likely MafA-responsive genes, such as pdx-1 (28) and insulin I, were not activated effectively. Differences in the cis-element organization between the rodent insulin genes presumably limits the MafA responsiveness of insulin I because mouse insulin I and II are expressed independently and distinctly during development in the pancreas and thymus (29). In addition, glucagon expression was not influenced by MafA, suggesting that it does not interfere in α cell-enriched MafB-mediated activation (ref. 30 and data not shown). Importantly, these results demonstrate an essential role for MafA in insulin transcription.
Fig. 2.
Endogenous insulin mRNA expression is induced in αTC6 cells by stable production of MafA. (A) Gel-shift binding reactions were performed with the human insulin C1 probe by using nuclear extracts prepared from βTC3 cells and αTC6 cell line clones stably transfected with the pcDNA3.1 vector alone or MafA-pcDNA3.1. (B) RT-PCR analysis was performed by using specific insulin I, insulin II, glucagon, and pdx-1 mRNA primers. The appropriately sized amplification product was not detected in the absence of RNA or without the addition of reverse transcriptase (data not shown). The correctness of the RT-PCR products was determined by DNA sequencing. We loaded 4-fold less of the βTC3 RT-PCR samples on the gels.
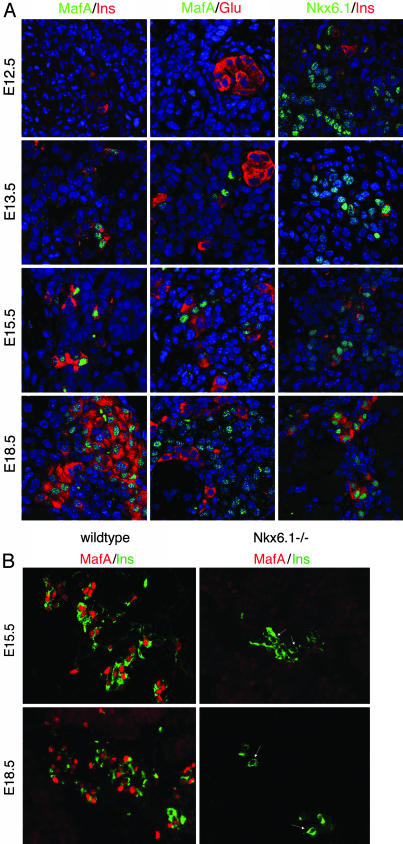
MafA Expression Is Restricted to the Insulin-Producing Cells Made During the Secondary Transition. Although a few insulin-producing cells are detected as early as E10.5 during pancreatic development in mice, the majority of islet β cells evolve from a distinct insulin-positive cell population made during the later secondary transition phase (10). Strikingly, MafA was expressed initially in insulin-positive cells at E13.5 but not E12.5 (Fig. 3A). However, MafA was detected in dorsal root ganglia at E12.5 (data not shown). Also, MafA expression was found only in insulin-positive cells in the pancreas. Thus, neither glucagon (Fig. 3A) nor somatostatin (data not shown) was coexpressed with MafA during development or in the mature islet (8).
Fig. 3.
MafA is first expressed in the insulin-producing cells of E13.5. (A) Double immunofluorescence staining in E12.5, E13.5, E15.5, and E18.5 mouse pancreatic sections with α-MafA serum (green) and either α-insulin or α-glucagon (red). MafA staining was found exclusively in the insulin-positive cells produced from E13.5 and never in the glucagon-expressing cells. In contrast, α-Nkx6.1 serum (green) broadly stains the pancreatic epithelium and a subset of insulin-expressing cells (red) at E12.5 and E13.5. The nuclei are stained in blue. (B) α-MafA (red) and α-insulin (green) staining of wild-type and Nkx6.1 null mutant mice illustrates that MafA is not coexpressed with insulin in the few insulin-positive cells detected at E15.5 and E18.5 in mutant mice.
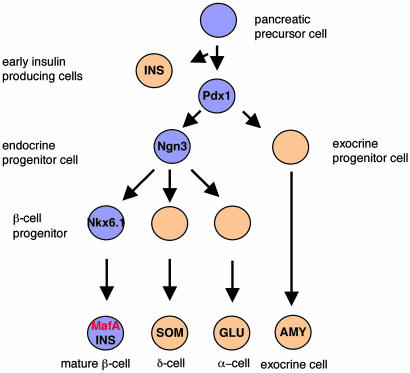
Strikingly, MafA is the only islet-enriched transcription factor that is expressed in such a restricted way, and expressed this late, in islet-cell development (10). For example, Nkx6.1, the only other regulator expressed uniquely in islet β cells, is found in the majority of epithelial cells early and later becomes restricted to insulin-expressing cells (Fig. 3A and ref. 22). Disruption of the Nkx6.1 gene leads to a profound reduction in β cell neogenesis during the secondary transition (22). MafA expression was analyzed in Nkx6.1-deficient animals to determine its association with late β cell differentiation. MafA was not detected in the few mature insulin-positive cells present in Nkx6.1-/- mice. These results establish that MafA acts downstream of Nkx6.1 in pancreatic development (Fig. 4).
Fig. 4.
A simplified schematic depiction of the role of MafA and other select transcription factors in islet β cell development. The proposed position of MafA is based on the timing of expression and a predominant functional role in insulin transcription. Pdx-1 is necessary in early pancreatic bud growth (14, 15), whereas Neurogenin 3 (Ngn3) is important in the specification of all endocrine islet cell types (32). In contrast, Nkx6.1 is involved in the formation of the majority of islet β cells (22).
Final Comments
The importance of MafA in insulin gene activation, together with its unique expression in islet β cells, raises the likelihood that MafA is a principal activator of islet β cell formation and function. The development of transgenic over-expression and cell-selective knockout strategies would further define the role of MafA in these processes. It is also possible that a detailed understanding of MafA-mediated activation would be valuable for diagnosing and treating β cell-compromised diabetic patients.
Supplementary Material
Acknowledgments
This work was supported by National Institutes of Health Grant P01 DK42502 (to R.S.), Juvenile Diabetes Research Foundation Grant CDA 2-2001-728 (to M.S.), and Juvenile Diabetes Research Foundation Postdoctoral Fellowships 3-2001-678 (to T.M.) and 3-2003-579 (to I.A.). Partial support was also provided by the Vanderbilt University Diabetes Research and Training Center Public Health Service Grant P60 DK20593 to the Molecular Biology Core Laboratory.
This paper was submitted directly (Track II) to the PNAS office.
Abbreviations: En, embryonic day n; MARE, Maf-response element.
References
- 1.Ohneda, K., Ee, H. & German, M. (2000) Semin. Cell Dev. Biol. 11, 227-233. [DOI] [PubMed] [Google Scholar]
- 2.Stein, R. (2001) in Handbook of Physiology, eds., Cherrington, A. and Jefferson, J. (American Physiology Society, Washington, D.C.), pp. 25-78.
- 3.Ohlsson, H., Karlsson, K. & Edlund, T. (1993) EMBO J. 12, 4251-4259. [DOI] [PMC free article] [PubMed] [Google Scholar]
- 4.Sander, M., Neubuser, A., Kalamaras, J., Ee, H. C., Martin, G. R. & German, M. S. (1997) Genes Dev. 11, 1662-1673. [DOI] [PubMed] [Google Scholar]
- 5.Naya, F. J., Stellrecht, C. M. M., and Tsai, M.-J. (1995) Genes Dev. 9, 1009-1019. [DOI] [PubMed] [Google Scholar]
- 6.Kataoka, K., Han, S. I., Shioda, S., Hirai, M., Nishizawa, M. & Handa, H. (2002) J. Biol. Chem. 277, 49903-49910. [DOI] [PubMed] [Google Scholar]
- 7.Olbrot, M., Rud, J., Moss, L. G. & Sharma, A. (2002) Proc. Natl. Acad. Sci. USA 99, 6737-6742. [DOI] [PMC free article] [PubMed] [Google Scholar]
- 8.Matsuoka, T., Zhao, L., Artner, I., Jarrett, H. W., Friedman, D., Means, A. & Stein, R. (2003) Mol. Cell. Biol. 23, 6049-6062. [DOI] [PMC free article] [PubMed] [Google Scholar]
- 9.Guz, Y., Montminy, M. R., Stein, R., Gamer, L. W., Wright, C. V. E. & Teitelman, G. (1995) Development (Cambridge, U.K.) 121, 11-18. [DOI] [PubMed] [Google Scholar]
- 10.Wilson, M. E., Scheel, D. & German, M. S. (2003) Mech. Dev. 120, 65-80. [DOI] [PubMed] [Google Scholar]
- 11.Stoffers, D. A., Ferrer, J., Clarke, W. L. & Habener, J. F. (1997) Nat. Genet. 17, 138-139. [DOI] [PubMed] [Google Scholar]
- 12.Malecki, M. T., Jhala, U. S., Antonellis, A., Fields, L., Orban, T., Saad, M., Doria, A., Warram, J. H., Montminy, M. & Krolewski, A. S. (1999) Nat. Genet. 23, 323-328. [DOI] [PubMed] [Google Scholar]
- 13.Yasuda, T., Kajimoto, Y., Fujitani, Y., Watada, H., Yamamoto, S., Watarai, T., Umayahara, Y., Matsuhisa, M., Gorogawa, S., Kuwayama, Y., et al. (2002) Diabetes 51, 224-230. [DOI] [PubMed] [Google Scholar]
- 14.Ahlgren, U., Jonsson, J. & Edlund, H. (1996) Development (Cambridge, U.K.) 122, 1409-1416. [DOI] [PubMed] [Google Scholar]
- 15.Offield, M. F., Jetton, T. L., Stein, R., Labosky, T., Ray, M., Magnuson, M., Hogan, B. & Wright, C. V. E. (1996) Development (Cambridge, U.K.) 122, 983-995. [DOI] [PubMed] [Google Scholar]
- 16.Jonsson, J., Carlsson, L., Edlund, T. & Edlund, H. (1994) Nature 371, 606-609. [DOI] [PubMed] [Google Scholar]
- 17.Oster, A., Jensen, J., Serup, P., Galante, P., Madsen, O. D. & Larsson, L. (1998) J. Histochem. Cytochem. 46, 707-715. [DOI] [PubMed] [Google Scholar]
- 18.Pang, K., Mukonoweshuro, C. & Wong, G. G. (1994) Proc. Natl. Acad. Sci. USA 91, 9559-9563. [DOI] [PMC free article] [PubMed] [Google Scholar]
- 19.Pictet, R. & Rutter, W. J. (1972) in Handbook of Physiology, eds, Steiner, D. F., and Frenkel, N. (Williams & Wilkins, Baltimore) pp. 25-66.
- 20.Naya, F. J., Huang, H.-P., Qiu, Y., Mouth, H., DeMayo, F. J., Leiter, A. B. & Tsai, M.-J. (1997) Genes Dev. 11, 2323-2334. [DOI] [PMC free article] [PubMed] [Google Scholar]
- 21.St-Onge, L., Sosa-Pineda, B., Chowdhury, K., Mansouri, A. & Gruss, P. (1997) Nature 387, 406-409. [DOI] [PubMed] [Google Scholar]
- 22.Sander, M., Sussel, L., Conners, J., Scheel, D., Kalamaras, J., Dela Cruz, F., Schwitzgebel, V., Hayes-Jordan, A. & German, M. (2000) Development (Cambridge, U.K.) 127, 5533-5540. [DOI] [PubMed] [Google Scholar]
- 23.Sharma, A., Fucho-DeMane, D., Henderson, E., Efrat, S. & Stein, R. (1995) Mol. Endocrinol. 9, 1468-1476. [DOI] [PubMed] [Google Scholar]
- 24.Zhao, L., Cissell, M. A., Henderson, E. Colbran, R. & Stein, R. (2000) J. Biol. Chem. 275, 10532-10537. [DOI] [PubMed] [Google Scholar]
- 25.Efrat, S., Linde, S., Kofod, H., Spector, D., Delannoy, M., Grant, S., Hanahan, D. & Baekkeskov, S. (1988) Proc. Natl. Acad. Sci. USA 85, 9037-9041. [DOI] [PMC free article] [PubMed] [Google Scholar]
- 26.Hamaguchi, K. & Leiter, E. H. (1990) Diabetes 39, 415-425. [DOI] [PubMed] [Google Scholar]
- 27.Shieh, S.-Y. & Tsai, M.-J. (1991) J. Biol. Chem. 266, 16708-16714. [PubMed] [Google Scholar]
- 28.Samaras, S. E., Zhao, L., Means, A., Henderson, E., Matsuoka, T.-A. & Stein, R. (2003) J. Biol. Chem. 278, 12263-12270. [DOI] [PubMed] [Google Scholar]
- 29.Deltour, L., Leduque, P., Blume, N., Madsen, O., Dubois, P., Jami, J. & Bucchini, D. (1993) Proc. Natl. Acad. Sci. USA 90, 527-531. [DOI] [PMC free article] [PubMed] [Google Scholar]
- 30.Planque, N., Leconte, L., Coquelle, F. M., Benkhelifa, S., Martin, P., Felder-Schmittbuhl, M. P. & Saule, S. (2001) J. Biol. Chem. 276, 35751-35760. [DOI] [PubMed] [Google Scholar]
- 31.Kataoka, K., Noda, M. & Nishizawa, M. (1994) Mol. Cell. Biol. 14, 700-712. [DOI] [PMC free article] [PubMed] [Google Scholar]
- 32.Gradwohl, G., Dierich, A., Lemeur, M. & Guillemot, F. (2000). Proc. Natl. Acad. Sci. USA 97, 1607-1611. [DOI] [PMC free article] [PubMed] [Google Scholar]
Associated Data
This section collects any data citations, data availability statements, or supplementary materials included in this article.


