

Abstract
The visual system is characterized by precise retinotopic mapping of each eye, together with exquisitely matched binocular projections. In many species, the inputs that represent the eyes are segregated into ocular dominance columns in primary visual cortex (V1), whereas in rodents, this does not occur. Ten-m3, a member of the Ten-m/Odz/Teneurin family, regulates axonal guidance in the retinogeniculate pathway. Significantly, ipsilateral projections are expanded in the dorsal lateral geniculate nucleus and are not aligned with contralateral projections in Ten-m3 knockout (KO) mice. Here, we demonstrate the impact of altered retinogeniculate mapping on the organization and function of V1. Transneuronal tracing and c-fos immunohistochemistry demonstrate that the subcortical expansion of ipsilateral input is conveyed to V1 in Ten-m3 KOs: Ipsilateral inputs are widely distributed across V1 and are interdigitated with contralateral inputs into eye dominance domains. Segregation is confirmed by optical imaging of intrinsic signals. Single-unit recording shows ipsilateral, and contralateral inputs are mismatched at the level of single V1 neurons, and binocular stimulation leads to functional suppression of these cells. These findings indicate that the medial expansion of the binocular zone together with an interocular mismatch is sufficient to induce novel structural features, such as eye dominance domains in rodent visual cortex.
Keywords: binocular, ipsilateral, ocular dominance, Odz, Teneurin
Introduction
A key organizing principle of the nervous system is topography. In the visual pathway, intrinsic guidance and activity-dependent mechanisms interact to generate a faithful representation of the sensory periphery (Huberman et al. 2006, 2008; Cang et al. 2008; Leamey et al. 2009; Triplett et al. 2009). In binocular species, the generation of a cohesive visual map requires the precise mapping of each retina as well as the visuotopic alignment of the inputs from the 2 eyes. This is first observed in the dorsal lateral geniculate nucleus (dLGN), where retinal inputs are segregated (Grubb et al. 2003) but topographically in register (Malpeli and Baker 1975; Reese and Jeffery 1983). True integration of binocular drive occurs within V1. The manner in which binocular input comes into alignment varies between species. In carnivorans and primates visuotopically overlapping geniculocortical inputs representing the ipsilateral and contralateral eyes are typically segregated into ocular dominance columns (ODCs) (Hubel and Wiesel 1962, 1968, 1972; Wiesel et al. 1974; Shatz et al. 1977), whereas in rodents, no segregation is apparent. Rather, there is a single laterally located binocular zone and a more medial monocular region (Drager 1975; Gordon and Stryker 1996; Antonini et al. 1999).
While activity-dependent processes clearly regulate the degree of drive provided to V1 by each eye across species (Hubel et al. 1977; Kleinschmidt et al. 1987; Gordon and Stryker 1996; Fagiolini and Hensch 2000), the rules that determine whether a given species will exhibit ocular segregation in V1 are unclear (Adams and Horton 2009). Classically, Hebbian processes have been invoked to account for segregation in carnivorans and primates (Katz and Shatz 1996), although more recent evidence for alternate activity-dependent (Turrigiano and Nelson 2004; Hensch 2005) and -independent (Katz and Crowley 2002) mechanisms has challenged this.
The mapping of the ipsilateral projection within the cortex defines the binocular zone. This varies with eye position and generally shows a good correlation with the absence or presence of ocular segregation (reviewed in Leamey, Protti, et al., 2008). The impact of altered ipsilateral mapping on ocular segregation has proved difficult to test, as it typically requires drastic manipulations, such as monocular enucleation, which confound interpretation.
We recently reported that Ten-m3, a member of the Ten-m/Odz/Teneurin family of transmembrane glycoproteins, regulates ipsilateral retinogeniculate mapping. In Ten-m3 knockout (KO) mice, ipsilateral inputs arise from the ventrotemporal crescent, as in wild types (WTs), but are not confined to their usual patch within the dorsomedial dLGN. Instead, their territory is elongated to encompass the entire dorsomedial to ventrolateral extent of the nucleus, encroaching on its dorsomedial border as well as invading the normally monocular ventrolateral region (Leamey et al. 2007). Ipsilateral and contralateral terminals are segregated as normal; however, since contralateral topography is not appreciably altered, ipsilateral, and contralateral terminals are no longer aligned. Ten-m3 KOs exhibit profound deficits in visually mediated behavior, which are reversed by acute monocular inactivation (Leamey et al. 2007).
The mapping changes in the thalamus of Ten-m3 KOs provide an excellent opportunity to probe mechanisms of binocular mapping in V1. We show that these changes have a profound impact: an expanded but visuotopically misaligned binocular zone, suppression of binocular responsiveness, and induction of ocular segregation.
Materials and Methods
All experiments were performed in mice and approved by the University of Sydney Animal Ethics Committee and/or MIT's Committee on Animal Care and followed NIH and NHMRC guidelines. The Ten-m3−/− (KO) strain is maintained on a Black6/Sv129 cross; a mixed background is essential for the survival of the KOs (Leamey et al. 2007). Animals were obtained from heterozygote matings. WT littermates (Ten-m3+/+) were used as controls. Only pigmented animals were used in this study. Genotyping was performed by polymerase chain reaction from tail biopsy.
Transneuronal Tracing and Autoradiography
Adult mice were anesthetized by inhalation of 2–4% isoflurane in oxygen. A monocular intravitreal injection of 150 μCi of tritiated proline (Amersham) was made using a Hamilton syringe. Mice were euthanized 7 days later by an overdose of sodium pentobarbitone (50 mg/kg) and perfused with 0.9% saline followed by 4% paraformaldehyde in 0.1 M phosphate buffer (pH 7.4). Brains were postfixed overnight, cryoprotected, and 40 μm–thick coronal frozen sections were prepared and mounted on acid-cleaned slides. Slides were dipped in NTB-2 emulsion (Kodak) and stored in darkness for 8–12 weeks. Slides were then developed in D-19 developer (Kodak), fixed, and coverslipped. Images were captured using an AxioCam digital camera under dark field illumination through a ×5 objective and merged using Adobe Photoshop. Signal intensity was thresholded using Image J (NIH). For quantification, the visual cortex, borders defined from adjacent Nissl-stained sections, was divided arithmetically along its mediolateral axis into 3 equal parasagittal subdivisions: medial, middle, and lateral thirds. In order to gain a measure of the overall change in label distribution along the entire extent of V1, the visual cortex was divided into 5 subregions along its rostrocaudal axis: caudal, midcaudal, mid, midrostral, and rostral. From each of these regions, one high-quality section, largely free of cutting or processing artifacts, was chosen for analysis. In one WT case, a good quality section was not available from one region, whereas in one KO case, good quality sections were not available from 2 of these regions. Consequently, a total of 19 WT and 18 KO sections, comprising 3–5 sections each from 4 animals per genotype were quantitatively analyzed using Image J (NIH Image). Transneuronal label was quantified based on the following formula: label = (Threshold Pixel DenistyVisual Layer IV − Threshold Pixel DensityNonvisual Layer IV). V1 layer IV pixel density was then expressed as a proportion of total label above background in each parasagittal third of V1. The number of patches was determined based on accumulations of high, separated by low levels of label by 2 independent observers who were blind to genotype. Since the values obtained from the 2 naïve observers were identical, there was no need to pool data prior to statistical analysis. For this analysis, 3 V1 sections, sampled from caudal, middle, and rostral regions of V1 to give an estimate of change across the cortical region, were quantified from each of 4 WTs and 4 KOs to give a total of 12 sections per genotype.
Immunoreactivity for c-fos
Mice were anesthetized as above, and 1 μL of 2 μM tetrodotoxin (TTX; Sigma) was injected into the vitreous chamber of the left eye. Following recovery, animals were placed in a darkened room for 16–20 h, prior to a 2 h exposure to a novel light environment. They were immediately euthanized and perfused as above. For binocular stimulation, the TTX injection step was omitted. For tangential sections, 2% paraformaldehyde was used, and the cortices were removed and flattened between glass slides prior to postfixation in 4% paraformaldehyde. Coronal or tangential sections were cut at 40 μm on a freezing microtome. Sections were quenched prior to incubation overnight in α-c-fos antibody (1:5000; Santa Cruz). Reaction product was visualized with a biotinylated secondary antibody followed by incubation in ABC kit (Vector) and a diaminobenzidine reaction. Sections were coverslipped and photographed under bright field illumination using an Olympus digital camera. Image J (NIH) was used to subtract background and threshold images. Threshold values were conserved for all sections from each animal. The level of immunoreactivity was calculated based on the amount of labeled pixels within layer IV of each animal. An immunoreactivity index was calculated based on the following formula: Immunoreactivity index = (Threshold Pixel DenistyLayer IV − Threshold Pixel DensityLayer II/III) within medial, middle, and lateral thirds of individual sections analyzed. Layer IV pixel density was then expressed as a proportion of total label above background in each parasagittal third of V1. Twelve coronal sections from each genotype, sampled as described above for the transneuronal labeling (3 sections each from 4 animals), were used for the quantitative analysis of the monocular inactivation.
Intrinsic Optical Imaging
Animals at age postnatal day (P)28–P35 from Ten-m3 WT and Ten-m3 KO groups were anesthetized with 10% urethane (1.5 mg/kg, intraperitoneal [i.p.]) and 1% chlorprothixene (0.2 mg/animal, i.p.). The region of the skull overlying V1 was removed, and the animal was fixed in a custom-made stereotaxic frame, the region of interest was covered with a 1.5% agarose solution and glass coverslip. The cortical surface was illuminated with a tungsten halogen light source and imaged with a custom built system with a CCD camera (Cascade 512B, Roper Scientific). Green light (550 nm) was used to obtain a reference image of the cortical vasculature at the surface, while red light (630 nm) was used for acquisition of intrinsic hemodynamic signals, focusing 300–500 μm below the cortical surface. In a 62 × 72° region of visual space, a drifting horizontal or vertical white bar (9 s/cycle) over a uniformly gray background was presented to both eyes as well as to the contralateral and ipsilateral eye alone. Images were captured at 15 frames/s for a stimulus session of 25 min. A temporal high-pass filter (135 frames) was used to remove slow noise components. A temporal Fast Fourier Transform (FFT) component at the stimulus frequency (9 s−1) was calculated pixel by pixel from the set of images (Kalatsky and Stryker 2003). To calculate the magnitude of response, the amplitude of the FFT component normalized to that of background in the absence of visual stimuli was measured, and the average of the top 2000 pixels in the map was obtained. Retinotopic maps were generated from the phase of the FFT of the response time series at the stimulus frequency. Borders of V1 were determined by inspection of the normalized magnitude maps, and the appropriate area was defined as a region of interest. Phase maps were superimposed onto the normalized magnitude map, which demonstrated the extent of the topographic map onto the area of signal, allowing the location of the V1/V2 border to be confirmed. Amplitude maps were measured as a fractional change in reflectance. To measure the size of the cortical area of stimulation, the magnitude map was filtered by thresholding at a level of 40% of the peak response, and the number of pixels measured within a defined area of interest. Ocular dominance values were calculated using the ocular dominance index (ODI), which takes the difference in magnitude of the contralateral and ipsilateral stimulated maps divided by the sum of the magnitudes; a value of −1 represents predominant ipsilateral drive, while a value of +1 represents predominant contralateral drive. The number of ipsilaterally driven clusters was determined by dividing V1 into 3 equal parasagittal subdivisions and counting as described for the c-fos labeling. For display purposes, each display map was converted to its own minimum and maximum.
Single-Unit In Vivo Electrophysiology
Mice were anaesthetized with 1.2–1.5 mg/kg i.p. injection of urethane and placed in a modified stereotax (Kopf Instruments). The location of the eyes in the orbit and orientation of the pupils was visually inspected for any evidence of eye misalignment to check for the presence of a strabismus. A subset was photographed for later inspection. A craniectomy was made over V1 in the right hemisphere. Recordings were made using resin-coated tungsten electrodes (∼1 MΩ at 1 kHz; FHC, Bowdoin, ME), mounted in a headstage (Digitimer, Hertfordshire, UK), and attached to a micromanipulator (Exfo-Burleigh, Quebec, Canada). Signals were amplified and band-pass filtered (600–4 kHz) using a NeuroLog amplifier (Digitimer). Waveforms were captured using manually determined thresholds and stored to disk using EXPO (EXPO developed by Peter Lennie, University of Rochester).
Visual Stimuli
Computer generated stimuli (EXPO) were projected via an LCD projector (EMP-TW700, Epson) onto a matt white fixed front projection screen (1700 × 1270 mm; 2130 mm diagonal) placed 75 cm in front of the animal. Visually responsive cells were identified by monocularly stimulating the ipsilateral eye with a full-field drifting grating. If no responses were detected on a given penetration, the contralateral eye was stimulated. Receptive fields (RFs) for each eye were mapped using a square stimulus of 10° × 10° visual angle, presented (for a duration of 250 ms every 500 ms) pseudorandomly throughout the extent of the visual field (over 500 presentations total). Averaged RF maps were generated using custom software (Matlab). RF sizes were estimated by thresholding maps and then back converting the pixel counts to angle of visual degrees in both x and y dimensions. Similarly, ipsilateral and contralateral RF separation was determined by calculating the linear distance between the peaks of eye-specific RF maps and back-converting pixel distances to degrees of visual extent. The ODI was calculated as follows: ODI = (C − I)/(C + I). C and I correspond to the mean response to stimulation of the contralateral eye and ipsilateral eye, respectively. A second measurement, the monocularity index (MI; MI = |ODI|) was used to determine ocular dominance independent of the eye.
Stimulus for binocular and monocular responses consisted of a full-field drifting sinusoidal grating (drift rate: 2°/sec, spatial frequency: 0.03 cycle/°, orientation: 0°) presented for 1 s, every 2 s for 40 iterations. A sequence of contralateral monocular–binocular–contralateral monocular visual stimulation was used for each unit. Cells were considered to exhibit suppression or facilitation only if their mean binocular response was less or greater than their response to both blocks of monocular activation.
Statistical Analysis
Statistical analysis was performed using Excel, Matlab, and SPSS, using Student's t-test, Mann–Whitney U-test, analysis of variance (ANOVA), Kolmogorov–Smirnov test, and Fisher's exact test as indicated in the Results.
Results
Ten-m3 Deletion Alters the Distribution of Ipsilateral Drive in V1
We first addressed how deletion of Ten-m3 affects the distribution of ipsilateral inputs to V1, using transneuronal tracing from one eye. In WT mice, contralateral inputs uniformly spanned the mediolateral extent of V1 (Fig. 1a), whilst ipsilateral inputs were confined to lateral V1 (Fig. 1b). The patterning of contralateral projections to V1 in Ten-m3 KOs was largely similar to WTs (Fig. 1c). The distribution of ipsilateral input was, however, dramatically different in KOs. Terminals were distributed across much of the mediolateral extent of V1 (Fig. 1d), unlike WTs, where they were confined laterally. Quantitative analysis confirmed these differences, showing that the percentage of ipsilateral labeling in the lateral-most third of V1 was significantly lower in KOs but significantly higher in both middle and medial thirds (Fig. 1e; % label (mean ± standard error of the mean, SEM): WT medial (1.67 ± 0.40), middle (25.73 ± 1.61), and lateral (72.58 ± 1.87); KO medial (9.76 ± 2.43), middle (47.05 ± 3.72), and lateral (43.19 ± 3.94); multivariate ANOVA, medial: F1,35 = 11.412, P = 0.002; middle: F1,35 = 28.782, P < 0.001; lateral: F1,35 = 46.939, P < 0.001; NWT = 19 sections from 4 animals, NKO = 18 sections from 4 animals). The significant medial-ward shift in the distribution of ipsilateral projections indicates that V1 also receives aberrant ipsilateral retinal input in a pattern which is consistent with the mismapping previously observed in the dLGN (Leamey et al. 2007). Thus, the broad pattern of connectivity between thalamus and cortex appears to be conserved in Ten-m3 KOs, and the ipsilateral retinogeniculate mismapping is transferred to V1.
Figure 1.

Ipsilateral inputs to V1 invade medial, normally monocular, regions of V1 in Ten-m3 KOs. (a–d) WT (a,b) and Ten-m3 KO mice (c,d) following transneuronal transport of tritiated proline from the eye. Contralateral (a,c) and ipsilateral (b,d) coronal sections through V1. Plots below each photomicrograph show relative signal intensity across layer IV to highlight fluctuations. Label in the contralateral cortex of WTs (a) is uniformly distributed across the medial to lateral extent of layer IV. Ipsilateral labeling in WTs was restricted to the lateral region of V1 (b). In Ten-m3 KOs, labeling in contralateral V1 is largely uniform, although areas of reduced density are also visible (c, arrow). KO ipsilateral label is not confined to lateral V1, rather, signal is distributed over much of the mediolateral extent of V1 (d). Label is aggregated into clusters (arrows). Boundaries of V1 are marked by arrowheads. Scale bar: 500 μm, applies to all images. (e) Quantification of the proportion of transneuronal label present in the medial, middle, and lateral thirds of ipsilateral V1 as a percentage of total V1 label. Ten-m3 KO mice showed a significant reduction in lateral label and significant increases in middle and medial transneuronal label (mean ± SEM). (f) Quantification of the number of patches of transneuronal label in medial, middle, and lateral divisions of ipsilateral V1. Ten-m3 KO mice showed less patches in lateral V1 and significantly more patches in central and medial V1 (mean ± SEM). **P < 0.01, ***P < 0.001; multivariate ANOVA, for details, see Results.
In addition to the change in the mediolateral extent of ipsilateral input, we observed evidence of terminal clustering in KOs (Fig. 1d, arrows). This contrasts with WTs, where a single patch of label in the lateral portion of V1 was consistently observed (Fig. 1b). KOs exhibited significantly more patches in medial and middle zones, with the trend reversed in the lateral-most region (Fig. 1f; number of patches (mean ± SEM): WT medial (0.00 ± 0.00), middle (0.33 ± 0.14), and lateral (1.00 ± 0.00); KO medial (0.58 ± 0.15), middle (1.17 ± 0.17), and lateral (0.83 ± 0.11); multivariate ANOVA, medial: F1,22 = 15.40, P = 0.001; middle: F1,22 = 14.47, P = 0.001; lateral: F1,22 = 2.200, P = 0.152; NWT = 12 sections, NKO = 12 sections). We also saw evidence for patches of reduced labeling in contralateral V1 of KOs (Fig. 1c, arrow, clearly visible as a dip in the intensity plot), although they were less prominent than in the ipsilateral hemisphere. This lack of clarity is very likely due to “spillover” of tracer, a limitation of this method, which has more impact in the contralateral than the ipsilateral hemisphere (LeVay et al. 1978; Stryker and Harris 1986). This bias would be expected to be even more pronounced in mice given the very large dominance of the contralateral projection.
To determine whether the mismapped ipsilateral inputs are able to drive cortical neurons, we examined the expression of the product of the immediate early gene c-fos (a marker for neural activity) in acutely monocularly inactivated mice. This revealed the extent of monocular drive to both cortical hemispheres (for monocular inactivation experiments, laterality is given with respect to the active eye). In WTs, high levels of reactivity were distributed across much of the mediolateral extent of contralateral V1, predominantly in layer IV (Fig. 2a). In ipsilateral V1, c-fos immunoreactivity was confined to the lateral region, with little or no staining in medial V1 (Fig. 2b), consistent with the pattern of transneuronal labeling. In contrast, Ten-m3 KOs exhibited patches of c-fos reactivity distributed across much of the mediolateral extent of ipsilateral V1 (Fig. 2d, arrows). Although activity was consistently high across much of contralateral V1 in KOs, patches of low reactivity, strongly resembling the patches of high reactivity seen in the other hemisphere in terms of size and distribution, were also frequently observed (Fig. 2c, arrows). The patchy distribution seen with both c-fos staining and transneuronal tracing suggested that the medial expansion of ipsilateral mapping may induce the formation of domains dominated by inputs from one eye or the other.
Figure 2.

Altered pattern of ipsilateral drive in V1 as demonstrated using c-fos immunoreactivity. (a–d) Coronal sections through visual cortex of monocularly inactivated WT (a,b) and Ten-m3 KOs (c,d). Contralateral to the active eye, uniformly high levels of reactivity are seen in WT (a). Ipsilateral to the active eye, high levels of reactivity are restricted to lateral V1 (b). In Ten-m3 KOs, patches of low reactivity (arrows) are visible within the generally high level of staining within contralateral V1 (c). Ipsilateral to the active eye, patches of high reactivity (arrows) are scattered across the entire medial to lateral extent of V1 (d). Arrowheads mark V1 boundaries. Scale in a: 500 μm, applies to a–d. M: medial, L: lateral. (e–j) Tangential sections through layer IV of monocularly inactivated WT (e,f) and 2 KO mice (g,h and i,j), contralateral (e,g,i), and ipsilateral (f,h,j) to the active eye. In WTs, uniformly high immunoreactivity is seen across contralateral V1 (e), whereas in the ipsilateral hemisphere it is confined to lateral V1 (f, medial border of binocular region highlighted by dotted white line). In Ten-m3 KOs, staining is mostly high in contralateral V1, although patches of very low reactivity are also seen (g,i,*). In the ipsilateral hemisphere, intense staining is not restricted to lateral V1 and comprises distinct bands of high reactivity (arrows), which are separated by bands of low reactivity (h,j). Dotted white line indicates extent of binocular zone seen in WT for comparison. Dashed black lines mark V1 borders. Scale in e: 500 μm, applies to e–j. (k) Percentage of label in medial, middle, and lateral thirds of ipsilateral V1. Significant changes in the distribution of ipsilateral label are observed in Ten-m3 KOs (mean ± SEM). (l) Ten-m3 KO mice show significant increases in the number of ipsilaterally driven patches in medial and middle thirds of V1 (mean ± SEM). *P < 0.05, **P < 0.01; multivariate ANOVA, for details, see Results.
To further examine this possibility, tangential sections through layer IV from monocularly inactivated mice were used to determine the pattern of monocular cortical drive across the extent of V1, using c-fos immunoreactivity as a measure of activity. In all WTs examined (NWT = 6), high reactivity was present across contralateral V1 (Fig. 2e), and in a single, large patch in the lateral region of ipsilateral V1 (Fig. 2f). A strikingly different distribution was observed in ipsilateral V1 of Ten-m3 KOs, where clusters of highly immunoreactive neurons were aggregated in bands, which traversed much of V1, interdigitated with regions of very low immunoreactivity (Fig. 2h,j). While clusters encroaching onto medial V1 were observed in all KOs (NKO = 6), the pattern of staining varied between cases (compare h and j; see also Supplementary Fig. 1). Activity was generally high in contralateral V1, though similar patches of low reactivity, presumably revealing ipsilaterally dominated domains, were also observed (Fig. 2g,i). Quantification confirmed these changes. In KOs, staining was significantly reduced in lateral V1 and increased in middle V1 with a nonsignificant increase for medial V1 (Fig. 2k; % label (mean ± SEM): WT medial (7.78 ± 1.40), middle (30.08 ± 1.66), and lateral (62.14 ± 2.80); KO medial (10.92 ± 1.327), middle (42.50 ± 2.91), and lateral (46.58 ± 3.29); multivariate ANOVA, medial: F1,10 = 2.65, P = 0.135; middle: F1,10 = 13.76, P = 0.004; lateral: F1,10 = 12.99, P = 0.005; NWT = 12 sections, NKO = 12 sections). KO mice also showed a significant increase in the number of patches of c-fos–reactive regions in medial and middle V1 (Fig. 2l; number of patches (mean ± SEM): WT medial (0.00 ± 0.00), middle (0.83 ± 0.17), and lateral (1.00 ± 0.00); KO medial (0.67 ± 0.21), middle (2.67 ± 0.33), and lateral (2.00 ± 0.58); multivariate ANOVA, medial: F1,10 = 10.00, P = 0.010; middle: F1,10 = 24.20, P = 0.001; lateral: F1,10 = 3.00, P = 0.114; NWT = 12 sections, NKO = 12 sections). The patchy, medially shifted distribution of c-fos expression provides further evidence that the aberrant ipsilateral drive induces the novel emergence of eye dominance domains within V1 of Ten-m3 KOs. Interestingly, the clustering observed with c-fos staining was more punctate than seen with transneuronal tracing. This may reflect technical limitations of the transneuronal technique, as mentioned above. Alternatively, intracortical mechanisms may result in an accentuation of the functional segregation beyond that which is present anatomically. Inspection of adjacent Nissl-stained sections revealed no evidence of clustering (data not shown), indicating that the increased clustering is not associated with cytoarchitectonic changes in V1.
Deletion of Ten-m3 Causes No Change in Receptive Field Properties and Retinotopy of the Contralateral Projection
Our anatomical data lead to predictions regarding cortical activation: 1) single V1 neurons may receive inputs from disparate parts of the visual field via the ipsilateral and contralateral eyes; 2) the formation of eye dominance domains may increase the degree to which cells are dominated by a single eye; and 3) the visuotopically misaligned projections may influence binocular compared with monocular responses of V1 neurons. To test these hypotheses, single-unit recordings and intrinsic signal optical imaging in anesthetized mice were performed. For quantitative analysis of single-unit data, sampling was restricted to lateral V1. Although this will tend to minimize the impact of the mapping changes, since we have previously shown that ipsilateral retinogeniculate axon terminals map inappropriately not only in the ventrolateral, but also the dorsomedial dLGN (Leamey et al. 2007), lateral V1 is a valid location for assessment of the impact of the mismapping. Importantly, sampling from this region specifically permitted ipsilateral, contralateral, and binocular data from WTs to serve as an appropriate control. For comparison, a few cells recorded from more medial V1 are described qualitatively.
Mean firing rates showed no difference between KO and WT following stimulation of either the contralateral or the ipsilateral eye (data not shown). RF size exhibited no difference between WT and KO for either eye (Fig. 3a; KO contra: 16.2 ± 0.7°; WT contra: 17.5 ± 0.8°; KO ipsi: 15.6 ± 1.1°; WT ipsi: 16.0 ± 0.6°; NWT = 24, NKO =32; ANOVA: F3,94 = 0.78, P = 0.509). The location of the centers of contralateral RFs in lateral V1 did not differ from WT for either the azimuth or the elevation axes (mean ± SEM: azimuth WT 19.77 ± 3.11°, KO 17.49 ± 3.89°; Mann–Whitney U-test, U = 773, P = 0.98; elevation WT 7.87 ± 1.82°, KO 17.46 ± 3.89°; Mann–Whiney U-test, U = 731, P = 0.47; NWT = 25 cells, NKO = 36 cells). Recordings from more medial V1 showed the expected retinotopic shift toward more peripheral visual field for both WTs and Ten-m3 KOs (Fig. 3f). No evidence of strabismus was observed in either WTs or KOs.
Figure 3.

Increased separation of contralateral and ipsilateral drives in Ten-m3 KOs. (a) Mean RF size for contralateral and ipsilateral eyes (mean ± SEM). No difference is observed between WT and Ten-m3 KO (ANOVA: F3,94 = 0.778, P = 0.509). (b) Population differences in contralateral and ipsilateral drives separation between WT (n = 25) and KO (n = 32) V1 units. KO RFs have significantly greater separation compared with WT (mean ± SEM). WT: 9.5 ± 2.2° (median 0°); KO: 25.9 ± 3.7° (median 18.0°); Mann–Whitney U-test, *P < 0.01. (c) Sample normalized RF “heat” maps (see Materials and Methods) recorded from lateral area 17 of WT (top row) and Ten-m3 KO mice (bottom row) during stimulation of the contralateral (left) and ipsilateral (center) eyes. Overlay maps of activity from both eyes (right) show far greater separation of ipsilateral and contralateral drives in Ten-m3 KOs. The vertical meridian is shown as a white line, dotted lines mark 10° on either side. (d) Histogram plotting percentage of cells with a given ODI (1 = contralateral only, 0 = equal ipsilateral and contralateral drives, and −1 = ipsilateral only) in WTs (black, top) and Ten-m3 KOs (gray, bottom). Note the presence of a subset of entirely ipsilaterally driven cells in Ten-m3 KOs. (e) Cumulative probability distribution function of MI shows a shift to the right indicating a significant increase in monocularity in Ten-m3 KOs. This is also reflected in the mean MI (inset). *P < 0.001. (f) Preservation of contralateral retinotopy and aberrant ipsilateral drive in Ten-m3 KOs. RFs of single units recorded from central V1 in WT (left) Ten-m3 KO (middle and right) mice. The contralateral RFs are centered around 75° eccentricity in both WT (left) and KO (middle). This region of visual space also received drive from the central, binocular field via the ipsilateral eye (right) in Ten-m3 KOs. The ipsilateral and contralateral inputs are mismatched with respect to visual space. The WT cell did not receive ipsilateral drive above background levels.
Individual V1 Neurons Receive Inputs from Disparate Parts of the Visual Space in Ten-m3 KOs
In WT mice, the ipsilateral and contralateral RFs were typically overlapping (Fig. 3c, top) and their mean center-to-center separation, 9.5 ± 2.2° (median 0°) of visual space (Fig. 3b), was smaller than the mean RF diameter obtained here (Fig. 3a) and previously reported in mice (10–20°) (Drager 1975; Wang and Burkhalter 2007; Niell and Stryker 2008). This was not the case for Ten-m3 KOs where the mean separation of RFs, 25.9 ± 3.7° (median 18.0°), was almost 3-fold greater than in WTs (Fig. 3c, bottom, Fig. 3b; Mann–Whitney U-test, U = 493, P = 0.001; NWT = 25 cells, NKO = 32; 4 KO cells received exclusively monocular input and were excluded from this analysis). The marked increase in the separation of RFs, in the absence of change in RF size, means that ipsilateral and contralateral RFs are typically not overlapping in Ten-m3 KOs.
Our anatomical data predict that central and medial V1 will also receive ipsilateral drive in Ten-m3 KOs. This was found to be the case, with medially situated V1 cells receiving ipsilateral and contralateral inputs from disparate regions of the visual field (2 of 4 cells recorded from this region received ipsilateral input, an example is shown in Figure 3f, middle and right panels show mismatched contralateral and ipsilateral RFs, respectively, from central V1 in a KO). Recordings from a similar region of V1 in WTs (Fig. 3f, left) did not exhibit ipsilateral drive (contralateral responses only in 6 of 6 cells).
Deletion of Ten-m3 Drives Ocular Segregation in V1
We next asked whether the altered ipsilateral mapping alters the ODI of Ten-m3 KO mice (ODIs of 1 and −1 indicate entirely contralateral or ipsilateral drive, respectively; see Materials and Methods). This analysis suggested that the mean ODI is higher in KOs 0.37 ± 0.08 (median: 0.49, range −1 to 1) versus WTs 0.13 ± 0.07 (median: 0.09, range −0.53 to 0.89; Mann–Whitney U-test, P = 0.005; NWT = 24, NKO = 36). These values may not be an accurate measure of the ODI, however, and therefore must be interpreted with caution. Notably, the value obtained for WTs is somewhat lower than values more typically reported in the literature (0.2, e.g., Tropea et al. 2009) suggesting there may be a bias in our sample. This is very likely due to the fact that our sampling procedure necessarily entailed searching for visually responsive cells monocularly (see Materials and Methods). Moreover, since our focus was to investigate the representation of the ipsilateral eye, this was typically done using the ipsilateral eye. If no ipsilaterally driven responses were found on a given penetration, then the contralateral eye was tested. This procedure would thus explain a bias toward binocularly driven cells. The procedure was identical for WTs and KOs, however, and an absolute measure of the ODI was not the focus of this study. A notable feature of the ODI data, however, is the wider distribution of values in KOs than in WTs, including examples of cells with entirely contralateral drive (n = 2) and entirely ipsilateral drive (Fig. 3d). No WT cells exhibited entirely monocular drive. In order to assess the level of ocular dominance independent of the eye and thus free of any potential bias that may have been caused by our sampling procedure, the absolute value of the ODI or MI was calculated. The mean MI is significantly higher in KOs than WTs (Fig. 3e, inset; WT (mean ± SEM): 0.27 ± 0.05 (median: 0.22, range: 0.0178–0.8894); KO (mean ± SEM): 0.54 ± 0.05 (median: 0.53, range: 0.0094–1); NWT = 24, NKO = 36; Mann–Whitney U-test, U = 508, P < 0.001). The significant rightward shift of the MI cumulative probability function for Ten-m3 KOs is consistent with an increase in monocularity (Fig. 3e; Kolmogorov–Smirnov test, D = 0.44, P = 0.004).
Intrinsic signal optical imaging of hemodynamic signals in response to monocular stimulation was used to examine whether deletion of Ten-m3 induced the formation of novel eye dominance domains in Ten-m3 KOs, as suggested by the anatomical and single-unit data. In WTs, a single large domain receiving a moderate degree of ipsilateral drive was confined to the lateral region of V1, whereas contralateral drive was relatively uniform across V1. In Ten-m3 KOs, domains, which received little or no contralateral drive, were present. These regions received very strong ipsilateral drive (Fig. 4a). These domains tended to form bands which invaded middle and medial V1 and were generally similar in overall structure to the c-fos–positive bands observed in tangential sections from monocularly inactivated mice (compare with Fig. 2h,j). The bands observed with optical imaging frequently appear broader than those seen with c-fos staining, presumably due to differences inherent with the two techniques. In the c-fos experiments, monocularly deprived mice were exposed to an unconstrained natural visual environment, whereas in optical imaging, anesthetized subjects were exposed to a drifting bar over a restricted part of the visual field. Additionally, the c-fos signal is strongest in layer IV, whereas the optical imaging signal predominantly reflects activity in layer II/III (McCurry et al. 2010; Tropea et al. 2010). No significant differences in the average amplitudes for contralateral (WT: 0.0034 vs. KO: 0.0030, P = 0.18, Student's t-test) or ipsilateral (WT: 0.0018 vs. KO: 0.0015, P = 0.33, Student's t-test) between WT (n = 8) and KO (n = 10) responses were observed. The overall ODI showed a significant shift toward the ipsilateral eye in Ten-m3 KOs for the azimuth axis (when a bar drifting periodically in the azimuth dimension was used to stimulate the visual field) and a nonsignificant trend for the elevation axis (Fig. 4b; (mean ODI ± SEM) azimuth: WT = 0.35 ± 0.08, KO = 0.02 ± 0.04, Student's t-test, P < 0.001, NKO = 5, NWT = 7; elevation: WT = 0.25 ± 0.10, KO = 0.08 ± 0.08, Student's t-test, P = 0.34, NKO = 5, NWT = 5). The region of V1 receiving ipsilateral input was also enlarged in KOs, with ipsilaterally dominated regions extending significantly more medially in Ten-m3 KOs (Fig. 4c; (mean number of ipsilateral-driven patches ± SEM) WT: medial (0.0 ± 0.0), middle (0.7 ± 0.15), and lateral (1.0 ± 0.0); KO: medial (0.25 ± 0.16), middle (1.62 ± 0.18), and lateral (1.12 ± 0.12); multivariate ANOVA, medial: F = 2.961,16, P = 0.104; middle: F = 15.311,16, P = 0.001; lateral: F = 0.071,16, P = 0.276).
Figure 4.

Optical imaging demonstrates increased segregation of eye-specific domains in V1 of Ten-m3 KO mice. (a) Contralateral-driven (“contra”) and ipsilateral-driven (“ipsi”) maps are displayed along with a map of ODI values. ODI is a measure of the relative eye-specific drive of each pixel, as calculated by the difference in response magnitudes from the contralateral- and ipsilateral-driven maps divided by the sum. Segregated regions (white arrows) of strong ipsilateral (blue) and contralateral (red) drive are detected in Ten-m3 KO mice (bottom 2 rows). For display purposes, each map is shown relative to its own maximum and minimum response. Ipsilateral regions extend more medially than the typical binocular zone of the WT (top row). The ipsilaterally responsive region is outlined in dotted blue in the “ipsi” panel and black in the “ODI” panel. Scale bar = 500 μm, A = anterior, L = lateral. The bar shows the fractional change in reflection in grayscale. The area of the amplitude map displayed is an outline of V1, confirmed with a corresponding phase map demonstrating the retinotopic borders of V1 (see Materials and Methods). The color bar represents the ODI value; blue (−1) indicates predominate ipsilateral drive, while red (+1) represents predominant contralateral drive. Dashed white line indicates V1 borders. (b) In the azimuth maps, the average ODI value of the ipsilaterally driven region is significantly decreased in the Ten-m3 KO mouse (indicating more ipsilateral drive, **P < 0.001). In the elevation maps, the average ODI value of the ipsilaterally driven region shows no statistically significant difference although there is a trend of decrease in Ten-m3 KOs (mean ± SEM). (c) Measurement of the number of ipsilateral territories within the medial, middle, and lateral thirds of V1 shows that ipsilateral input is shaped into patches that project more medially in Ten-m3 KOs than in WTs (*P = 0.001; mean ± SEM).
Mismapped Ipsilateral Input Contributes to Suppression of Binocular Activity in V1
We previously reported that Ten-m3 KOs have severe deficits in performance of visual behavioral tasks when using both eyes which were rescued by monocular inactivation (Leamey et al. 2007). It is possible that the mismapped ipsilateral input in these animals leads to suppression of cortical activity during binocular stimulation. To investigate this, we used c-fos immunoreactivity to compare cortical activation levels in WTs and KOs following binocular viewing. In WTs (NWT = 3), both hemispheres displayed high levels of c-fos staining across layer IV (Fig. 5a,b), suggesting ubiquitous activation during normal viewing conditions. In contrast, KO mice (NKO = 3) exhibited markedly lower activity levels (Fig. 5c,d). Interestingly, c-fos reactivity was lower not only in the medial part of V1, which receives inappropriate ipsilateral input, but also in the lateral, normally binocular zone. The presence of reduced activity in lateral V1, suggesting the presence of suppression due to mismatched inputs in this region, is consistent with the fact that although the most dramatic effect of the ipsilateral retinal mismapping was the expansion into ventrolateral dLGN, mapping was also altered in dorsomedial dLGN (Leamey et al. 2007). The uniformity of the suppression across the mediolateral extent of V1 confirms the validity of using lateral V1 to assess the impact of the mismapping in our electrophysiological studies. Tangential sections through layer IV reveal the consistency of this result across the entire extent of V1 (Fig. 5e,f); these differences were significant (Fig. 5g; (mean intensity ± SEM) WT: 40.98 ± 1.87, KO: 23.27 ± 5.64, mixed-model ANOVA; F1,4 = 8.21, P = 0.046). The activity levels observed in Ten-m3 KOs during binocular viewing were markedly lower than those observed in the hemisphere contralateral to the active eye during monocular viewing (Fig. 2); no such difference was observed for WT. Quantification confirmed that monocular inactivation restored activity to WT levels (Fig. 5g; WTmonocular: 38.48 ± 1.79; KOmonocular: 42.89 ± 1.96; ANOVA between-group comparison of label intensity, F1,4 = 0.849, P = 0.409; KObinocular significantly different to all other groups (KOmonocular, WTmonocular, and WTbinocular), Tukey's honestly significant difference post hoc; P < 0.001 for all comparisons). These data provide evidence for a global suppression of V1 activity during binocular viewing in KOs, which is fully rescued in the contralateral hemisphere by acute monocular inactivation.
Figure 5.

Binocular stimulation induces suppression in V1. (a–d) Coronal sections through the left and right hemispheres of V1 from WT (a,b) and Ten-m3 KO (c,d) mice following binocular stimulation. WT mice display uniformly high levels of c-fos reactivity across both hemispheres, whereas much lower levels of staining are seen in KOs. Arrowheads mark V1 boundaries. Scale in a: 500 μm, applies to a–f. M: medial, L: lateral. (e,f) Tangential sections through layer IV of V1 in WT (e) and Ten-m3 KO (f). KOs exhibit markedly reduced activity across the whole of V1. (g) Quantification of c-fos immunoreactivity in WT and KO mice following binocular and monocular stimulation. Pixel density (mean ± SEM) was significantly higher across the whole of V1 in WTs versus Ten-m3 KOs under binocular viewing, but this was rescued under monocular viewing, with WT and KO immunoreactivity at similar levels. *P < 0.05, for details, see Results. (h) Proportion of cells that were facilitated (F), showed no change (N), or were suppressed (S) in WTs and Ten-m3 KOs. In WTs, over two-third of cells were facilitated, and the remainder showed no change during binocular versus contralateral monocular stimulation; no WT cells showed suppression. In KOs, there was a significant increase in the proportion of cells, which showed suppression, and the number of facilitated cells was reduced (6 of 22 cells exhibited suppression in KO compared with 0 of 22 cells in WT, P < 0.05, Fisher's exact test). (i) Poststimulus time histograms showing responses from typical WT cell (top) and an example of a KO cell which exhibited suppression (bottom). Panels show activity during contralateral monocular stimulation (Monoc, left), binocular stimulation (Binoc, middle), and a return to contralateral monocular stimulation (right). Note the almost complete suppression of activity under binocular stimulation in the KO cell.
To assess the possibility that misaligned interocular drive induces suppression at the level of single neurons, we compared firing rates of single units in lateral V1 of WTs and KOs during contralateral monocular and binocular stimulation. We found that in 27% of KO neurons (6/22), firing levels were reduced during binocular versus contralateral monocular stimulation (Fig. 5i; bottom). This was significantly different from WTs where no cells (0/22) exhibited suppression during binocular stimulation (P = 0.011, Fisher's exact test). Intracortical application of bicuculline together with assessment of monocular and binocular responses reveals that interocular inhibition within V1 is significantly greater in Ten-m3 KOs than in WT mice, indicating that intracortical inhibition may at least in part contribute to the differences observed in visually evoked cortical suppression (data not shown).
In WTs, the majority (>2/3) of cells were facilitated by binocular stimulation (Fig. 5i; top) and the remainder displayed no change (Fig. 5h). While facilitation was observed in some Ten-m3 KO cells, this was less frequent than in WT (Fig. 5h). Although seen in only a minority of cells, the significant increase in suppression under binocular conditions in Ten-m3 KOs is consistent with the behavioral phenotype (Leamey et al. 2007) and c-fos data.
Discussion
Summary
Our data demonstrate that ipsilateral inputs to V1 are expanded and mismatched with respect to contralateral inputs in Ten-m3 KOs. Geniculocortical topography does not compensate for the expanded ipsilateral retinogeniculate input, resulting in a broader binocular zone. Remarkably, this is associated with ocular segregation and suppression of V1 activity. The mapping changes are summarized in Figure 6.
Figure 6.
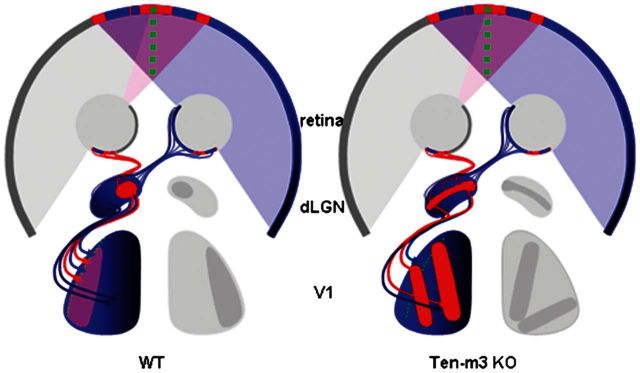
Summary of mapping changes in Ten-m3 KO mice. Schematic diagram showing normal mapping of the right visual field onto the retinogeniculocortical pathway in WT mice (left) and changes in Ten-m3 KOs (right). In WTs, the central, binocular field (purple) is viewed by the ventrotemporal region of both retinae. Contralaterally projecting retinal axons from the right temporal retina (blue) and ipsilaterally projecting axons from the left temporal retina (red) target the dorsomedial segment of the dLGN. More nasal parts of the retina view more peripheral parts of the visual field, which are not seen by the other eye (dark blue shading). Axons from nasal retina target ventrolateral dLGN. Axons from the dLGN, in turn, project topographically onto V1. Axons from dorsomedial dLGN target the lateral region of V1. These represent integrated binocular inputs and are thus signified by the purple shading. Axons from ventrolateral dLGN target more medial monocular parts of V1 (dark blue). This generates a single cohesive topographic map of the right visual field in V1 of the left hemisphere. In Ten-m3 KO mice, ipsilateral axons (red) arise from the same region of retina as in WT mice but aberrantly target the entire ventrolateral extent of the dLGN. Thalamocortical mapping is not altered to compensate for this and, thus, ipsilateral inputs, viewing central binocular field project not only to the lateral, normally binocular region of V1, but also target medial, normally monocular part of V1. Since thalamocortical topography is not altered, this area also receives input from peripheral visual field from the other eye. The expansion of ipsilateral input and misalignment of ipsilateral and contralateral inputs drives the formation of ipsilaterally and contralaterally dominated regions within layer 4 of V1. The increased segregation of the mismatched ipsilateral and contralateral inputs is signified by the presence of patches of red (ipsilateral) within a predominantly blue (contralateral) region.
V1 is Largely Normal in Ten-m3 KOs
Ten-m3 is a homophilic transmembrane glycoprotein (Oohashi et al. 1999; Feng et al. 2002) expressed in topographically corresponding gradients in retina, dLGN, and V1 (Leamey et al. 2007; Leamey, Glendining, et al. 2008). It is a downstream target of Emx2 (Li et al. 2006), which specifies caudal cortical identities (Bishop et al. 2000; Hamasaki et al. 2004). Ten-m3 deletion could, therefore, act directly on V1 or the geniculocortical pathway, instead of—or as well as—inducing changes secondarily to the altered retinogeniculate mapping. Interestingly, V1 appears largely normal in Ten-m3 KOs, with lamination (Leamey et al. 2007), broad geniculocortical topography, contralateral retinotopy, and response properties such as RF size remaining unchanged, suggesting that Ten-m3 exerts a relatively minor direct influence on these aspects of cortical development. A direct role in the formation of the geniculocortical projection cannot, however, be ruled out at this stage. Here, Ten-m3 could act to maintain the coherence of the thalamocortical projection and, in its absence, axons may defasciculate. Although a parsimonious interpretation of our data is that the dramatic ipsilateral retinogeniculate mismapping is critical for the ocular segregation observed here, the relative role of this versus any potential role for Ten-m3 in the formation of the geniculocortical projection cannot be established in the absence of additional manipulations such as a conditional KO along with higher resolution analysis of axonal arborization and thalamocortical topography. Ten-m3 is not expressed in callosal neurons (Leamey, Glendining, et al. 2008) making it unlikely that its deletion would directly impact this pathway.
Mechanisms Regulating the Formation of Eye Dominance Domains
To our knowledge, this is the first study where a genetic manipulation has induced eye-specific segregation in the cortex of a species where it is not usually present. While the mechanism by which Ten-m3 induces ocular segregation remains to be determined, we propose that the mismapping of the ipsilateral retinogeniculate projection, which leads to a broadening of the binocular zone, and an increase in inhibition due to the interocular mismatch, both also prominent and unusual features of the Ten-m3 KO phenotype, are likely candidates. Other studies have found that misprojecting retinogeniculate axons can segregate in the dLGN. These arise due to disruption of axon guidance cues at the optic chiasm, as in Siamese cats (Guillery 1969; Cucchiaro and Guillery 1984) or ephrin-B mutants (Rebsam et al. 2009). Deletion of ephrin-As (Pfeiffenberger et al. 2005) and Zic4 (Horng et al. 2009) also results in patchy retinogeniculate projections. A role for activity in alignment is demonstrated by experiments showing duplication of the retinocollicular but not the retinogeniculocortical map results in the bifurcation of the corticocollicular projection to match the retinocollicular patterning (Triplett et al. 2009).
The mechanisms regulating the formation of ocular dominance domains in V1 are similarly thought to include axon guidance cues and activity-dependent mechanisms. Studies suggesting that ocular segregation is present from early stages and independent of input from the eyes have argued that molecular cues lay the basis for the columns (Crowley and Katz 1999, 2000). Ten-m3′s expression pattern, which is graded and not patchy (Leamey, Glendining, et al. 2008), makes it an unlikely candidate. Rather, the mismatch between contralateral and ipsilateral RFs of cortical neurons and increased inhibition within V1 is likely to promote ocular segregation.
Activity-dependent mechanisms contribute to ocular segregation in carnivorans and primates. Pharmacological blockade of all retinal activity disrupts ocular dominance structure in cats (Stryker and Harris 1986). Visually driven activity, however, is not required (Rakic 1976; Stryker and Harris 1986; Crair et al. 1998), although the misalignment of the inputs from the 2 eyes, as in strabismus, can increase monocularity and sharpen ODC borders (Shatz et al. 1977; Lowel 1994). Although strabismus was not observed in Ten-m3 KOs, it is impossible to rule out that a slight undetected strabismus could have contributed to the observed misalignment of ipsilateral and contralateral inputs.
Binocular innervation of a single tectum in nonmammalian vertebrates also causes segregation via activity-dependent processes (Constantine-Paton and Law 1978; Schmidt 1978; Boss and Schmidt 1984; Cline et al. 1987). In Ten-m3 KOs, the separation of the ipsilateral and contralateral RFs is greater than mean RF diameter. The misalignment of visual drive may, therefore, promote ocular segregation in Ten-m3 KOs. The eye dominance domains observed frequently resembled islands or patches. Interestingly, the ODCs representing far peripheral field in primates (where RFs are similar in size to those in rodents) also have this appearance (LeVay et al. 1985), as do the ipsilaterally dominated regions, which emerge before eye opening in cats (Crair et al. 1998). Future studies should address whether eye-specific domains are present in V1of Ten-m3 KOs at eye opening, implicating spontaneous retinal activity (Huberman et al. 2006), or whether visual experience is required. The pattern of spontaneous retinal activity in Ten-m3 KOs remains to be assessed. The normal time course of retinogeniculate segregation (CA Leamey, unpublished data), however, suggests that this is largely normal.
While our data are consistent with a role for activity in the formation of eye dominance domains in Ten-m3 KO mice, the inappropriately mapped ipsilateral drive is not in keeping with strictly Hebbian models of activity-dependent development. Such models predict that inappropriate ipsilateral inputs should be eliminated via competitive interactions with the dominant contralateral projection. The maintenance of nonaligned binocular inputs suggests that other mechanisms of activity-dependent plasticity (Turrigiano and Nelson 2004; Hensch 2005) may be involved.
The proportion of V1 receiving binocular inputs may be an important determinant of ocular segregation. There is an association between the number of ipsilaterally projecting cells (correlating tightly with eye position and the size of the binocular field) and the proportion of V1 devoted to processing binocular inputs, with the presence (or absence) of ODCs (Leamey, Protti, et al. 2008). In Ten-m3 KOs, the origin of the ipsilateral projection (Leamey et al. 2007) and thus size of the binocular field are not altered. The proportion of V1, which receives binocular input, is, however, greatly increased in Ten-m3 KOs. Computational models of columnar organization rely on both the magnitude of lateral excitation/inhibition and the size of the mapped region relative to these interactions to generate feature-specific segregation (Obermayer et al. 1990; Swindale 1996; Yu et al. 2005; Goodhill 2007). The maturation of inhibitory circuits is a key regulator of ocular dominance plasticity (reviewed in Hensch 2005). Modeling predicts that in the presence of inhibition, a large enough region dominated by one eye must break up to allow emergence of the other eye's inputs (Toyoizumi and Miller 2009). Although not a direct test of this hypothesis, our data are consistent with these findings, showing that a broadening of the binocular zone, together with inhibition within V1 (enhanced by the interocular mismatch), can drive ocular segregation. Interestingly, in Zic4 mutants where there is an interocular mismatch but no increase the size of the binocular zone, eye dominance domains are not present (S Horng, KA Glendining, CA Runyan, MA Iglesias, T Inoue, J Aruga, K Millen, CA Leamey, M Sur, in preparation), further suggesting that the broadening of the binocular zone could be an important factor.
Relationship to Ocular Dominance Columns in Other Species
The eye dominance domains induced by deletion of Ten-m3 bear a remarkable resemblance to ODCs described in carnivorans and primates. Ten-m3 is present in the primate visual system (Murray et al. 2008), suggesting that its deletion was not required for the evolution of ODCs. ODCs in carnivorans and primates have characteristics beyond the clustering of geniculocortical afferents in layer IV (Livingstone and Hubel 1984; Tychsen et al. 2004). The extent to which the eye dominance domains seen here take on these characteristics remains to be determined and thus this terminology is used to distinguish them from ODCs. Segregation does not appear to enhance vision in Ten-m3 KOs; this is probably due to the deleterious impact of the interocular mismatch on vision rather than suggesting a negative impact of the formation of eye dominance domains.
Misaligned Input from the 2 Eyes Leads to Cortical Suppression across V1 in Ten-m3 KOs
Ten-m3 KOs exhibit profound deficits in visually mediated behavior, which were reversed by monocular inactivation (Leamey et al. 2007). We here show that ipsilateral inputs can drive medial V1 monocularly. Furthermore, ipsilateral and contralateral RFs are mismatched at the level of individual V1 neurons and binocular, but not monocular, stimulation causes functional suppression not only in the medial, normally monocular part of V1, but also in the lateral, normally binocular zone. Consistent with this, our electrophysiology data indicate that even in lateral V1, ipsilateral, and contralateral inputs are mismatched, and this is associated with functional suppression. The correlation between the activation patterns observed using c-fos and the behavioral phenotype is striking and identifies V1 as a major locus of the effect of the interocular mismatch. The extent of the suppression is surprising given that the ipsilateral projection comprises only 2–3% of retinal axons (Drager and Olsen 1980). Although amplified ∼5-fold in terms of cortical drive (Drager and Olsen 1980), this still comprises only the minority of sensory input to V1. Significantly, our results show that the ipsilateral mismapping effectively disables the otherwise functional, largely normally mapped and dominant contralateral projection.
While present, the functional suppression observed during recordings in V1 was less widespread than predicted by the c-fos or behavioral (Leamey et al. 2007) data. Of note, the latter both reflect activity levels in awake-behaving animals, whereas electrophysiology was performed in anesthetized preparations. Anesthetic may reduce the impact of suppression, either directly and/or via influences on top-down processing mechanisms associated with conscious visual perception. Additionally, since only a portion of the visual field (∼90° of 320°) is stimulated during our recordings, and their confinement to lateral V1 (which may minimize the mapping defect), could also reduce the suppression observed here. Alterations in callosal connectivity could be induced by the altered ipsilateral input and may contribute. Such changes have been noted in Siamese cats (Shatz and LeVay 1979) where the primary defect is a decussation error at the optic chiasm (Guillery 1969).
Conclusions
Our data demonstrate that deletion of Ten-m3 induces a medial expansion of the binocular zone and an interocular mismatch. Remarkably, this is associated with ocular segregation. The work illustrates the importance of binocular alignment and provides a unique model for investigating mechanisms underlying the recovery of visual function following an interocular mismatch, as occurs in strabismic amblyopia. The demonstration that mismapped inputs are maintained and can suppress an otherwise functional cortical area has implications for understanding how wiring defects interact with activity-dependent processes to yield alterations in neural function not predicted by classical models of neural development.
Supplementary Material
Supplementary material can be found at: http://www.cercor.oxfordjournals.org/
Funding
This work was supported by National Health and Medical Research Council (NHMRC) project grant 302003 and University of Sydney Research and Development grants to C.A.L., NHMRC project grant 632685 to C.A.L. and L.R.M., and National Institutes of Health grants EY007023 and EY019152 and a grant from the Simons Foundation to M.S.
Acknowledgments
Author contributions: S.M. performed anatomical tracing and c-fos staining. S.M. and A.S. performed single-unit recordings. S.H. performed optical imaging experiments. L.R.M. contributed to transneuronal tracing experiments. S.M., S.H., and A.S. analyzed data. C.A.L., A.S., M.S., and S.M. designed experiments. C.A.L., A.S., S.M., and M.S. wrote the paper. Conflict of Interest: None declared.
References
- Adams D, Horton J. Ocular dominance columns: enigmas and challenges. Neuroscientist. 2009;15:62–77. doi: 10.1177/1073858408327806. [DOI] [PMC free article] [PubMed] [Google Scholar]
- Antonini A, Fagiolini M, Stryker MP. Anatomical correlates of functional plasticity in mouse visual cortex. J Neurosci. 1999;19:4388–4406. doi: 10.1523/JNEUROSCI.19-11-04388.1999. [DOI] [PMC free article] [PubMed] [Google Scholar]
- Bishop KM, Goudreau G, O'Leary DD. Regulation of area identity in the mammalian neocortex by Emx2 and Pax6. Science. 2000;288:344–349. doi: 10.1126/science.288.5464.344. [DOI] [PubMed] [Google Scholar]
- Boss VC, Schmidt JT. Activity and the formation of ocular dominance patches in dually innervated tectum of goldfish. J Neurosci. 1984;4:2891–2905. doi: 10.1523/JNEUROSCI.04-12-02891.1984. [DOI] [PMC free article] [PubMed] [Google Scholar]
- Cang J, Wang L, Stryker MP, Feldheim DA. Roles of ephrin-as and structured activity in the development of functional maps in the superior colliculus. J Neurosci. 2008;28:11015–11023. doi: 10.1523/JNEUROSCI.2478-08.2008. [DOI] [PMC free article] [PubMed] [Google Scholar]
- Cline HT, Debski EA, Constantine-Paton M. N-methyl-D-aspartate receptor antagonist desegregates eye-specific stripes. Proc Natl Acad Sci U S A. 1987;84:4342–4345. doi: 10.1073/pnas.84.12.4342. [DOI] [PMC free article] [PubMed] [Google Scholar]
- Constantine-Paton M, Law MI. Eye-specific termination bands in tecta of three-eyed frogs. Science. 1978;202:639–641. doi: 10.1126/science.309179. [DOI] [PubMed] [Google Scholar]
- Crair MC, Gillespie DC, Stryker MP. The role of visual experience in the development of columns in cat visual cortex. Science. 1998;279:566–570. doi: 10.1126/science.279.5350.566. [DOI] [PMC free article] [PubMed] [Google Scholar]
- Crowley JC, Katz LC. Development of ocular dominance columns in the absence of retinal input. Nat Neurosci. 1999;2:1125–1130. doi: 10.1038/16051. [DOI] [PubMed] [Google Scholar]
- Crowley JC, Katz LC. Early development of ocular dominance columns. Science. 2000;290:1321–1324. doi: 10.1126/science.290.5495.1321. [DOI] [PubMed] [Google Scholar]
- Cucchiaro J, Guillery RW. The development of the retinogeniculate pathway in normal and albino ferrets. Proc R Soc Lond B Biol Sci. 1984;223:141–164. doi: 10.1098/rspb.1984.0087. [DOI] [PubMed] [Google Scholar]
- Drager UC. Receptive fields of single cells and topography in mouse visual cortex. J Comp Neurol. 1975;160:269–290. doi: 10.1002/cne.901600302. [DOI] [PubMed] [Google Scholar]
- Drager UC, Olsen JF. Origins of crossed and uncrossed retinal projections in pigmented and albino mice. J Comp Neurol. 1980;191:383–412. doi: 10.1002/cne.901910306. [DOI] [PubMed] [Google Scholar]
- Fagiolini M, Hensch TK. Inhibitory threshold for critical-period activation in primary visual cortex. Nature. 2000;404:183–186. doi: 10.1038/35004582. [DOI] [PubMed] [Google Scholar]
- Feng K, Zhou XH, Oohashi T, Morgelin M, Lustig A, Hirakawa S, Ninomiya Y, Engel J, Rauch U, Fassler R. All four members of the Ten-m/Odz family of transmembrane proteins form dimers. J Biol Chem. 2002;277:26128–26135. doi: 10.1074/jbc.M203722200. [DOI] [PubMed] [Google Scholar]
- Goodhill GJ. Contributions of theoretical modeling to the understanding of neural map development. Neuron. 2007;56:301–311. doi: 10.1016/j.neuron.2007.09.027. [DOI] [PubMed] [Google Scholar]
- Gordon JA, Stryker MP. Experience-dependent plasticity of binocular responses in the primary visual cortex of the mouse. J Neurosci. 1996;16:3274–3286. doi: 10.1523/JNEUROSCI.16-10-03274.1996. [DOI] [PMC free article] [PubMed] [Google Scholar]
- Grubb MS, Rossi FM, Changeux JP, Thompson ID. Abnormal functional organization in the dorsal lateral geniculate nucleus of mice lacking the beta 2 subunit of the nicotinic acetylcholine receptor. Neuron. 2003;40:1161–1172. doi: 10.1016/s0896-6273(03)00789-x. [DOI] [PubMed] [Google Scholar]
- Guillery RW. An abnormal retinogeniculate projection in Siamese cats. Brain Res. 1969;14:739–741. doi: 10.1016/0006-8993(69)90213-3. [DOI] [PubMed] [Google Scholar]
- Hamasaki T, Leingartner A, Ringstedt T, O'Leary DD. EMX2 regulates sizes and positioning of the primary sensory and motor areas in neocortex by direct specification of cortical progenitors. Neuron. 2004;43:359–372. doi: 10.1016/j.neuron.2004.07.016. [DOI] [PubMed] [Google Scholar]
- Hensch TK. Critical period plasticity in local cortical circuits. Nat Rev Neurosci. 2005;6:877–888. doi: 10.1038/nrn1787. [DOI] [PubMed] [Google Scholar]
- Horng S, Kreiman G, Ellsworth C, Page D, Blank M, Millen K, Sur M. Differential gene expression in the developing lateral geniculate nucleus and medial geniculate nucleus reveals novel roles for Zic4 and Foxp2 in visual and auditory pathway development. J Neurosci. 2009;29:13672–13683. doi: 10.1523/JNEUROSCI.2127-09.2009. [DOI] [PMC free article] [PubMed] [Google Scholar]
- Hubel DH, Wiesel TN. Receptive fields, binocular interaction and functional architecture in the cat's visual cortex. J Physiol. 1962;160:106–154. doi: 10.1113/jphysiol.1962.sp006837. [DOI] [PMC free article] [PubMed] [Google Scholar]
- Hubel DH, Wiesel TN. Receptive fields and functional architecture of monkey striate cortex. J Physiol. 1968;195:215–243. doi: 10.1113/jphysiol.1968.sp008455. [DOI] [PMC free article] [PubMed] [Google Scholar]
- Hubel DH, Wiesel TN. Laminar and columnar distribution of geniculo-cortical fibers in the macaque monkey. J Comp Neurol. 1972;146:421–450. doi: 10.1002/cne.901460402. [DOI] [PubMed] [Google Scholar]
- Hubel DH, Wiesel TN, LeVay S. Plasticity of ocular dominance columns in monkey striate cortex. Philos Trans R Soc Lond B Biol Sci. 1977;278:377–409. doi: 10.1098/rstb.1977.0050. [DOI] [PubMed] [Google Scholar]
- Huberman AD, Feller MB, Chapman B. Mechanisms underlying development of visual maps and receptive fields. Annu Rev Neurosci. 2008;31:479–509. doi: 10.1146/annurev.neuro.31.060407.125533. [DOI] [PMC free article] [PubMed] [Google Scholar]
- Huberman AD, Speer CM, Chapman B. Spontaneous retinal activity mediates development of ocular dominance columns and binocular receptive fields in V1. Neuron. 2006;52:247–254. doi: 10.1016/j.neuron.2006.07.028. [DOI] [PMC free article] [PubMed] [Google Scholar]
- Kalatsky VA, Stryker MP. New paradigm for optical imaging: temporally encoded maps of intrinsic signal. Neuron. 2003;38:529–545. doi: 10.1016/s0896-6273(03)00286-1. [DOI] [PubMed] [Google Scholar]
- Katz LC, Crowley JC. Development of cortical circuits: lessons from ocular dominance columns. Nat Rev Neurosci. 2002;3:34–42. doi: 10.1038/nrn703. [DOI] [PubMed] [Google Scholar]
- Katz LC, Shatz CJ. Synaptic activity and the construction of cortical circuits. Science. 1996;274:1133–1138. doi: 10.1126/science.274.5290.1133. [DOI] [PubMed] [Google Scholar]
- Kleinschmidt A, Bear MF, Singer W. Blockade of “NMDA” receptors disrupts experience-dependent plasticity of kitten striate cortex. Science. 1987;238:355–358. doi: 10.1126/science.2443978. [DOI] [PubMed] [Google Scholar]
- Leamey CA, Glendining KA, Kreiman G, Kang ND, Wang KH, Fassler R, Sawatari A, Tonegawa S, Sur M. Differential gene expression between sensory neocortical areas: potential roles for Ten_m3 and Bcl6 in patterning visual and somatosensory pathways. Cereb Cortex. 2008;18:53–66. doi: 10.1093/cercor/bhm031. [DOI] [PubMed] [Google Scholar]
- Leamey CA, Merlin S, Lattouf P, Sawatari A, Zhou X, Demel N, Glendining KA, Oohashi T, Sur M, Fassler R. Ten_m3 regulates eye-specific patterning in the mammalian visual pathway and is required for binocular vision. PLoS Biol. 2007;5:2077–2092. doi: 10.1371/journal.pbio.0050241. [DOI] [PMC free article] [PubMed] [Google Scholar]
- Leamey CA, Protti DA, Dreher B. Comparative survey of the mammalian visual system with reference to the mouse. In: Williams RW, Chalupa LM, editors. Eye, retina and visual system of the mouse. Cambridge (MA): MIT Press; 2008. pp. 35–60. [Google Scholar]
- Leamey CA, Van Wart A, Sur M. Intrinsic patterning and experience-dependent mechanisms that generate eye-specific projections and binocular circuits in the visual pathway. Curr Opin Neurobiol. 2009;19:181–187. doi: 10.1016/j.conb.2009.05.006. [DOI] [PubMed] [Google Scholar]
- LeVay S, Connolly M, Houde J, Van Essen DC. The complete pattern of ocular dominance stripes in the striate cortex and visual field of the macaque monkey. J Neurosci. 1985;5:486–501. doi: 10.1523/JNEUROSCI.05-02-00486.1985. [DOI] [PMC free article] [PubMed] [Google Scholar]
- LeVay S, Stryker MP, Shatz CJ. Ocular dominance columns and their development in layer IV of the cat's visual cortex: a quantitative study. J Comp Neurol. 1978;179:223–244. doi: 10.1002/cne.901790113. [DOI] [PubMed] [Google Scholar]
- Li H, Bishop KM, O'Leary DD. Potential target genes of EMX2 include Odz/Ten-M and other gene families with implications for cortical patterning. Mol Cell Neurosci. 2006;33:136–149. doi: 10.1016/j.mcn.2006.06.012. [DOI] [PubMed] [Google Scholar]
- Livingstone MS, Hubel DH. Specificity of intrinsic connections in primate primary visual cortex. J Neurosci. 1984;4:2830–2835. doi: 10.1523/JNEUROSCI.04-11-02830.1984. [DOI] [PMC free article] [PubMed] [Google Scholar]
- Lowel S. Ocular dominance column development: strabismus changes the spacing of adjacent columns in cat visual cortex. J Neurosci. 1994;14:7451–7468. doi: 10.1523/JNEUROSCI.14-12-07451.1994. [DOI] [PMC free article] [PubMed] [Google Scholar]
- Malpeli JG, Baker FH. The representation of the visual field in the lateral geniculate nucleus of Macaca mulatta. J Comp Neurol. 1975;161:569–594. doi: 10.1002/cne.901610407. [DOI] [PubMed] [Google Scholar]
- McCurry CL, Shepherd JD, Tropea D, Wang KH, Bear MF, Sur M. Loss of Arc renders visual cortex impervious to the effects of sensory deprivation or experience. Nat Neurosci. 2010;13:450–457. doi: 10.1038/nn.2508. [DOI] [PMC free article] [PubMed] [Google Scholar]
- Murray KD, Rubin CM, Jones EG, Chalupa LM. Molecular correlates of laminar differences in the macaque dorsal lateral geniculate nucleus. J Neurosci. 2008;28:12010–12022. doi: 10.1523/JNEUROSCI.3800-08.2008. [DOI] [PMC free article] [PubMed] [Google Scholar]
- Niell CM, Stryker MP. Highly selective receptive fields in mouse visual cortex. J Neurosci. 2008;28:7520–7536. doi: 10.1523/JNEUROSCI.0623-08.2008. [DOI] [PMC free article] [PubMed] [Google Scholar]
- Obermayer K, Ritter H, Schulten K. A principle for the formation of the spatial structure of cortical feature maps. Proc Natl Acad Sci U S A. 1990;87:8345–8349. doi: 10.1073/pnas.87.21.8345. [DOI] [PMC free article] [PubMed] [Google Scholar]
- Oohashi T, Zhou XH, Feng K, Richter B, Morgelin M, Perez MT, Su WD, Chiquet-Ehrismann R, Rauch U, Fassler R. Mouse ten-m/Odz is a new family of dimeric type II transmembrane proteins expressed in many tissues. J Cell Biol. 1999;145:563–577. doi: 10.1083/jcb.145.3.563. [DOI] [PMC free article] [PubMed] [Google Scholar]
- Pfeiffenberger C, Cutforth T, Woods G, Yamada J, Renteria RC, Copenhagen DR, Flanagan JG, Feldheim DA. Ephrin-As and neural activity are required for eye-specific patterning during retinogeniculate mapping. Nat Neurosci. 2005;8:1022–1027. doi: 10.1038/nn1508. [DOI] [PMC free article] [PubMed] [Google Scholar]
- Rakic P. Prenatal genesis of connections subserving ocular dominance in the rhesus monkey. Nature. 1976;261:467–471. doi: 10.1038/261467a0. [DOI] [PubMed] [Google Scholar]
- Rebsam A, Petros TJ, Mason C. Switching retinogeniculate axon laterality leads to normal targeting but abnormal eye-specific segregation that is activity-dependent. J Neurosci. 2009;29:14855–14863. doi: 10.1523/JNEUROSCI.3462-09.2009. [DOI] [PMC free article] [PubMed] [Google Scholar]
- Reese BE, Jeffery G. Crossed and uncrossed visual topography in dorsal lateral geniculate nucleus of the pigmented rat. J Neurophysiol. 1983;49:877–885. doi: 10.1152/jn.1983.49.4.877. [DOI] [PubMed] [Google Scholar]
- Schmidt JT. Retinal fibers alter tectal positional markers during the expansion of the retinal projection in goldfish. J Comp Neurol. 1978;177:279–295. doi: 10.1002/cne.901770207. [DOI] [PubMed] [Google Scholar]
- Shatz CJ, LeVay S. Siamese cat: altered connections of visual cortex. Science. 1979;204:328–330. doi: 10.1126/science.432647. [DOI] [PubMed] [Google Scholar]
- Shatz CJ, Lindstrom S, Wiesel TN. The distribution of afferents representing the right and left eyes in the cat's visual cortex. Brain Res. 1977;131:103–116. doi: 10.1016/0006-8993(77)90031-2. [DOI] [PubMed] [Google Scholar]
- Stryker MP, Harris WA. Binocular impulse blockade prevents the formation of ocular dominance columns in cat visual cortex. J Neurosci. 1986;6:2117–2133. doi: 10.1523/JNEUROSCI.06-08-02117.1986. [DOI] [PMC free article] [PubMed] [Google Scholar]
- Swindale NV. The development of topography in visual cortex: a review of models. Network. 1996;7:161–247. doi: 10.1088/0954-898X/7/2/002. [DOI] [PubMed] [Google Scholar]
- Toyoizumi T, Miller KD. Equalization of ocular dominance columns induced by an activity-dependent learning rule and the maturation of inhibition. J Neurosci. 2009;29:6514–6525. doi: 10.1523/JNEUROSCI.0492-08.2009. [DOI] [PMC free article] [PubMed] [Google Scholar]
- Triplett JW, Owens MT, Yamada J, Lemke G, Cang J, Stryker MP, Feldheim DA. Retinal input instructs alignment of visual topographic maps. Cell. 2009;139:175–185. doi: 10.1016/j.cell.2009.08.028. [DOI] [PMC free article] [PubMed] [Google Scholar]
- Tropea D, Giacometti E, Wilson NR, Beard C, McCurry C, Fu DD, Flannery R, Jaenisch R, Sur M. Partial reversal of Rett syndrome-like symptoms in MeCP2 mutant mice. Proc Natl Acad Sci U S A. 2009;106:2029–2034. doi: 10.1073/pnas.0812394106. [DOI] [PMC free article] [PubMed] [Google Scholar]
- Tropea D, Majewska A, Garcia R, Sur M. Structural dynamics of synapses in vivo correlate with functional changes during experience-dependent plasticity in visual cortex. J Neurosci. 2010;30:11086–11095. doi: 10.1523/JNEUROSCI.1661-10.2010. [DOI] [PMC free article] [PubMed] [Google Scholar]
- Turrigiano GG, Nelson SB. Homeostatic plasticity in the developing nervous system. Nat Rev Neurosci. 2004;5:97–107. doi: 10.1038/nrn1327. [DOI] [PubMed] [Google Scholar]
- Tychsen L, Wong AM, Burkhalter A. Paucity of horizontal connections for binocular vision in V1 of naturally strabismic macaques: cytochrome oxidase compartment specificity. J Comp Neurol. 2004;474:261–275. doi: 10.1002/cne.20113. [DOI] [PubMed] [Google Scholar]
- Wang Q, Burkhalter A. Area map of mouse visual cortex. J Comp Neurol. 2007;502:339–357. doi: 10.1002/cne.21286. [DOI] [PubMed] [Google Scholar]
- Wiesel TN, Hubel DH, Lam DM. Autoradiographic demonstration of ocular-dominance columns in the monkey striate cortex by means of transneuronal transport. Brain Res. 1974;79:273–279. doi: 10.1016/0006-8993(74)90416-8. [DOI] [PubMed] [Google Scholar]
- Yu H, Farley BJ, Jin DZ, Sur M. The coordinated mapping of visual space and response features in visual cortex. Neuron. 2005;47:267–280. doi: 10.1016/j.neuron.2005.06.011. [DOI] [PubMed] [Google Scholar]