

Abstract
BACKGROUND
We examined the association between 14 endothelial system genes and salt-sensitivity of blood pressure (BP).
METHODS
After a 3-day baseline examination, during which time the usual diet was consumed, 1,906 Chinese participants received a 7-day low-sodium diet (51.3 mmol of sodium/day) followed by a 7-day high-sodium diet (307.8 mmol of sodium/day). BP measurements were obtained at baseline and at the end of each intervention using a random-zero sphygmomanometer.
RESULTS
The DDAH1 rs11161637 variant was associated with reduced BP salt sensitivity, conferring attenuated systolic BP (SBP) and mean arterial pressure (MAP) decreases from baseline to the low-sodium intervention (both P = 2×10⁻⁴). Examination of genotype–sex interactions revealed that this relation was driven by the strong associations observed in men (P for interactions = 1.10×10⁻⁴ and 0.008, respectively). When switching from the low- to high-sodium intervention, increases in diastolic BP (DBP) and MAP were attenuated by the COL18A1 rs2838944 minor A allele (P = 1.41×10⁻⁴ and 1.55×10⁻⁴, respectively). Conversely, the VWF rs2239153 C variant was associated with increased salt sensitivity, conferring larger DBP and MAP reductions during low-sodium intervention (P = 1.22×10⁻⁴ and 4.44×10⁻⁵, respectively). Ten variants from 3 independent SELE loci displayed significant genotype–sex interactions on DBP and MAP responses to low-sodium (P for interaction = 1.56×10⁻³ to 1.00×10⁻⁴). Among men, minor alleles of 4 correlated markers attenuated BP responses to low-sodium intake, whereas minor alleles of another 4 correlated markers increased BP responses. No associations were observed in women for these variants. Further, qualitative interactions were shown for 2 correlated SELE markers.
CONCLUSIONS
These data support a role for the endothelial system genes in salt sensitivity.
Keywords: blood pressure, endothelial system, genes, hypertension, salt sensitivity.
Hypertension is a major global health challenge because of its high prevalence and related risk of cardiovascular disease (CVD).1,2 As a complex trait, hypertension susceptibility is influenced by the interaction of genetic and environmental factors.3 Among environmental determinants, dietary sodium intake is one of the most important risk factors for hypertension.4,5 Clinical trials, observational epidemiologic studies, and animal experiments have long demonstrated the causal relationship between high dietary sodium intake and elevated blood pressure (BP).6–9 However, there is substantial evidence suggesting that BP responses to dietary sodium intake vary considerably among individuals and are normally distributed in populations.10 This phenomenon can be described as BP salt sensitivity.
The role of the endothelial system in BP regulation by nitric oxide (NO)–mediated vasodilation has been well described.11,12 Recently, studies have also shown that endothelial cells modify their function in response to changes in extracellular concentrations of sodium, with increased sodium related to decreased endothelial NO release and increased endothelial cell stiffness.11,12 Although these data implicate the endothelial system in the pathogenesis of salt-sensitive hypertension, few studies have examined the relationship between endothelial system genes and BP response to dietary sodium intake.13–16
This study aimed to comprehensively examine the association between common genetic variants from 14 endothelial system candidate genes (Table 1) and systolic BP (SBP), diastolic BP (DBP), and mean arterial pressure (MAP) responses to a dietary sodium intervention among 1,906 participants of the Genetic Epidemiology Network of Salt Sensitivity (GenSalt) feeding study.
Table 1.
Genes involved in the endothelial system
| Gene symbol | Gene name | Chr | Physical position ± 5,000 bp | SNPs | Functiona |
|---|---|---|---|---|---|
| EDN2 | Endothelin 2 | 1 | (41944446, 41950344) | 1 | Induces vasoconstriction, principally through EDNRA stimulation2 |
| DDAH1 | Dimethylarginine dimethylamino‑ hydrolase 1 | 1 | (85784168, 86044046) | 90 | Participates in NO generation by regulating cellular concentrations of methylarginines, which in turn inhibit NO synthase activity3 |
| VCAM1 | Vascular cell adhesion molecule 1 | 1 | (101185196, 101204601) | 5 | Involved in leukocyte–endothelial cell adhesion and signal transduction1 |
| SELE | Selectin E | 1 | (169691781, 169703220) | 21 | Mediates adhesion and transmigration of leukocytes to vascular endothelium4 |
| EDNRA | Endothelin receptor type A | 4 | (148402069, 148466106) | 25 | Participates in stimulation of cytokine release and endothelial growth factors5 |
| MEF2C | Myocyte enhancer factor 2C | 5 | (88014058, 88199922) | 31 | Contributes to vascular endothelial growth factor expression in endothelial cells 6 |
| EDN1 | Endothelin 1 | 6 | (12290529, 12297427) | 13 | Acts through its receptor stimulation, endothelin receptor type A (EDNRA) and endothelin receptor type B (EDNRB)7 |
| SERPINE 1 | Serpin peptidase inhibitor, clade E | 7 | (100770379, 100782547) | 2 | Contributes to cardiac ventricular remodeling by migration of inflammatory cells and attenuation of extracellular matrix degradation8 |
| NOS3 | Nitric oxide synthase 3, endothelial cell | 7 | (150688144, 150711687) | 8 | Mediates the conversion of L-arginine in NO9 |
| VWF | von Willebrand factor | 12 | (6058040, 6233836,) | 64 | Marker of endothelial damage10 |
| EDNRB | Endothelin receptor type B | 13 | (78469616, 78493903) | 10 | Participates in the control of vascular tone by stimulation of vascular smooth muscle cell receptors11 |
| CYBA | Cytochrome b-245, alpha polypeptide | 16 | (88709697, 88717457) | 1 | Participates in the activation and stabilization of NADPH–oxidase12 |
| TGFB1 | Transforming growth factor, beta 1 | 19 | (41836812, 41859831) | 1 | Regulates proliferation, differentiation, adhesion, migration, and other functions of the endothelial cell13 |
| COL18A1 | Collagen, type XVIII, alpha 1 | 21 | (46825097, 46933634) | 20 | COL18A1 deficiency is associated with vascular endothelial cell damage and its degradation results in the generation of endostatin, a potent vasodilator14 |
Abbreviations: Chr, chromosome; NO, nitric oxide; SNPs, single nucleotide polymorphisms.
a References for gene function correspond with those found in the Supplementary References.
METHODS
Study population
The GenSalt study was conducted in a Han Chinese population from rural north China where habitual salt intake is high. A community-based BP screening was conducted among adults aged 18–60 years in the study villages to identify potential probands and their families. Those with mean SBP ≥ 130mm Hg and/or DBP ≥ 85mm Hg and no use of antihypertension medications and their spouses, siblings, and offspring were recruited as volunteers for the dietary intervention study. Detailed eligibility criteria for the probands and siblings/spouses/offspring have been presented elsewhere.6 Briefly, individuals with stage 2 hypertension, current or recent use of antihypertension medications, secondary hypertension, history of clinical CVD, diabetes, chronic kidney failure, and liver disease or peptic ulcer disease requiring treatment during the previous 2 years, along with pregnant women, heavy alcohol drinkers, and those currently adhering to a low-sodium diet or unable to sign the informed consent form, were excluded from the study. Among the 1,906 eligible participants from 633 families, 1,871 (98.2%) and 1,860 (97.6%) completed the low-sodium and high-sodium dietary interventions, respectively, and were included in the current analysis.
Dietary intervention
After a 3-day baseline examination, during which time the usual diet was consumed, study participants received a 7-day low-sodium diet (3g of salt or 51.3 mmol of sodium/day) followed by a 7-day high-sodium diet (18g of salt or 307.8 mmol of sodium/day). During both intervention phases, potassium intake remained unchanged. Total energy intake was varied according to each participant’s baseline energy intake. All study foods were cooked without salt, and pre-packaged salt was added to the individual study participant’s meal when it was served by the study staff. To ensure study participants’ compliance with the intervention program, they were required to have their breakfast, lunch, and dinner at the study kitchen under supervision of the study staff during the entire study period. Three timed urinary specimens were collected at baseline and at the end of each intervention phase (days 5, 6, and 7) to monitor each participants’ compliance with the dietary sodium intervention. The mean of 24-hour urinary excretions of sodium and potassium were 242.4 (SD = 66.7) mmol and 36.9 (SD = 9.6) mmol at baseline, 47.5 (SD = 16.0) mmol and 31.4 (SD = 7.7) mmol during the low-sodium intervention, and 244.3 (SD = 37.7) mmol and 35.7 (SD = 7.5) mmol during the high-sodium intervention, respectively.
Phenotype measurements
A standard questionnaire was administered by trained staff at the baseline examination to collect information on family structure, demographic characteristics, personal and family medical history, and lifestyle risk factors. Three morning BP measurements were obtained according to a standard protocol during each of the 3 days of baseline observation and on days 5, 6, and 7 of each intervention period. All BP readings were measured by trained and certified observers using a random zero sphygmomanometer.17 BP was measured with the participant in the sitting position after 5 minutes of rest. In addition, participants were advised to avoid alcohol, cigarette smoking, coffee/tea, and exercise for at least 30 minutes before their BP measurements. All BP observers were blinded to the participant’s dietary intervention. Body weight and height were measured twice in light indoor clothing without shoes during the baseline examination. Body mass index was calculated as kilograms per meters squared.
Salt-sensitivity phenotypes were defined continuously as the absolute changes in SBP, DBP, and MAP when switching from baseline to low-sodium intervention and from low-sodium to high-sodium intervention. Mean BP responses to low-sodium intake were calculated as the mean of 9 measurements on days 5, 6, and 7 during the low-sodium intervention minus the mean of 9 measurements at baseline, and responses to high-sodium intake were calculated as the mean of 9 measurements on days 5, 6, and 7 during the high-sodium intervention minus the mean of 9 measurements on days 5, 6, and 7 during the low-sodium intervention.
Candidate gene selection and single nucleotide polymorphism genotyping
We conducted a Medline literature search using Medical Subject Heading term “endothelium” or keywords “endothelial” or “endothelium” and Medical Subject Heading terms “genes” or “polymorphism, single nucleotide.” Fourteen candidate genes in the endothelial system were identified by the literature search strategy, including VCAM1, EDN2, DDAH1, SELE, EDNRA, MEF2C, EDN1, SERPINE 1, NOS3, VWF, EDNRB, CYBA, TGFB1, and COL18A1 (see Table 1). References of articles used to identify genes can be found in the Supplementary Materials. Genetic data, genotyped as part of the Affymetrix platform (Affymetrix 6.0, Santa Clara, CA) and using SNPlex assays (Applied Biosystems, Carlsbad, CA) based on oligonucleotide ligation assay for capillary electrophoresis on an automated DNA sequencer (ABI 3700 DNA Analyzer), were available for 368 single nucleotide polymorphisms (SNPs) from the 14 candidate genes and their 5,000 base-pair flanking regions. After standard quality control procedures, 75 SNPs with an minor allele frequency (MAF) < 1% and 1 SNP with a genotyping call rate < 85% were excluded, leaving a total of 292 SNPs for the analysis. Supplementary Table S1 provides descriptive information and quality control parameters for these SNPs.
Statistical analysis
The percent or means of baseline and intervention variables were calculated for the 1,906 GenSalt feeding study participants. Additive associations between single SNPs and BP responses to each dietary sodium intervention were assessed using a mixed linear regression model to account for the nonindependence of family members. Age, sex, body mass index, room temperature during blood pressure measurement, and study site were adjusted in multivariable analyses. To adjust for multiple comparisons, the false discovery rate Q value was calculated for all SNPs.18 Statistical significance was determined by Q < 0.05. For significant SNPs, the mean effect size and 95% confidence interval (CI) was estimated according to genotype. Because of the known role of estrogen in the activation of endothelial system components and observed sex differences in salt sensitivity,10,19 we examined genotype–sex interactions in an additional analysis. For those interactions that were significant after adjustment for multiple testing, we estimated the mean effect size and 95% CI according to sex and genotype. SAS statistical software version 9.2 was used for the analysis (SAS Institute, Cary, NC). We used Haploview software version 4.2 (http://www.broadinstitute.org/haploview) to estimate linkage disequilibrium, defined by the pairwise r 2 value, between SNPs.20
RESULTS
Characteristics of 1,906 GenSalt intervention participants are shown in Table 2. SBP, DBP, and MAP changed significantly in response to the dietary sodium interventions, with mean decreases of 6mm Hg, 3mm Hg, and 4mm Hg, respectively, in response to low-sodium intake and increases of 5mm Hg, 2mm Hg, and 3mm Hg in response to high-sodium intake.
Table 2.
Characteristics of 1,906 GenSalt dietary intervention participants
| Variable | Mean ± SD or percentage | Median (interquartile range) |
|---|---|---|
| Age, years | 38.7±9.6 | 39.0 (33.0–46.0) |
| Men, % | 53.0 | |
| BMI, kg/m2 | 23.3±3.2 | 22.9 (21.1–25.2) |
| SBP, mm Hg | ||
| Baseline | 116.9±14.2 | 115.8 (106.4–127.1) |
| Response to low-sodium intake | −5.5±7.0* | −4.4 (−8.9 to −1.3) |
| Response to high-sodium intake | 4.9±6.0* | 4.7 (0.6–8.2) |
| DBP, mm Hg | ||
| Baseline | 73.7±10.3 | 73.3 (66.7–80.7) |
| Response to low-sodium intake | −2.8±5.5* | −2.7 (−5.6 to 0.4) |
| Response to high-sodium intake | 1.9±5.4* | 1.8 (−1.6 to 5.3) |
| MAP, mm Hg | ||
| Baseline | 88.1±10.9 | 87.7 (80.0–95.4) |
| Response to low-sodium intake | −3.7±5.3* | −3.3 (−6.6 to −0.6) |
| Response to high-sodium intake | 2.9±5.0* | 2.7 (−0.4 to 5.9) |
Abbreviations: BMI, body mass index; DBP, diastolic blood pressure; MAP, mean arterial pressure; SBP, systolic blood pressure.
*P < 0.0001 when compared with no blood pressure change during sodium interventions.
Figure 1 presents the association between each SNP and absolute SBP, DBP, and MAP responses to the low- (Figure 1a) and high-sodium (Figure 1b) interventions. After adjustment for multiple testing, DDAH1 marker rs11161637 (MAF = 26%) was associated with SBP (P = 2.00×10⁻⁴; Q = 0.05) and MAP (P value = 1.83×10⁻⁴; Q = 0.02) responses to low-sodium intake. This marker explained 2.1% of the variation in each of these traits. VWF marker rs2239153 (MAF = 39%) was associated with DBP (P = 1.22×10⁻⁴; Q = 0.03) and MAP (P = 4.44×10⁻⁵; Q = 0.01) responses to low-sodium intake, explaining 1.1% and 0.9% of the variation in these traits, respectively. COL18A1 SNP rs2838944 (MAF = 7%) was associated with SBP (P value = 1.41×10⁻⁴; Q = 0.04) and MAP (P = 1.55×10⁻⁴; Q = 0.04) responses to high-sodium intake, explaining 0.6% and 0.5% of their respective variances.
Figure 1.
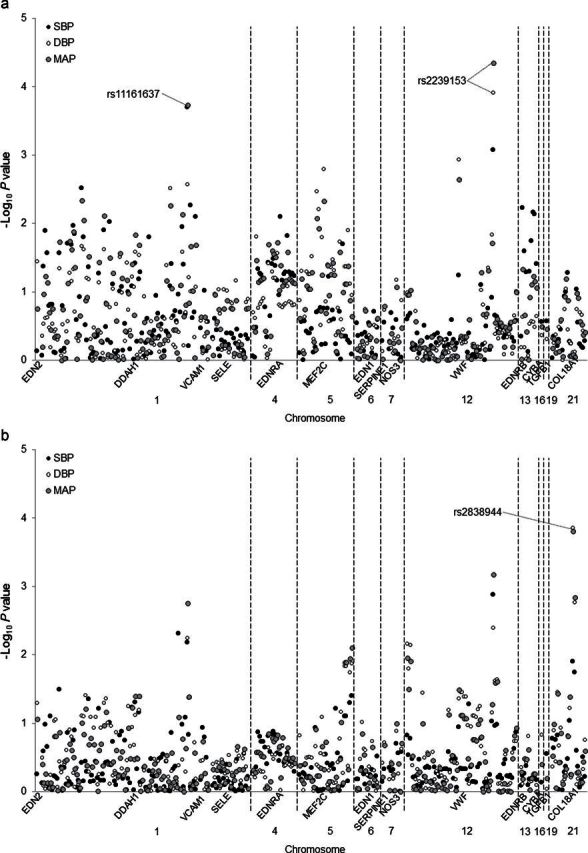
Log P values for the association between 292 single nucleotide polymorphisms in 14 candidate genes and systolic blood pressure (SBP), diastolic blood pressure (DBP), and mean arterial pressure (MAP) responses to low- (a) and high-sodium (b) interventions. Labeled single nucleotide polymporphisms had Q < 0.05. SNPs.
Mean BP responses and 95% CIs to the dietary sodium interventions according to DDAH1 rs11161637, VWF rs2239153 and COL18A1 rs2838944 genotypes are shown in Table 3. The magnitude of SBP and MAP responses to low-sodium intervention decreased significantly with the number of G alleles of DDAH1 marker rs11161637. Although not significant after adjustment for multiple testing, similar trends were observed for DBP response to low-sodium intake (P = 0.002) and SBP, DBP, and MAP responses to high-sodium intake (P = 0.006, 0.005, and 0.001, respectively). In addition, DBP and MAP responses to low-sodium intake increased in magnitude with each copy of the VWF rs2239153 C allele. Although findings did not achieve statistical significance after correction for multiple testing, similar trends were observed for the association of rs2239153 with the other BP phenotypes (P = 9×10⁻⁴ for SBP response to low-sodium intervention; and P = 0.001, 0.004, and 7×10⁻⁴, respectively, for SBP, DBP, and MAP responses to the high-sodium intervention). Finally, DBP and MAP responses to high-sodium intake decreased with each copy of the COL18A1 rs2838944 A allele. A similar but nonsignificant trend was observed for SBP response to high-sodium intake (P = 0.01).
Table 3.
Blood pressure responses to dietary sodium interventions according to DDAH1, VWF, and COL18A1 genotypes
| HGNC symbol | Genotype | No. | Response to low-sodium intervention (95% CI) | P | Q | Response to high-sodium intervention (95% CI) | P | Q | |
|---|---|---|---|---|---|---|---|---|---|
| Systolic blood pressure | |||||||||
| DDAH1 | rs11161637 | A/A | 1021 | −6.20 (−6.70 to −5.70) | 0.0002 | 0.05 | 4.98 (4.56–5.40) | 0.006 | 0.66 |
| A/G | 732 | −5.38 (−5.87 to −4.88) | 4.04 (3.60–4.48) | ||||||
| G/G | 128 | −4.02 (−5.33 to −2.70) | 4.38 (3.29–5.47) | ||||||
| VWF | rs2239153 | T/T | 681 | −5.12 (−5.65 to −4.60) | 0.0009 | 0.13 | 4.15 (3.68–4.62) | 0.001 | 0.39 |
| T/C | 821 | −6.06 (−6.61 to −5.52) | 4.62 (4.19–5.05) | ||||||
| C/C | 275 | −6.54 (−7.40 to −5.68) | 5.57 (4.82–6.32) | ||||||
| COL18A1 | rs2838944 | G/G | 1605 | −5.73 (−6.14 to −5.33) | 0.90 | 0.94 | 4.69 (4.35–5.02) | 0.01 | 0.94 |
| G/A | 263 | −5.69 (−6.55 to −4.83) | 3.89 (3.19–4.60) | ||||||
| A/A | 9 | −7.21 (−13.36 to −1.05) | 2.00 (−0.50–4.49) | ||||||
| Diastolic blood pressure | |||||||||
| DDAH1 | rs11161637 | A/A | 1021 | −3.01 (−3.43 to −2.60) | 0.002 | 0.16 | 1.97 (1.61–2.32) | 0.005 | 0.27 |
| A/G | 732 | −2.46 (−2.87 to −2.05) | 1.28 (0.88–1.69) | ||||||
| G/G | 128 | −1.66 (−2.64 to −0.68) | 1.17 (0.21–2.13) | ||||||
| VWF | rs2239153 | T/T | 681 | −2.13 (−2.55 to −1.72) | 0.0001 | 0.03 | 1.32 (0.89–1.74) | 0.004 | 0.24 |
| T/C | 821 | −3.09 (−3.54 to −2.64) | 1.82 (1.43–2.20) | ||||||
| C/C | 275 | −3.38 (−4.08 to −2.67) | 2.34 (1.71–2.96) | ||||||
| COL18A1 | rs2838944 | G/G | 1605 | −2.70 (−3.05 to −2.36) | 0.78 | 0.89 | 1.83 (1.52–2.14) | 0.0001 | 0.04 |
| G/A | 263 | −2.70 (−3.39 to −2.02) | 0.65 (0.00 –1.29) | ||||||
| A/A | 9 | −4.16 (−7.30 to −1.02) | −1.03 (−3.45 to 1.38) | ||||||
| Mean arterial pressure | |||||||||
| DDAH1 | rs11161637 | A/A | 1021 | −4.08 (−4.47 to −3.69) | 0.0002 | 0.02 | 2.97 (2.63 to 3.31) | 0.001 | 0.13 |
| A/G | 732 | −3.43 (−3.83 to −3.04) | 2.20 (1.83–2.57) | ||||||
| G/G | 128 | −2.45 (−3.42 to −1.48) | 2.24 (1.35–3.12) | ||||||
| VWF | rs2239153 | T/T | 681 | −3.13 (−3.54 to −2.73) | 4.4×10⁻⁵ | 0.01 | 2.26 (1.87–2.66) | 0.0007 | 0.09 |
| T/C | 821 | −4.08 (−4.51 to −3.65) | 2.75 (2.40–3.10) | ||||||
| C/C | 275 | −4.43 (−5.11 to −3.76) | 3.41 (2.83–4.00) | ||||||
| COL18A1 | rs2838944 | G/G | 1605 | −3.72 (−4.04 to −3.40) | 0.82 | 0.97 | 2.78 (2.50–3.07) | 0.0002 | 0.04 |
| G/A | 263 | −3.70 (−4.37 to −3.03) | 1.72 (1.13–2.31) | ||||||
| A/A | 9 | −5.16 (−9.12 to −1.20) | −0.04 (−1.81 to 1.72) | ||||||
Abbreviations: CI, confidence interval; COL18A1, collagen, type XVIII, alpha 1; DDAH1, dimethylarginine dimethylaminohydrolase 1; HGNC, Human Genome Nomenclature Committee; VWF, von Willebrand factor.
Figure 2 presents the P values for the tests of genotype–sex interactions on SBP, DBP, and MAP responses to the low- (Figure 2a) and high-sodium (Figure 2b) interventions. After adjustment for multiple testing, an interaction between DDAH1 marker rs11161637 and sex was identified for SBP responses to low-sodium intake (P = 2×10⁻⁴; Q = 0.05). Examination of BP responses according to genotype and sex showed that the strong association in men (P = 1.63×10⁻⁷; Q = 4.85×10⁻⁵) was likely driving the association observed in the overall analysis (Table 4). In addition, 3 independent loci (r 2 < 0.80), which included 10 genetic variants, within the SELE gene displayed significant interactions with sex on DBP and MAP responses to low-sodium intervention (P = 1.00×10⁻³ to 1.00×10⁻⁴). Among men, the minor alleles of highly correlated SELE markers rs5356, rs3917430, rs3917428, rs5368 (MAFs = 0.27–0.32) were associated with attenuated BP responses to the low-sodium intervention, with no associations observed in women. In contrast, the minor alleles of correlated markers rs3917436, rs3917423, rs3917406, and rs932307 were associated with increased BP responses to the low-sodium intervention among men (MAFs = 0.43–0.49), with no association among women. Finally, among correlated markers rs1534904 and rs3917412 (MAF = 0.26 and 0.28, respectively), DBP and MAP responses to low-sodium intake tended to increase in men and decrease in women with each copy of the minor allele (Table 4).
Figure 2.
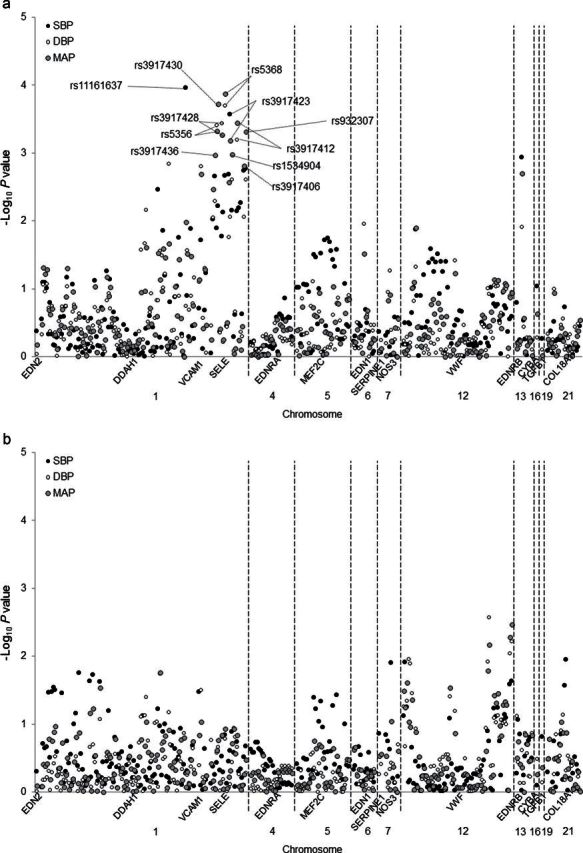
Log P values for the genotype–sex interactions of 292 single nucleotide polymorphisms in 14 candidate genes and systolic blood pressure (SBP), diastolic blood pressure (DBP), and mean arterial pressure (MAP) responses to low- (a) and high-sodium (b) interventions. Labeled SNPs had Q < 0.05.
Table 4.
Blood pressure responses to the dietary sodium interventions according to sex and genotypes
| Gene | Genotype | Blood pressure response to low−sodium intervention | Blood pressure response to high−sodium intervention | |||||||||
|---|---|---|---|---|---|---|---|---|---|---|---|---|
| Men | Women | Men | Women | Interaction P a | ||||||||
| Absolute change, mm Hg (95% CI) | P | Absolute change, mm Hg (95% CI) | P | Interaction P a | Absolute change, mm Hg (95% CI) | P | Absolute change, mm Hg (95% CI) | P | ||||
| Systolic blood pressure | ||||||||||||
| DDAH1 | rs11161637 | AA | −6.32 (−6.96 to −5.68) | 1.72×10⁻⁷ | −5.77 (−6.53 to −5.01) | 0.97 | 0.0001b | 4.75 (4.22–5.27) | 0.02 | 5.17 (4.52–5.83) | 0.19 | 0.54 |
| AG | −4.78 (−5.40 to −4.17) | −5.79 (−6.61 to −4.98) | 3.74 (3.14–4.34) | 4.42 (3.77–5.07) | ||||||||
| GG | −2.28 (−3.78 to −0.79) | −5.79 (−7.88 to −3.70) | 3.91 (2.62–5.21) | 4.93 (3.36–6.51) | ||||||||
| SELE | rs3917436 | GG | −4.70 (−5.47 to −3.93) | 0.004 | −6.03 (−6.97 to −5.08) | 0.13 | 0.002 | 3.98 (3.34–4.62) | 0.64 | 4.90 (4.13–5.67) | 0.71 | 0.57 |
| GA | −5.57 (−6.19 to −4.95) | −5.94 (−6.72 to −5.15) | 4.65 (4.11–5.18) | 4.92 (4.29–5.54) | ||||||||
| AA | −6.59 (−7.62 to −5.57) | −4.89 (−5.97 to −3.80) | 4.04 (3.22–4.86) | 4.64 (3.70–5.58) | ||||||||
| rs5356 | TT | −5.84 (−6.48 to −5.20) | 0.06 | −5.43 (−6.21 to −4.65) | 0.23 | 0.01 | 4.36 (3.87–4.87) | 0.35 | 4.90 (4.26–5.53) | 0.87 | 0.38 | |
| TC | −5.11 (−5.75 to −4.47) | −6.28 (−7.13 to −5.44) | 4.43 (3.84–5.02) | 4.73 (4.07–5.39) | ||||||||
| CC | −4.68 (−6.28 to −3.08) | −5.57 (−7.44 to −3.69) | 3.11 (1.59–4.64) | 5.45 (3.90–7.00) | ||||||||
| rs3917430 | CC | −5.92 (−6.59 to −5.24) | 0.06 | −5.18 (−5.97 to −4.39) | 0.08 | 0.006 | 4.42 (3.90–4.95) | 0.33 | 4.84 (4.20–5.48) | 0.64 | 0.78 | |
| CG | −5.15 (−5.77 to −4.53) | −6.46 (−7.29 to −5.64) | 4.36 (3.81–4.90) | 4.76 (4.12–5.40) | ||||||||
| GG | −4.73 (−6.31 to −3.16) | −5.65 (−7.24 to −4.05) | 3.60 (2.27–4.93) | 5.41 (3.91–6.92) | ||||||||
| rs3917428 | GG | −5.80 (−6.44 to −5.16) | 0.07 | −5.40 (−6.17 to −4.63) | 0.26 | 0.78 | 4.36 (3.87–4.86) | 0.32 | 4.84 (4.22–5.46) | 0.79 | 0.30 | |
| GA | −5.22 (−5.86 to −4.57) | −6.37 (−7.23 to −5.23) | 4.46 (3.86–5.06) | 4.83 (4.16–5.50) | ||||||||
| AA | −4.38 (−6.03 to −2.73) | −5.21 (−7.09 to −3.33) | 2.98 (1.47–4.49) | 5.20 (3.56–6.83) | ||||||||
| rs5368 | CC | −5.93 (−6.58 to −5.27) | 0.01 | −5.36 (−6.16 to −4.56) | 0.11 | 0.59 | 4.44 (3.92–4.97) | 0.14 | 4.85 (4.19–5.51) | 0.65 | 0.14 | |
| CT | −5.18 (−5.87 to −4.49) | −6.40 (−7.33 to −5.48) | 4.30 (3.67–4.93) | 4.74 (4.00–5.49) | ||||||||
| TT | −3.59 (−5.38 to −1.80) | −5.81 (−7.96 to −3.66) | 2.72 (0.99–4.45) | 5.81 (3.92–7.70) | ||||||||
| rs3917423 | CC | −4.72 (−5.56 to −3.88) | 0.002 | −6.10 (−7.11 to −5.08) | 0.05 | 0.0003b | 3.87 (3.15–4.59) | 0.45 | 5.09 (4.27–5.92) | 0.33 | 0.25 | |
| CT | −5.29 (−5.91 to −4.67) | −6.09 (−6.85 to −5.33) | 4.58 (4.06–5.11) | 4.90 (4.28–5.53) | ||||||||
| TT | −6.64 (−7.49 to −5.78) | −4.81 (−5.78 to −3.85) | 4.24 (3.51–4.97) | 4.54 (3.73–5.35) | ||||||||
| rs1534904 | GG | −5.00 (−5.60 to −4.41) | 0.02 | −5.86 (−6.64 to −5.09) | 0.22 | 0.007 | 4.04 (3.52–4.56) | 0.25 | 4.93 (4.29–5.66) | 0.34 | 0.13 | |
| GT | −5.85 (−6.53 to −5.17) | −5.96 (−6.79 to −5.12) | 4.69 (4.10–5.29) | 4.91 (4.25–5.57) | ||||||||
| TT | −6.53 (−8.13 to −4.93) | −4.16 (−5.65 to −2.68) | 4.18 (3.10–5.25) | 3.91 (2.55–5.27) | ||||||||
| rs3917412 | GG | −5.14 (−5.74 to −4.54) | 0.04 | −5.93 (−6.69 to −5.18) | 0.13 | 0.78 | 4.11 (3.60–4.61) | 0.27 | 4.90 (4.28–5.52) | 0.44 | 0.18 | |
| GA | −5.70 (−6.36 to −5.04) | −5.86 (−6.70 to −5.02) | 4.60 (4.00–5.20) | 4.95 (4.28–5.62) | ||||||||
| AA | −6.96 (−8.76 to −5.16) | −3.97 (−5.46 to −2.48) | 4.42 (3.18–5.65) | 3.81 (2.26–5.37) | ||||||||
| rs3917406 | CC | −4.69 (−5.54 to −3.83) | 0.01 | −5.85 (−6.89 to −4.81) | 0.07 | 0.002 | 3.72 (2.97–4.46) | 0.37 | 5.03 (4.15–5.90) | 0.56 | 0.30 | |
| CT | −5.50 (−6.14 to −4.85) | −6.00 (−6.79 to −5.21) | 4.52 (3.95–5.09) | 4.95 (4.27–5.64) | ||||||||
| TT | −6.47 (−7.49 to −5.44) | −4.52 (−5.52 to −3.53) | 4.12 (3.33–4.92) | 4.65 (3.75–5.56) | ||||||||
| rs932307 | AA | −4.71 (−5.54 to −3.88) | 0.005 | −5.96 (−7.00 to −4.92) | 0.08 | 0.002 | 3.58 (2.89–4.26) | 0.14 | 4.88 (4.05–5.71) | 0.58 | 0.22 | |
| AG | −5.63 (−6.29 to −4.96) | −6.15 (−6.96 to −5.34) | 4.69 (4.14–5.24) | 4.89 (4.25–5.54) | ||||||||
| GG | −6.52 (−7.48 to −5.57) | −4.72 (−5.76 to −3.69) | 4.24 (3.42–5.06) | 4.54 (3.68–5.41) | ||||||||
| Diastolic blood pressure | ||||||||||||
| DDAH1 | rs11161637 | AA | −2.76 (−3.13 to −2.20) | 0.002 | −3.02 (−3.60 to −2.44) | 0.27 | 0.18 | 1.44 (0.97–1.90) | 0.09 | 2.56 (2.01–3.11) | 0.01 | 0.54 |
| AG | −1.94 (−2.49 to −1.38) | −2.74 (−3.38 to −2.09) | 0.91 (0.32–1.49) | 1.69 (1.07–2.31) | ||||||||
| GG | −0.86 (−2.05 to 0.34) | −2.26 (−3.87 to −0.64) | 0.68 (−0.51 to 1.86) | 1.54 (0.10–2.99) | ||||||||
| SELE | rs3917436 | GG | −1.83 (−2.47 to −1.20) | 0.007 | −3.25 (−3.94 to −2.55) | 0.23 | 0.005 | 1.30 (0.72–1.89) | 0.52 | 2.35 (1.68–3.01) | 0.81 | 0.88 |
| GA | −2.30 (−2.82 to −1.78) | −2.61 (−3.23 to −1.99) | 1.20 (0.71–1.68) | 1.95 (1.37–2.54) | ||||||||
| AA | −3.35 (−4.22 to −2.48) | −2.76 (−3.62 to −1.90) | 0.98 (0.16–1.79) | 2.33 (1.47–3.19) | ||||||||
| rs5356 | TT | −2.90 (−3.44 to −2.35) | 0.0002 | −2.65 (−3.26 to −2.03) | 0.24 | 0.0004b | 1.35 (0.88–1.83) | 0.11 | 2.17 (1.57–2.76) | 0.98 | 0.26 | |
| TC | −1.90 (−2.47 to −1.33) | −3.10 (−3.75 to −2.45) | 1.16 (0.59–1.73) | 2.12 (1.52–2.72) | ||||||||
| CC | −0.58 (−1.89 to 0.74) | −3.07 (−4.47 to −1.67) | 0.10 (−1.04 to 1.25) | 2.23 (0.97–3.50) | ||||||||
| rs3917430 | CC | −2.96 (−3.54 to −2.39) | 0.0005 | −2.56 (−3.19 to −1.94) | 0.08 | 0.0002b | 1.35 (0.84–1.86) | 0.28 | 2.15 (1.54–2.75) | 0.62 | 0.96 | |
| CG | −1.95 (−2.50 to −1.39) | −3.04 (−3.68 to −2.40) | 1.11 (0.56–1.65) | 2.02 (1.44–2.60) | ||||||||
| GG | −1.08 (−2.17 to 0.02) | −3.49 (−4.69 to −2.28) | 0.79 (−0.15 to 1.73) | 2.76 (1.49–4.03) | ||||||||
| rs3917428 | GG | −2.89 (−3.43 to −2.35) | 0.0002 | −2.62 (−3.22 to −2.01) | 0.22 | 0.0004b | 1.37 (0.89–1.85) | 0.09 | 2.10 (1.52–2.67) | 0.80 | 0.15 | |
| GA | −1.92 (−2.49 to −1.35) | −3.18 (−3.83 to −2.52) | 1.14 (0.57–1.71) | 2.22 (1.60–2.83) | ||||||||
| AA | −0.57 (−1.87 to 0.73) | −2.87 (−4.22 to −1.52) | 0.09 (−1.03 to 1.21) | 2.15 (0.90–3.40) | ||||||||
| rs5368 | CC | −3.03 (−3.57 to −2.49) | 0.0003 | −2.73 (−3.35 to −2.11) | 0.12 | 0.18 | 1.37 (0.85–1.90) | 0.21 | 2.21 (1.60–2.82) | 0.68 | 0.17 | |
| CT | −2.10 (−2.72 to −1.48) | −3.36 (−4.06 to −2.67) | 1.26 (0.67–1.85) | 2.25 (1.58–2.92) | ||||||||
| TT | −0.21 (−1.74 to 1.31) | −3.39 (−5.04 to −1.73) | 0.14 (−1.12 to 1.39) | 2.68 (1.18–4.18) | ||||||||
| rs3917423 | CC | −1.73 (−2.42 to −1.04) | 0.004 | −3.02 (−3.75 to −2.28) | 0.52 | 0.009 | 1.08 (0.46–1.69) | 0.97 | 2.36 (1.64–3.07) | 0.70 | 0.77 | |
| CT | −2.20 (−2.74 to −1.67) | −2.85 (−3.45 to −2.24) | 1.29 (0.80–1.79) | 2.04 (1.45–2.62) | ||||||||
| TT | −3.21 (−3.97 to −2.46) | −2.71 (−3.51 to −1.91) | 1.08 (0.38–1.78) | 2.17 (1.41–2.93) | ||||||||
| rs1534904 | GG | −1.97 (−2.48 to −1.45) | 0.05 | −3.15 (−3.72 to −2.57) | 0.02 | 0.002 | 1.05 (0.59–1.51) | 0.74 | 2.29 (1.72–2.86) | 0.43 | 0.56 | |
| GT | −2.72 (−3.30 to −2.15) | −2.67 (−3.34 to −2.01) | 1.44 (0.90–1.98) | 1.97 (1.34–2.61) | ||||||||
| TT | −2.59 (−3.66 to −1..52) | −1.92 (−3.00 to −0.84) | 0.77 (−0.43 to 1.96) | 2.05 (0.83–3.27) | ||||||||
| rs3917412 | GG | −2.01 (−2.51 to −1.51) | 0.06 | −3.26 (−3.82 to −2.70) | 0.003 | 0.0006b | 1.13 (0.67–1.59) | 0.80 | 2.37 (1.82–2.92) | 0.17 | 0.22 | |
| GA | −2.71 (−3.30 to −2.11) | −2.51 (−3.19 to −1.83) | 1.28 (0.73–1.84) | 1.90 (1.25–2.54) | ||||||||
| AA | −2.69 (−3.90 to −1.47) | −1.69 (−2.85 to −0.52) | 1.09 (−0.17 to 2.36) | 1.78 (0.38–3.18) | ||||||||
| rs3917406 | CC | −1.95 (−2.64 to −1.25) | 0.007 | −3.27 (−4.07 to −2.46) | 0.39 | 0.009 | 1.28 (0.64–1.92) | 0.66 | 2.60 (1.81–3.39) | 0.64 | 0.79 | |
| CT | −2.05 (−2.61 to −1.48) | −2.88 (−3.54 to −2.22) | 1.16 (0.64–1.68) | 2.12 (1.49–2.75) | ||||||||
| TT | −3.53 (−4.41 to −2.65) | −2.82 (−3.68 to −1.96) | 1.06 (0.27–1.86) | 2.38 (1.54–3.21) | ||||||||
| rs932307 | AA | −1.63 (−2.31 to −0.95) | 0.002 | −3.12 (−3.91 to −2.34) | 0.34 | 0.003 | 0.91 (0.31–1.52) | 0.58 | 2.33 (1.57–3.08) | 0.68 | 0.53 | |
| AG | −2.34 (−2.90 to −1.77) | −2.64 (−3.27 to −2.00) | 1.26 (0.76–1.76) | 1.99 (1.40–2.58) | ||||||||
| GG | −3.38 (−4.22 to −2.53) | −2.66 (−3.49 to −1.82) | 1.14 (0.35–1.93) | 2.13 (1.34–2.92) | ||||||||
| Mean arterial pressure | ||||||||||||
| DDAH1 | rs11161637 | AA | −3.95 (−4.47 to −3.44) | 1.19×10⁻⁵ | −3.94 (−4.49 to −3.38) | 0.47 | 0.008 | 2.54 (2.12–2.97) | 0.03 | 3.43 (2.90–3.97) | 0.02 | 0.84 |
| AG | −2.89 (−3.40 to −2.38) | −3.76 (−4.38 to −3.15) | 1.85 (1.33–2.37) | 2.60 (2.04–3.16) | ||||||||
| GG | −1.33 (−2.53 to −0.13) | −3.45 (−5.00 to −1.89) | 1.74 (0.64–2.84) | 2.68 (1.44–3.93) | ||||||||
| SELE | rs3917436 | GG | −2.79 (−3.40 to −2.17) | 0.002 | −4.18 (−4.85 to −3.50) | 0.13 | 0.001b | 2.20 (1.66–2.73) | 0.79 | 3.20 (2.57–3.84) | 0.74 | 0.89 |
| GA | −3.39 (−3.88 to −2.91) | −3.72 (−4.32 to −3.13) | 2.35 (1.91–2.79) | 2.94 (2.40–3.47) | ||||||||
| AA | −4.44 (−5.26 to −3.61) | −3.47 (−4.30 to −2.64) | 2.00 (1.28–2.72) | 3.10 (2.31–3.88) | ||||||||
| rs5356 | TT | −3.88 (−4.39 to −3.37) | 0.0009 | −3.58 (−4.18 to −2.98) | 0.18 | 0.0005b | 2.35 (1.93–2.78) | 0.14 | 3.08 (2.52–3.63) | 0.98 | 0.48 | |
| TC | −2.97 (−3.50 to −2.45) | −4.17 (−4.78 to −3.56) | 2.25 (1.74–2.77) | 2.99 (2.44–3.53) | ||||||||
| CC | −1.96 (−3.23 to −0.68) | −3.90 (−5.32 to −2.48) | 1.12 (−0.04 to 2.27) | 3.29 (2.09–4.50) | ||||||||
| rs3917430 | CC | −3.95 (−4.50 to −3.40) | 0.002 | −3.44 (−4.04 to −2.83) | 0.05 | 0.0002b | 2.37 (1.92–2.82) | 0.25 | 3.05 (2.49–3.61) | 0.61 | 0.88 | |
| CG | −3.02 (−3.52 to −2.51) | −4.18 (−4.79 to −3.58) | 2.19 (1.71–2.68) | 2.92 (2.39–3.46) | ||||||||
| GG | −2.30 (−3.45 to −1.15) | −4.20 (−5.39 to −3.00) | 1.72 (0.76–2.68) | 3.63 (2.40–4.87) | ||||||||
| rs3917428 | GG | −3.86 (−4.37 to −3.35) | 0.001 | −3.55 (−4.14 to −2.96) | 0.18 | 0.0005b | 2.37 (1.94–2.79) | 0.11 | 3.01 (2.48–3.55) | 0.78 | 0.15 | |
| GA | −3.02 (−3.56 to −2.49) | −4.25 (−4.86 to −3.63) | 2.25 (1.74–2.77) | 3.08 (2.51–3.65) | ||||||||
| AA | −1.85 (−3.12 to −0.58) | −3.64 (−5.02 to −2.27) | 1.06 (−0.06 to 2.18) | 3.17 (1.95–4.38) | ||||||||
| rs5368 | CC | −4.00 (−4.52 to −3.48) | 0.0004 | −3.61 (−4.22 to −3.00) | 0.08 | 0.0001b | 2.39 (1.94–2.85) | 0.15 | 3.09 (2.51–3.66) | 0.66 | 0.12 | |
| CT | −3.13 (−3.70 to −2.56) | −4.38 (−5.05 to −3.71) | 2.28 (1.74–2.82) | 3.09 (2.51–3.66) | ||||||||
| TT | −1.35 (−2.80 to 0.10) | −4.19 (−5.86 to −2.51) | 1.00 (−0.30 to 2.29) | 3.08 (2.44–3.71) | ||||||||
| rs3917423 | CC | −2.73 (−3.39 to −2.06) | 0.001 | −4.05 (−4.77 to −3.32) | 0.18 | 0.0007b | 2.01 (1.43–2.59) | 0.75 | 3.28 (2.60–3.95) | 0.48 | 0.49 | |
| CT | −3.24 (−3.73 to −2.75) | −3.93 (−4.50 to −3.36) | 2.39 (1.95–2.83) | 2.99 (2.45–3.53) | ||||||||
| TT | −4.36 (−5.06 to −3.65) | −3.41 (−4.17 to −2.65) | 2.13 (1.50–2.76) | 2.96 (2.26–3.65) | ||||||||
| rs1534904 | GG | −2.98 (−3.47 to −2.50) | 0.02 | −4.06 (−4.61 to −3.50) | 0.04 | 0.001b | 2.05 (1.62–2.47) | 0.48 | 3.17 (2.63–3.71) | 0.33 | 0.19 | |
| GT | −3.77 (−4.30 to −3.24) | −3.77 (−4.41 to −3.13) | 2.53 (2.04–3.02) | 2.95 (2.37–3.52) | ||||||||
| TT | −3.92 (−5.05 to −2.78) | −2.68 (−3.77 to −1.59) | 1.90 (0.91–2.89) | 2.67 (1.57–3.77) | ||||||||
| rs3917412 | GG | −3.06 (−3.53 to −2.59) | 0.03 | −4.15 (−4.69 to −3.62) | 0.007 | 0.0004b | 2.12 (1.70–2.54) | 0.53 | 3.21 (2.69–3.73) | 0.19 | 0.14 | |
| GA | −3.71 (−4.25 to −3.17) | −3.63 (−4.29 to −2.97) | 2.39 (1.89–2.89) | 2.91 (2.32–3.50) | ||||||||
| AA | −4.12 (−5.41 to −2.84) | −2.46 (−3.59 to −1.33) | 2.20 (1.12–3.29) | 2.47 (1.21–3.73) | ||||||||
| rs3917406 | CC | −2.86 (−3.52 to −2.19) | 0.004 | −4.13 (−4.89 to −3.37) | 0.16 | 0.002b | 2.10 (1.49–2.70) | 0.97 | 3.40 (2.67–4.13) | 0.60 | 0.56 | |
| CT | −3.21 (−3.73 to −2.69) | −3.92 (−4.55 to −3.29) | 2.28 (1.81–2.76) | 3.05 (2.47–3.64) | ||||||||
| TT | −4.51 (−5.36 to −3.66) | −3.39 (−4.19 to −2.59) | 2.08 (1.39–2.78) | 3.15 (2.41–3.89) | ||||||||
| rs932307 | AA | −2.66 (−3.31 to −2.01) | 0.0008 | −4.07 (−4.81 to −3.32) | 0.14 | 0.0005b | 1.80 (1.25–2.35) | 0.32 | 3.18 (2.49–3.87) | 0.60 | 0.34 | |
| AG | −3.44 (−3.89 to −2.90) | −3.81 (−4.43 to −3.19) | 2.40 (1.95–2.86) | 2.95 (2.39–3.50) | ||||||||
| GG | −4.43 (−5.23 to −3.63) | −3.35 (−4.15 to −2.55) | 2.17 (1.46–2.88) | 2.94 (2.22–3.65) | ||||||||
Abbreviations: CI, confidence interval; COL18A1, collagen, type XVIII, alpha 1; DDAH1, dimethylarginine dimethylaminohydrolase 1; HGNC, Human Genome Nomenclature Committee; VWF, von Willebrand factor.
a P value for genotype–sex interaction.
bFalse discovery rate Q < 0.05.
DISCUSSION
This study identified several novel genetic variants in the endothelial system that may have important influences on BP salt sensitivity. The number of copies of the G allele of rs11161637 in the DDAH1 gene was associated with decreased SBP and MAP responses to low-sodium intake. Examination of genotype–sex interaction revealed that these findings were likely driven by the strong associations observed in men. In addition, the C allele of VWF marker rs2239153 was related to increased DBP and MAP responses to low-sodium interventions in the overall analysis, whereas the COL18A1 rs2838944 A variant was related to attenuated DBP and MAP responses to high-sodium intake. Further, genotype–sex interactions were also observed for 3 independent loci within the SELE gene. These findings could have important public health and clinical implications. Compared with common variants that have been reported previously for other BP-related traits, variants identified in our main analysis each explained a relatively large proportion of the variation in the BP salt-sensitivity phenotypes (ranging 0.5%–2.1%). These results highlight the potential utility of examining intermediate phenotypes in genomic study. Furthermore, by providing strong evidence of genotype–sex interactions, our findings suggest a genomic explanation for observed sex differences in this complex trait.
Encoding one of the major endothelium-derived vasoactive mediators, the DDAH1 gene is implicated in BP salt sensitivity because of its influence on NO production through the regulation of asymmetrical dimethylarginine (ADMA).21 ADMA, which has been shown to increase after salt loading, is inversely associated with NO synthesis and BP.22–24 DDAH1 metabolizes ADMA to L-citrulline and dimethylamine, playing a key role in the determination of in vivo ADMA concentration.25 Although previous studies have not implicated DDAH1 gene variants in the pathogenesis of salt sensitivity, DDAH1 variants have been associated with ADMA concentrations and the increased risk of important BP-related traits, including chronic kidney disease, CVD, and thrombotic stroke.26–28 The minor G allele of novel marker rs11161637, which lies in an intronic region of the DDAH1 gene, was associated with decreased BP salt sensitivity in this study. This association was likely driven by the very strong association observed in men. Interestingly, Caplin and colleagues also noted a potential DDAH1–sex interaction in their analysis of plasma ADMA levels.28 Because there is little evidence for regulatory action or conservation of rs11161637 across species, it is unlikely that it is causally associated with salt sensitivity. It is more plausible that the association reflects linkage disequilibrium with a functional but still undiscovered variant. Although we await replication and functional study to elucidate the true nature of the observed relationship, the results provide promising evidence for a role of the DDAH1 gene in salt sensitivity of BP.
VWF is a largely endothelium-derived glycoprotein that is released into the circulation by damaged endothelial cells, promoting coagulation and platelet activation.29 In this study, we observed a significant, positive association between the novel VWF rs2239153 variant and BP responses to sodium intake. Although we are the first to identify such an association, Ferri and colleagues showed that plasma levels of the VWF glycoprotein were significantly elevated among those with salt-sensitive hypertension compared with those with salt-resistant hypertension.30 Furthermore, VWF gene polymorphisms have been associated with hypertension in past studies,31,32 making it a logical candidate for genetic study of salt sensitivity. Marker rs2239153 represents a common, intronic SNP in the VWF gene with unknown functional effects. Future replication studies are needed to validate the observed association, whereas sequencing and functional studies will be required to pinpoint the true causal variant underlying this relationship.
COL18A1 encodes a potent antiangiogenic protein,33 with its deficiency related to altered matrix remodeling, enhanced inflammatory response, and vascular endothelial cell damage.34 Further, the degradation of COL18A1 results in the generation of endostatin, which has been implicated in BP regulation because of its vasorelaxing effect.35,36 Despite physiological evidence for a role of COL18A1 in BP, to the knowledge of the authors, there have been no studies examining the association between COL18A1 gene variants and BP-related phenotypes. In this study, we identified an inverse dose–allele relationship between the intronic COL18A1 rs2838944 A variant and BP responses to the dietary sodium intervention, demonstrating a potentially important influence of COL18A1 on BP salt sensitivity.
We also identified 3 independent loci within the SELE gene that interacted with sex to influence BP salt sensitivity. Encoding a component of the selectin family of cell adhesion molecules, SELE is expressed in cytokine-stimulated endothelial cells and is thought to be involved in the pathogenesis of atherosclerosis.37,38 Although not previously associated with BP salt sensitivity, other studies have reported a role for SELE in BP regulation and hypertension.37,38 In addition, significant SELE–sex interactions on hypertension were reported in a separate study of Chinese participants.37 Although some follow-up work is warranted, these findings highlight the importance of considering gene–environment interaction in the context of BP salt sensitivity.
To date, GenSalt is the largest dietary intervention study to examine the association between genetic variants in the endothelial system and BP response to dietary sodium intervention. Furthermore, study attributes, including the recruitment of all Han Chinese participants, should make the analysis robust to population stratification. Participation in the dietary intervention was high, and compliance, as assessed by urinary excretion of sodium and potassium, was excellent. In addition, stringent quality control procedures were employed during the BP measurements, collection of other study variables, conduction of the dietary interventions, genotyping, and marker data cleaning. Compared with previous reports of common BP-associated variants, the SNPs identified in this study explained a relatively large proportion of the variation in the BP salt-sensitivity phenotypes.39 There are several potential explanations for these findings. As an intermediate BP phenotype, genetic heterogeneity may be reduced, decreasing the total phenotypic variance due to genomic factors. In addition, the study participants were similar with respect to lifestyle and environmental risk factors. These study attributes, along with the controlled dietary intake of sodium, decreased phenotypic variance due to environmental factors. Moreover, the multiple BP readings obtained on multiple days reduced the measurement errors, decreasing phenotypic variance due to random error. Finally, because of the “winner’s curse,” it is also possible that these findings represent an overestimate of the true proportion of variation explained by these SNPs. Therefore, caution is warranted in generalizing these findings beyond that of the current sample. Because our research was conducted in a Han Chinese population, the findings may not be generalizable to populations with distinct linkage disequilibrium structure. Finally, although the Affymetrix 6.0 platform generally provides good genomic coverage of common polymorphisms in the Han Chinese population (approximately 75%),3 limited genotype data were available for the EDN2, CYBA, and TGFB1 genes (see Supplementary Table S1). Therefore, future research to examine the association between common variants in these genes and BP salt sensitivity is still needed.
Our study is the first to associate endothelial system genes DDAH1, VWF, COL18A1, and SELE with BP salt sensitivity. Despite these promising results, further follow-up work is needed. Replication studies will be necessary to validate the novel associations reported here. Furthermore, sequencing and functional studies to pinpoint the causal variants underlying these relationships are warranted.
SUPPLEMENTARY MATERIAL
Supplementary materials are available at American Journal of Hypertension (http://ajh.oxfordjournals.org/).
DISCLOSURE
The authors declared no conflict of interest.
ACKNOWLEDGMENTS
The Genetic Epidemiology Network of Salt Sensitivity (GenSalt) is supported by a cooperative agreement project grant (U01HL072507, R01HL087263, and R01HL090682) from the National Heart, Lung and Blood Institute, National Institutes of Health, Bethesda, MD. Dr. Kelly was supported by American Heart Association award number 11SDG5130026.
REFERENCES
- 1. Kearney PM, Whelton M, Reynolds K, Muntner P, Whelton PK, He J. Global burden of hypertension: analysis of worldwide data. Lancet 2005; 365: 217–223 [DOI] [PubMed] [Google Scholar]
- 2. Danaei G, Finucane MM, Lin JK, Singh GM, Paciorek CJ, Cowan MJ, Farzadfar F, Stevens GA, Lim SS, Riley LM, Ezzati M. Global Burden of Metabolic Risk Factors of Chronic Diseases Collaborating Group (Blood Pressure) National, regional, and global trends in systolic blood pressure since 1980: systematic analysis of health examination surveys and epidemiological studies with 786 country-years and 5.4 million participants. Lancet 2011; 377: 568–577 [DOI] [PubMed] [Google Scholar]
- 3. Kato N, Takeuchi F, Tabara Y, Kelly TN, Go MJ, Sim X, Tay WT, Chen CH, Zhang Y, Yamamoto K, Katsuya T, Yokota M, Kim YJ, Ong RTH, Nabika T, Gu D, Chang L, Kokubo Y, Huang W, Ohnaka K, Yamori Y, Nakashima E, Jaquish CE, Lee JY, Seielstad M, Isono M, Hixson JE, Chen YT, Miki T, Zhang X, Sugiyama T, Jeon JP, Liu JJ, Takayanagi R, Kim SS, Aung T, Sung YJ, Zhou X, Wong TY, Han BG, Kobayashi S, Ogihara T, Zhu D, Iwai N, Wu JY, Teo YY, Tai ES, Cho YS, He J. Meta-analysis identifies five novel loci associated with blood pressure in East Asians. Nat Genet 2011; 43: 531–538 [DOI] [PMC free article] [PubMed] [Google Scholar]
- 4. Whelton PK, He J, Appel LJ, Cutler JA, Havas S, Kotchen TA, Roccella EJ, Stout R, Vallbona C, Winston MC, Karimbakas J. National High Blood Pressure Education Program Coordinating Committee Primary prevention of hypertension: clinical and public health advisory from the National High Blood Pressure Education Program. JAMA 2002; 288: 1882–1888 [DOI] [PubMed] [Google Scholar]
- 5. He J, Whelton PK. Salt intake, hypertension and risk of cardiovascular disease: an important public health challenge. Int J Epidemiol 2002; 31: 327–331 [PubMed] [Google Scholar]
- 6. GenSalt Collaborative Research Group GenSalt: rationale, design, methods and baseline characteristics of study participants. J Hum Hypertens 2007; 21: 639–646 [DOI] [PMC free article] [PubMed] [Google Scholar]
- 7. Denton D, Weisinger R, Mundy NI, Wickings EJ, Dixson A, Moisson P, Pingard AM, Shade R, Carey D, Ardaillou R, Paillard F, Chapman J, Thillet J, Michel JB. The effect of increased salt intake on blood pressure of chimpanzees. Nat Med 1995; 1: 1009–1016 [DOI] [PubMed] [Google Scholar]
- 8. Elliott P, Stamler J, Nichols R, Dyer AR, Stamler R, Kesteloot H, Marmot M. Intersalt revisited: further analyses of 24 hour sodium excretion and blood pressure within and across populations. Intersalt Cooperative Research Group. BMJ 1996; 312: 1249–1253 [DOI] [PMC free article] [PubMed] [Google Scholar]
- 9. Cutler JA, Follmann D, Allender PS. Randomized trials of sodium reduction: an overview. Am J Clin Nutr 1997; 65: S643–S651 [DOI] [PubMed] [Google Scholar]
- 10. He J, Gu D, Chen J, Jaquish CE, Rao DC, Hixson JE, Chen J, Duan X, Huang J, Chen CS, Kelly TN, Bazzano LA, Whelton PK. Gender differences in blood pressure responses to dietary sodium intervention in the GenSalt study. J Hypertens 2009; 27: 48–54 [DOI] [PMC free article] [PubMed] [Google Scholar]
- 11. Oberleithner H, Kusche-Vihrog K, Schillers H. Endothelial cells as vascular salt sensors. Kidney Int 2010; 77: 490–494 [DOI] [PubMed] [Google Scholar]
- 12. Toda N, Arakawa K. Salt-induced hemodynamic regulation mediated by nitric oxide. J Hypertens 2011; 29: 415–424 [DOI] [PubMed] [Google Scholar]
- 13. Caprioli J, Mele C, Mossali C, Gallizioli L, Giacchetti G, Noris M, Remuzzi G, Benigni A. Polymorphisms of EDNRB, ATG, and ACE genes in salt-sensitive hypertension. Can J Physiol Pharmacol 2008; 86: 505–510 [DOI] [PubMed] [Google Scholar]
- 14. Miyaki K, Tohyama S, Murata M, Kikuchi H, Takei I, Watanabe K, Omae K. Salt intake affects the relation between hypertension and the T-786C polymorphism in the endothelial nitric oxide synthase gene. Am J Hypertens 2005; 18: 1556–1562 [DOI] [PubMed] [Google Scholar]
- 15. Dengel DR, Brown MD, Ferrell RE, Reynolds TH, Supiano MA. A preliminary study on T-786C endothelial nitric oxide synthase gene and renal hemodynamic and blood pressure responses to dietary sodium. Physiol Res 2007; 56: 393–401 [DOI] [PubMed] [Google Scholar]
- 16. Castejon AM, Bracero J, Hoffmann IS, Alfieri AB, Cubeddu LX. NAD(P)H oxidase p22phox gene C242T polymorphism, nitric oxide production, salt sensitivity and cardiovascular risk factors in Hispanics. J Hum Hypertens 2006; 20: 772–779 [DOI] [PubMed] [Google Scholar]
- 17. Perloff D, Grim C, Flack J, Frohlich ED, Hill M, McDonald M, Morgenstern BZ. Human blood pressure determination by sphygmomanometry. Circulation 1993; 88: 2460–2470 [DOI] [PubMed] [Google Scholar]
- 18. Benjamini Y, Hochberg Y. Controlling the false discovery rate: a practical and powerful approach to multiple testing. J Royal Stat Soc Ser B 1995; 57: 289–300 [Google Scholar]
- 19. Chen Z, Yuhanna IS, Galcheva-Gargova Z, Karas RH, Mendelsohn ME, Shaul PW. Estrogen receptor alpha mediates the nongenomic activation of endothelial nitric oxide synthase by estrogen. J Clin Invest 1999; 103: 401–406 [DOI] [PMC free article] [PubMed] [Google Scholar]
- 20. Barrett JC, Fry B, Maller J, Daly MJ. Haploview: analysis and visualization of LD and haplotype maps. Bioinformatics 2005; 21: 263–265 [DOI] [PubMed] [Google Scholar]
- 21. Pope AJ, Karuppiah K, Cardounel AJ. Role of the PRMT-DDAH-ADMA axis in the regulation of endothelial nitric oxide production. Pharmacol Res 2009; 60: 461–465 [DOI] [PMC free article] [PubMed] [Google Scholar]
- 22. Scherbakov N, Sandek A, Martens-Lobenhoffer J, Kung T, Turhan G, Liman T, Ebinger M, von Haehling S, Bode-Böger SM, Endres M, Doehner W. Endothelial dysfunction of the peripheral vascular bed in the acute phase after ischemic stroke. Cerebrovasc Dis 2011; 33: 37–46 [DOI] [PubMed] [Google Scholar]
- 23. Lu TM, Chung MY, Lin MW, Hsu CP, Lin SJ. Plasma asymmetric dimethylarginine predicts death and major adverse cardiovascular events in individuals referred for coronary angiography. Int J Cardiol 2011; 153: 135–140 [DOI] [PubMed] [Google Scholar]
- 24. Das UN, Repossi G, Dain A, Eynard AR. L-arginine, NO and asymmetrical dimethylarginine in hypertension and type 2 diabetes. Front Biosci 2011; 16: 13–20 [DOI] [PubMed] [Google Scholar]
- 25. Matsuoka H, Itoh S, Kimoto M, Kohno K, Tamai O, Wada Y, Yasukawa H, Iwami G, Okuda S, Imaizumi T. Asymmetrical dimethylarginine, an endogenous nitric oxide synthase inhibitor, in experimental hypertension. Hypertension 1997; 29: 242–247 [DOI] [PubMed] [Google Scholar]
- 26. Ding H, Wu B, Wang H, Lu Z, Yan J, Wang X, Schaffer JR, Hui R, Wang DW. A novel loss-of-function DDAH1 promoter polymorphism is associated with increased susceptibility to thrombosis stroke and coronary heart disease. Circ Res 2010; 106: 1145–1152 [DOI] [PubMed] [Google Scholar]
- 27. Abhary S, Burdon KP, Kuot A, Javadiyan S, Whiting MJ, Kasmeridis N, Petrovsky N, Craig JE. Sequence variation in DDAH1 and DDAH2 genes is strongly and additively associated with serum ADMA concentrations in individuals with type 2 diabetes. PLoS One 2010; 5: e9462 [DOI] [PMC free article] [PubMed] [Google Scholar]
- 28. Caplin B, Nitsch D, Gill H, Hoefield R, Blackwell S, MacKenzie D, Cooper JA, Middleton RJ, Talmud PJ, Veitch P, Norman J, Wheeler DC, Leiper JM. Circulating methylarginine levels and the decline in renal function in patients with chronic kidney disease are modulated by DDAH1 polymorphisms. Kidney Int 2010; 77: 459–467 [DOI] [PubMed] [Google Scholar]
- 29. Mannucci PM. Von Willebrand factor: a marker of endothelial damage? Arterioscler Thromb Vasc Biol 1998; 18: 1359–1362 [DOI] [PubMed] [Google Scholar]
- 30. Ferri C, Bellini C, Desideri G, Giuliani E, De Siati L, Cicogna S, Santucci A. Clustering of endothelial markers of vascular damage in human salt-sensitive hypertension: influence of dietary sodium load and depletion. Hypertension 1998; 32: 862–868 [DOI] [PubMed] [Google Scholar]
- 31. Kokubo Y, Tomoike H, Tanaka C, Banno M, Okuda T, Inamoto N, Kamide K, Kawano Y, Miyata T. Association of sixty-one non-synonymous polymorphisms in forty-one hypertension candidate genes with blood pressure variation and hypertension. Hypertens Res 2006; 29: 611–619 [DOI] [PubMed] [Google Scholar]
- 32. Ruixing Y, Jinzhen W, Shangling P, Weixiong L, Dezhai Y, Yuming C. Sex differences in environmental and genetic factors for hypertension. Am J Med 2008; 121: 811–819 [DOI] [PubMed] [Google Scholar]
- 33. Passos-Bueno MR, Suzuki OT, Armelin-Correa LM, Sertié AL, Errera FI, Bagatini K, Kok F, Leite KR. Mutations in collagen 18A1 and their relevance to the human phenotype. An Acad Bras Cienc 2006; 78: 123–131 [DOI] [PubMed] [Google Scholar]
- 34. Hamano Y, Okude T, Shirai R, Sato I, Kimura R, Ogawa M, Ueda Y, Yokosuka O, Kalluri R, Ueda S. Lack of collagen XVIII/endostatin exacerbates immune-mediated glomerulonephritis. J Am Soc Nephrol 2010; 21: 1445–1455 [DOI] [PMC free article] [PubMed] [Google Scholar]
- 35. Li C, Harris MB, Venema VJ, Venema RC. Endostatin induces acute endothelial nitric oxide and prostacyclin release. Biochem Biophys Res Commun 2005; 329: 873–878 [DOI] [PubMed] [Google Scholar]
- 36. Wenzel D, Schmidt A, Reimann K, Hescheler J, Pfitzer G, Bloch W, Fleischmann BK. Endostatin, the proteolytic fragment of collagen XVIII, induces vasorelaxation. Circ Res 2006; 98: 1203–1211 [DOI] [PubMed] [Google Scholar]
- 37. Wang Z, Liu Y, Liu J, Liu K, Lou Y, Wen J, Niu Q, Wen S, Wu Z. E-selectin gene polymorphisms are associated with essential hypertension: a case–control pilot study in a Chinese population. BMC Med Genet 2010; 11: 127 [DOI] [PMC free article] [PubMed] [Google Scholar]
- 38. Faruque MU, Chen G, Doumatey A, Huang h, Zhou J, Deunston GM, Rotimi CN, Adeyemo AA. Association of ATP1B1, RGS5 and SELE polymorphisms with hypertension and blood pressure in African-Americans. J Hypertens 2011; 1906–1912 [DOI] [PMC free article] [PubMed] [Google Scholar]
- 39. The International Consortium of Blood Pressure Genome-Wide Association Studies Genetic variants in novel pathways influence blood pressure and cardiovascular disease risk. Nature 2011; 478: 103–109 [DOI] [PMC free article] [PubMed] [Google Scholar]