

Abstract
Single cell quantitative real-time PCR (qRT-PCR) combined with high-throughput arrays allows analysis of gene expression profiles at a molecular level in approximately 11 hours after cell sample collection. We present here a high-content microfluidic real-time platform as a powerful tool to comparatively investigate regulation of developmental processes in single cells. This approach overcomes the limitations involving heterogeneous cell populations and sample amounts, and may shed light on differential regulation of gene expression in normal versus disease-related contexts. Furthermore, high-throughput single-cell qRT-PCR provides a standardized, comparative assay for in-depth analysis of the mechanisms underlying human pluripotent stem cell self-renewal and differentiation.
Keywords: single cell, gene expression, dynamic assay, microfluidic, pluripotent
INTRODUCTION
Novel genomic technologies have paved the way for a more detailed understanding of fundamental cell biology processes in the past three decades. However, this experimental background is mainly based on analysing pools of several thousand cells, which limits in-depth analysis of cell differentiation, disease mechanisms, and the regulatory function underlying the transcriptome. Single cell quantitative real-time PCR (single cell qRT-PCR), a rapidly evolving tool, can address individual cellular units1–7. Minority cell populations are particularly important for disease-relevant questions such as stem cell differentiation and cancer, and single cell qRT-PCR proves to be especially useful in these contexts. In general, single cells are small and compartmentalized units characterized by numerous transcriptional variations and an increase of gene expression noise3, 8–10. The functional redundancy between genes of any cell type may account for varying gene expression levels and differences in the biological outcome, respectively. At the same time, variability may be averaged out to guarantee sufficient expression levels of critical genes at all time. Likely, these processes are subject to tight functional control by dynamic and reversible regulatory mechanisms1. While several approaches have been developed to analyse heterogeneity in single cells11–13, a more comprehensive understanding of these issues requires high-throughput approaches that can dissect molecular mechanisms in a homogeneous system of single-cell populations11. Microfluidic chips are a powerful approach to comparatively measure and characterize whole transcriptome patterns at high resolution7, 14.
Recently, microfluidic real-time arrays have been employed for gene expression profiling of human induced pluripotent stem cells (hiPSCs)15, providing a new platform to quantitatively evaluate the features of hiPSCs by analyzing the expression of a large pluripotency and differentiation markers panel, based on single cells16. Reprogramming of somatic cells to an induced pluripotent state using defined factors offers significant advantages over application of human embryonic stem cells (hESCs)17. Although they are considered the “gold standard”, hESCs are also compromised by ethical concerns and limited availability. By contrast, patient-derived hiPSCs avoid these pitfalls and therefore hold great hopes for drug discovery, genetic correction, and regenerative medicine purposes. However, before application of hiPSCs can be safely applied in human patients, the mechanisms behind hiPSCs’ pluripotency, self-renewal, and differentiation need to be further explored.
Here we describe in detail a microfluidic platform for evaluation of gene expression profiles in single pluripotent cells15 thereby providing vital information on variations in pluripotency within a defined population of cells, such as an hiPSC colony. Therefore, this technique will allow in-depth analysis of pluripotent cell fate, also with regard to monitoring the proliferation and survival of hiPSCs in animal models via in vivo imaging, as only a relatively small numbers of cells need to be extracted and characterized. hiPSCs and hESCs gene expression profiles can be directly compared, as performed recently employing microfluidic real-time arrays15. In this direct evaluation of hiPSC versus hESC, significant heterogeneity was seen at the single cell level for hiPSCs, which may account for their less consistent cardiac and endothelial cell differentiation efficiency as well as slower proliferation rate in vivo.
Comparison and limitations
Microfluidic single cell qRTPCR reveals gene expression differences amongst different types of single cells, such as present in pluripotent stem cell colonies. Currently, researchers explore a growing range of methods for functional analysis of heterogeneity in single stem cells, such as live imaging or genetic labelling18, 19. Other available methods include microfluidic real-time PCR on chips14, 20 or microdroplet-based microfluidic technology21. The former is suitable for applications such as large-scale profiling comparing gene expression levels in different tissues or single cells, while the latter provides an alternative approach for real-time gene expression profiling in small pools of cells. On the other hand, this protocol not only covers microfluidic real-time analysis of gene expression on a single-cell basis, thereby providing a novel approach for testing large numbers of cells and genes of interest simultaneously and in a high-throughput manner. Here, we also feature the application of microfluidic single cell qRTPCR for hiPSCs and hESCs, which are subject of a novel and thriving research field. While other present applications focus on specific cell types such as bacteria7, an advantage of this protocol lies in its general and wide applicability to experimental setups even when the amounts of starting material are limiting. Generating data quality that rivals benchmark real-time qPCR results, the microfluidic single cell gene expression platform presented here surpasses the classical approach of RNA isolation from a pool of cells as it offers the unique opportunity of addressing possible cell population heterogeneity. Overall, this platform allows quantitative high-content analysis and comparison of variations in gene expression patterns at the single cell level. A potential limitation of this method is the requirement of a sufficient number of replicates to achieve statistically conclusive data on single cell level.
Yet overall, various fields including early developmental biology, systems biology, and molecular medicine will benefit from this technology, especially when limited numbers of cells are available for analysis22–25. Researchers only begin to explore the potentially vast possibilities presented by this state-of-the-art microfluidic single cell gene expression profiling to elucidate some fundamental yet complex biological processes such as cellular self-renewal and differentiation, transcriptional control, variability and redundancy at the molecular level16, 26, 27.
EXPERIMENTAL DESIGN
RT-STA Master Mix Preparation
Single cell real-time PCR does not require RNA isolation due to the fact that the sample is a single cell, and therefore only contains picograms of RNA which would be lost during a traditional RNA isolation (Fig. 1). Instead, the sorted cell is directly introduced into the reverse transcription-specific target amplification (RT-STA) master mix. In order to achieve optimal sample preservation, this master mix contains 2x CellDirect Reaction Mix (CellsDirect One-Step qRT-PCR kit, Invitrogen) and SUPERase-In (Applied Biosystems), an enzyme which protects RNA extracted from lysed cell from any RNases that could be present in the RT-STA master mix. The master mix also presents a pool of all Taqman primers that will be studied later during the real-time PCR on the dynamic array. Finally, the master mix contains a mixture of two different enzymes for the RT-STA reaction. SuperScript III Reverse Transcriptase (Invitrogen), an improved engineered enzyme version with reduced RNase H activity and increased thermal stability, is capable of synthesizing specific cDNA from a total RNA sample. The second enzyme in the master mix, Platinum Taq DNA polymerase (Invitrogen), incorporates an antibody for inhibition of polymerase activity at room temperature (25 °C). Its automatic “hot start” allows for full polymerase activity restoration, increasing the amplification efficiency.
Figure 1.

Schematic of single cell real-time PCR protocol. Approximate time of the whole process with all the main protocol steps is 11 hours.
Controls
Each chip-run should include positive and negative RNA controls. When sorting the cells into the 96-well plate containing the RT-STA master mix, at least 4 wells can be left empty (no cell will be sorted into these wells). Two of these wells are used for positive control and they will have 1 μl positive RNA control at concentration of 0.1 μg/μl. The other two wells are left empty. The guiding principle in choosing the positive RNA control is to obtain high numbers of all assayed transcripts, such as total RNA extracted from a cell line known to express the desired genes at high levels. For instance, to represent genes associated with development, testes RNA (Human Testes Total RNA, Ambion) can be used.
Cell Sorting
Although single cell qRT-PCR is a useful tool for any type of cell, this protocol focuses on pluripotent cells, such as hESCs and hiPSCs. Both cell types are cultured on Matrigel-coated plates under conditions promoting an undifferentiated state. Despite these culturing conditions, spontaneous differentiation may occur at the edge of the colonies. In order to exclude partially differentiating cells from the analysis, hESCs and hiPSCs are fluorescently labelled using SSEA-4 (stage specific embryonic antigen-4) and Tra-1-60 pluripotency markers28, 29 as targets, as well as propidium iodide (PI) to distinguish the live cell population. When sorting cells for transcriptome studies it is important to choose suitable cell surface markers that do not alter the transcriptome profile because of changes in signalling pathways. Cells positive for Alexa Fluor 647-conjugated SSEA-4 and Alexa Fluor 488-conjugated TRA-1-60 are sorted using 488nm and 640nm lasers and 525/50 and 670/30 band pass filtering, respectively. One double-positive, live cell is directly sorted into each well of a 96-well plate, which is a highly automated process. Flow rates are set at 1000–2000 events per second. Five-laser (355nm, 405nm, 488nm, 532n and 640nm) FACSAria II provided with FACSDiva software for cell sorting is used (http://facs.stanford.edu/). The steps for FACS calibration are outlined in Box 1.
Box 1.
| Steps | Aim | Action |
|---|---|---|
| 1 | To calibrate PMT voltages | Run fluorescent beads (e.g., BD Calibrite). |
| 2 | To set drop delay | Run Accudrop beads (e.g., BD Accudrop). |
| 3 | To set up compensation (if necessary) | Run single-stained cells or antibody-labeled beads. |
| 4 | To remove debris and doubles | Create a parent gate based on FSC-A vs SSC-A properties. Subsequently, create a daughter gate based on FSC-A vs FSC-W, and granddaughter gate based on SSC-A vs SSC-W properties. |
| 5 | To remove dead cells | Exclude Propidium Iodine- or 7AAD-positive events from the analysis. |
| 6 | To set up sorting gates | Run an aliquot of the stained cells to be sorted. Set up positive and negative gates for the single cell sort. |
Reverse Transcription and Specific Target Amplification
In order to characterize complex cellular states at the single cell level using Dynamic Array™ integrated fluidic circuits (IFCs) several different steps must be followed for sample preparation. Prior to the qRT-PCR, reverse transcription and specific target amplification in a thermocycler suitable for 96-well plates are necessary. Both reactions occur in the same well that a particular cell was sorted into. After cells have been lysed in RT-STA buffer by influx of fluids through their cell membrane driven by hypotonic pressure, RNA is released and reversely transcribed at 50°C for 15 minutes via the SuperScript III Reverse Transcriptase. After cDNA synthesis, the reverse transcription reaction is inhibited and Platinum Taq DNA is activated at 70°C for 2 minutes. Activation of the enzyme is followed by specific target amplification for 18 cycles, each cycle consisting of a denaturation step (95°C for 15 seconds) followed by annealing/extension (60°C for 4 minutes). The specific target transcript amplification by Platinum Taq is required prior to real-time PCR via the microfluidic array because the amounts of RNA present in a single cell are on the order of picograms, and can be as low as a 1–10 molecules for rare mRNA species of interest. The Dynamic Array™ microfluidic chip operates by partitioning the sample into 48 (or 96) microfluidic chambers and performing qPCR detection and quantification for a specific gene in each chamber. The specific target amplification enriches all loci of interest such that the cDNA synthesized from those loci can later be distributed evenly throughout the 48 (or 96) Dynamic Array™ chambers, with each chamber having at least 100 copies of even the rarest target transcript. Without this first amplification round, the target genes would not be efficiently detected by Dynamic Array™ IFC.
Dynamic Array™ IFCs
Two Dynamic Array™ IFC sizes are available for the single cell real-time PCR in nanoliter reaction volumes: 48.48 and 96.96. In this protocol, we focus on the use of 48.48 Dynamic Array™ IFCs, which will be run in the BioMark HD Reader. With this array, the expression levels of 48 genes may be studied. Among the 48 genes there should be at least one housekeeping gene which reflects the amount of RNA supplied and is necessary for result data normalization. The suitability of housekeeping genes depends on the cell type and the experimental set up. The most abundant and stable housekeeping gene, and therefore widely used, is the ribosomal RNA 18S, which is also the one selected in the current experimental protocol. The chip is built as a matrix of 48 (or 96) “sample” channels crossing 48 (or 96) “gene expression assay” channels intersecting in 48*48=2,304 (or 96*96=9,216) chambers30. In each of these chambers, a specific sample (single cell cDNA) is combined with a specific gene expression assay. Each gene expression assay consists of a pair of primers targeting the gene of interest, in addition to a gene-specific dual labelled hydrolysis probe or a dsDNA binding dye. In each of these chambers, a single real-time qPCR reaction takes place. Dynamic Array™ IFCs offers the opportunity to combine different standard reagents, an advantage that makes the assay configuration more flexible. The protocol we detail here is intended for the use of Taqman primers (Applied Biosystems). Alternatively, DNA-binding dyes such as EvaGreen (Biotium) may be used, allowing for a more affordable selection of real-time PCR primers.
Single-cell real-time PCR results
In this study, the single cell real-time PCR results are shown as threshold cycles (CT). A CT value, which measures target transcript abundance in the sample, is defined as the qPCR cycle for which the relative fluorescence intensity exceeds a common threshold within the exponential qPCR amplification phase. These values are calculated by the Fluidigm Real-time PCR analysis software. The results can be displayed as results table, image view diagram, or heat map. The results table shows the numeric CT values of the different samples for each gene. The image view option allows to graphically plot the fluorescence intensity as it increases during the qPCR amplification. Lastly, the heat map represents the results according to color range, with each color tone indicating a CT value. In heat map display, individual assays (X-axis) are plotted against individual samples (Y-axis).
The housekeeping gene included in the array can be used to normalize the CT values and thereby to correct differences in the CT values that are due to slightly varying starting amounts of RNA. The normalization of the CT values results in so-called ΔCT values is shown by the following:
ΔCT values from the sample of interest can be related to a control sample:
to obtain fold difference values following the formula:
The primary data obtained are compatible with different gene expression software.
MATERIALS
REAGENTS
H7 human embryonic stem cells (WiCell, Madison, WI)
Accudrop Fluorescent Beads (BD, cat no. 345249)
Accutase (Sigma-Aldrich, cat no. A6964)
Alexa Fluor 488-conjugated mouse anti-human Tra-1-60 (BD Pharmingen, cat no. 560173)
Alexa Fluor 647-conjugated mouse anti-human SSEA-4 (BD Pharmingen, cat no. 560796)
Calibrite Beads (BD, cat no. 349502)
-
CellsDirect ™ One-Step qRT-PCR kit (Invitrogen, cat no. 11753-100 and 11753-500)
CRITICAL This kit contains the CellsDirect Reaction Mix buffer and the SuperScript™ III/Platinum Taq Mix. So far this kit has been the best one to ensure good RNA quality, reverse transcription and cDNA amplification for the current protocol.
Control line fluid kit 48.48 (Fluidigm, cat no. 89000020)
DA Assay Loading Reagent (Fluidigm, cat no.85000736)
DA Sample Loading Reagent (Fluidigm, cat no. 85000735)
DMEM-F12 (Invitrogen, Gibco, cat no. 10565)
DPBS, without Ca2+ and Mg2+ (GIBCO, cat no. 14190)
FBS, ES-Cell (Invitrogen, Gibco, cat no. 16141)
Human Testes Total RNA (Ambion, cat no. AM7852)
Matrigel Growth Factor Reduced (BD, cat no. 354230)
mTeSR-1 (Stem Cell Technologies, cat no. 05850)
Propidium iodide (BD Pharmingen, cat no. 556463) ! CAUTION Propidium iodide is a potential carcinogen. Avoid contact with skin and eyes. Protect yourself by using protective clothing, gloves and eye/face protection.
Trypan Blue Stain 0.4% (Invitrogen, Gibco, cat no. 15250)
SUPERase-In™ (Applied Biosystems, cat no. AM2694) ! CAUTION It may cause skin, eye and respiratory tract irritation. Wear suitable protective equipment. Use it only in areas with appropriate exhaust ventilation.
Taqman gene expression assays (Taqman assays) (Applied Biosystems, cat no. 4331182 or 4351372)
Taqman Universal PCR Master Mix (Applied Biosystems, cat no. 4304437)
TE buffer (Ambion, cat no. AM9849)
EQUIPMENT
1.5-ml microcentrifuge tubes (E&K Scientific, cat no. 280150)
10-ml disposable serological pipet (BD Falcon, cat no. 356551)
15-ml centrifuge tubes (BD Falcon, cat no. 352097)
40-μm Cell strainer (BD, cat no. 352340)
5 cm Petri dish (BD Falcon, cat no. 351006)
5-ml disposable serological pipet (BD Falcon, cat no. 356543)
5-ml round-bottom tube (BD Falcon, cat no. 352063)
6-well plates (BD Falcon, cat no. 353046)
96-well PCR plate (E&K Scientific, cat no. 489096)
Aspirating disposable pipets (BD Falcon, cat no. 357558)
BioMark HD Reader (Fluidigm)
BMK-M-48.48 Fluidigm, 48.48 dynamic array chips (Fluidigm)
Cell culture hood
Cell culture incubator, 95% air and 5% CO2, humidified
Cell scraper (Corning, cat no. 3010)
Cell-Strainer cap FACS tubes (BD Falcon, cat no. 352235)
Countess Automated Cell Counter (Invitrogen, cat no. C10227)
Countess Cell Counting Chamber Slides (Invitrogen, cat no. C10228)
Fluorescence-activated cell sorter (BD Biosciences, FACSAria II)
Hemocytometer (Hausser Scientific, cat no. 3500)
Multichannel pipettes
Optical Adhesive Film (Applied Biosystems, cat no. 4311971)
Thermocycler (Applied Biosystems, Veriti)
TipOne 0.1–10 μl Extended length filter tips (USA Scientific, cat no. 1120-3810)
TipOne 101–1000 μl Extended length filter tips (USA Scientific, cat no. 1122-1830)
TipOne 1–200 μl Graduated Filter Tips (USA Scientific, cat no. 1120-8810)
REAGENT SETUP
FACS buffer
Prepare DPBS with 2% ES-Cell FBS. Store at 4°C for ~1 week.
Matrigel solution
Dilute the Matrigel 1/60 in DMEM-F12 media. Thaw the Matrigel on ice. Prepare the dilution fresh just before coating the plates.
Matrigel-coated 6-well plates
Add 1 ml of Matrigel solution to cover the whole surface of a 6-well-plate well. Incubate the 6-well plate for a minimum of 30 min at 37°C. Before using the well, aspirate the excess of Matrigel. Do not let the well dry. Remove the Matrigel just prior to add the media.
mTeSR-1 media
Mix the supplement bottle content with the mTeSR-1 media. Store at 4°C for ~2 weeks or make aliquots and store at −20°C for ~2 months.
PROCEDURE
Preparation of the Reverse Transcription-Specific Target Amplification (RT-STA) master mix TIMING ~1h
-
1|
Thaw the 2x CellsDirect Reaction mix located in the CellsDirect™ One-Step qRT-PCR kit on ice, as well as the 20x Taqman assays (Taqman primers) of interest.
-
2|
Prepare the Assay Mix in a 1.5 ml tube. This Assay Mix contains all Taqman assays that will be studied in the single-cell real-time PCR. Concentrations of the Taqman assays utilized in the mix will be 0.2x. Use TE buffer to dilute the Taqman assays. For instance, if the final volume of the Assay Mix is 150 μl and there are 48 genes to be studied add 1.5 μl of each Taqman assay and subsequently make the total volume up to 150 μl with TE Buffer.
Component Volume to add per reaction (μl) Final concentration 20x Taqman assay 1 1.5 0.2x 20x Taqman assay 2 1.5 0.2x “ “ 20x Taqman assay 48 1.5 0.2x TE buffer 150-72
Total 150 μl 0.2x Assay mix can be stored at 4°C in the darkness for ~ 1 week -
3|
Take another 1.5 ml microcentrifuge tube to prepare the RT-STA Mix. Add the following reagent amounts per sample:
Component Volume to add per reaction (μl) Final concentration 2x CellsDirect Reaction Mix 5 1x TE buffer 2.3 SUPERase-In 0.1 20 units/μl Assay Mix 2.5 0.2x SuperScript™ III/Platinum Taq Mix 0.2 CRITICAL STEP Calculate always an excess of volume to overcome pipetting errors.
-
4|
Mix all reagents well by pipetting up and down. Distribute 10.1 μl of the RT-STA mix per well of a 96-well plate suitable for PCR. Notice that per each 48.48 Fluidigm chip, only 48 wells are required.
PAUSE POINT The RT-STA mix can be stored at −20°C or −80°C for ~ 3 months until needed. It should be thawed only right before using it. Freeze-thaw cycles must be avoided.
Cell sample preparation TIMING 1 h
-
5|
Grow the hESCs and the iPSCs on Matrigel-coated plates with mTeSR-131, 32.
-
6|
When the cells reach appropriate density (60–70%), remove the cell culture media and wash once with warm DPBS.
-
7|
Add 1 ml of Accutase per well of a 6-well plate.
-
8|
Monitor the cells under the microscope and leave the Accutase until colonies start to disaggregate into single cells (Fig. 2a).
-
9|
Remove the Accutase, leaving the cells slightly wet.
-
10|
Return the 6-well plate into the incubator at 37°C for 3 minutes (Fig. 2b).
-
11|
Immediately add 1 ml of mTeSR-1 to the 6-well-plate.
-
12|
Scrape the colonies with a cell scraper if some are still attached to the bottom of the plate.
-
13|
Collect the cells and transfer them into a 15-ml centrifuge tube.
-
14|
Centrifuge the cells at 200 g for 5 min at room temperature and remove the supernatant.
-
15|
Resuspend the cell pellet in 1 ml of DPBS.
-
16|
Transfer the cells to a FACS tube after passing them through a 40 μm strainer or use FACS tubes with Cell-Strainer caps.
-
17|
Take 10 μl of the cell suspension and mix it with Tryplan Blue in a 1:1 ratio. Load the mixture of cell suspension and Trypan Blue into a counting slide chamber and count the cells in an automated cell counter. Alternatively, the cell number can be determined by loading the mixture of cell suspension and Trypan Blue into a hemocytometer and count the cells under a regular brightfield microscope.
-
18|
Centrifuge 0.5 × 10⁶ to 1 × 10⁶ cells at 200g for 5 min at 4°C and remove the supernatant.
-
19|
Incubate the cells with 20 μl of Alexa Fluor 647-conjugated mouse anti-human SSEA-4 per 1 × 10⁶ cells and 5 μl of Alexa Fluor 488-conjugated mouse anti-human Tra-1-60 per 1 × 10⁴ cells for 30 min on ice.
-
20|
Wash the cell pellet with 600 μl of DPBS.
-
21|
Resuspend the cells in 200 μl of FACS buffer right before sorting and keep them on ice.
CRITICAL STEP Always keep the cells on ice. Once the cells have been resuspended in FACS buffer sort them immediately to avoid possible negative effects of the FBS in pluripotent cells.
Figure 2.
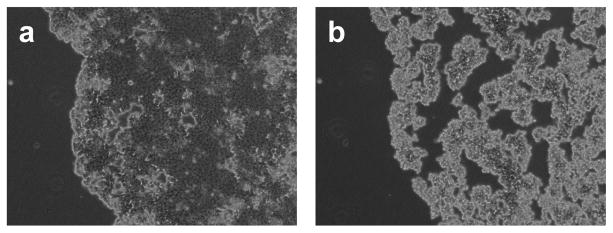
Cell colony dissociation into single cells with Accutase. (a) Cell colony after 2 minutes in Accutase. (b) Cell colony after removing Accutase and having the cells at 37°C for 3 minutes.
FACS TIMING 30 min
-
22|
Add 10 μl of propidium iodide per 1 × 10⁶ cells to the single cell suspension just prior to cell sorting.
-
23|
Sort single cells directly into the wells of a 96-well plate containing the RT-STA Mix (from Step 4). Remember not to sort cells into the wells dedicated to positive and negative controls.
CRITICAL STEP Sort the cells in the same plate which is used for the RT-STA PCR. Keep the 96-well plate always on ice.
-
24|
Cover the 96-well plate with an optical adhesive film.
-
25|
Mix samples by flicking the 96-well plate.
-
26|
Spin 96-well-plate down briefly to make sure no drop is adhering to the walls of the 96-well plate.
PAUSE POINT The samples can be run immediately or stored at −20°C for ~ 3 months.
Reverse transcription and specific target amplification TIMING ~2h
-
27|
Place the 96-well plate in a thermocycler.
-
28|
Run the sample PCR following these parameters:
50°C for 15 min 70°C for 2 min 18 cycles of: 95°C for 15 sec, 60°C for 4 min Hold at 4°C -
29|
Add 10 μl of TE buffer to each sample. The final sample volume is now 20 μl.
CRITICAL STEP: Any dilution between 1:2 and 1:5 is possible
PAUSE POINT The specific cDNA can be stored at −20°C for ~ 3 months before running the Fluidigm chip. It should be thawed only right before loading the chip.
Sample preparation for real-time PCR TIMING 1h
-
30|
To prepare the assays and samples to be loaded onto the Dynamic Array™ IFC, divide a 96-well plate into two halves; use the left side for assays and the right side for the cDNA samples. Keep the 96-well plate always on ice and protect it from the light as much as possible.
-
31|
Assay Mix: In a total of 48 wells, add 3.75 μl of the 2x Assay loading reagent per well and 3.75 μl of each 20x Taqman assay from Step 3 used for the RT-STA.
CRITICAL STEP Note that at this point, there is only one Taqman assay in each well, and no longer a pool of all the Taqman assays.
-
32|
Sample Mix: in a total of 48 wells, add 3.38 μl of the cDNA obtained during the RT-STA from Step 28, 3.75 μl of Taqman Gene Expression Master Mix and 0.375 μl of 20x Gene sample loading reagent.
Chip priming TIMING 20 min
-
33|
Take a BioMark™ 48.48 Dynamic Array-Real-Time PCR chip from its bag. Avoid touching the center of the chip
CRITICAL STEP Use the BioMark™ 48.48 Dynamic Array-Real-Time PCR chip within 24 h after opening the package.
-
34|
Hold the chip in a 45° angle. Inject Control Line Fluid in both sides of the chip by introducing the syringe through the inlets without bending the pipette tip, and pushing down the black O-ring.
-
35|
Once the fluid has been injected and the syringe removed, make sure the O-ring is returned to its original position.
CRITICAL STEP Make sure there are no drops of Control Line Fluids on the chip or in the inlets, which would cause the chip to be unusable.
-
36|
Place the chip in a bay of the NanoFlex IFC Controler.
-
37|
Introduce the chip ID, which corresponds to the barcode.
CRITICAL STEP Type the barcode number correctly, because it is identical with the identification number for this real-time PCR on the BioMark System.
-
38|
Assign a name to the experiment and enter operator information to the computer software.
-
39|
Select the script: 113x Chip prime.
-
40|
Selecting “OK” starts the prime.
Chip loading TIMING 1.5 h
-
41|
Mix well by pipetting up and down the mixes containing samples (from Step 31) and Taqman assays (from Step 30) prepared in the 96-well plate.
CRITICAL STEP The chip should be loaded with samples and assays no later than 60 min after priming the chip.
-
42|
Take 5 μl from each well of the assay mix which was prepared on the left side of the 96-well plate in Step 30 and transfer them to a chip well on the left side of the chip following the distribution presented in Figure 3. Do the same with the sample mix which was prepared on the right side of the 96-well plate in Step 31 and transfer it to the right side of the chip (Fig. 3).
CRITICAL STEP It is critical to avoid producing any bubbles inside the chip wells when combining assay and sample mixes. To avoid bubbles, press the pipette only until the first stop.
-
43|
Place the chip back onto a bay of the NanoFlex IFC Controler Machine.
-
44|
Enter the chip barcode and operator information to the computer software.
-
45|
Select the script: 113x Load-mix.
-
46|
Selecting “OK” starts the loading.
? TROUBLESHOOTING
Figure 3.
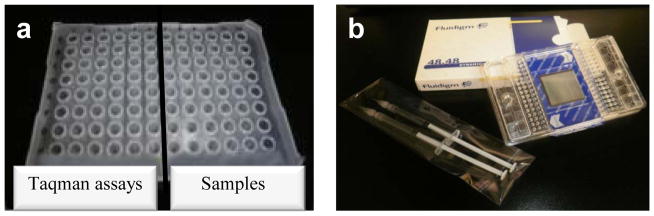
Distribution in the 48.48 Dynamic Array. This figure outlines how assays (left side on the 96-well plate) and samples (right side on the 96-well plate) are loaded into the chip by showing a letter/number code. Although both halves of the 96-well plate and one side of the chip have 48 wells, their spatial distribution is different.
Real-time PCR TIMING 2h
-
47|
20 minutes before starting the real-time PCR, start the Fluidigm BioMark machine to warm up the lamp. Select “BioMark data collection Fluidigm” program from the computer.
-
48|
Select “double click to warm up the lamp” from the program. The lamp will be ready in 20 minutes.
CRITICAL STEP In order to start the real-time PCR the camera and the lamp indicator on the software should be in green.
-
49|
When the chip is ready, open the program “BioMark Data Collection Fluidigm”.
Selecting “start a new run” opens the machine door.
-
50|
Insert the chip with the barcode facing the outside of the machine.
CRITICAL STEP Do not forget to remove the protective plastic cover from the chip.
-
51|
Select “load”. The Fluidigm BioMark system loads the chip and reads the barcode.
-
52|
Enter chip information: Select “new chip run”, select a name for the run and save it.
-
53|
In the next window, select “gene expression”, “ROX”, “single probe”, and “Probes: FAM-MGB”.
-
54|
The next screen shows the different protocols. Select the protocol “Default-10-min-Hot-start”.
50°C for 2 min Amplification Erase Phase 95°C for 10 min Hot Start Phase 40 cycles of: 95°C for 15 sec, 60°C for 1 min Denature phase, anneal phase -
55|
Select “Start Run” to begin the real-time PCR.
CRITICAL STEP The chip run should begin within 4 h of the samples and assays loading.
Result analysis TIMING 1-2 hr
-
56|
When the run has finished, open the program “Fluidigm Real-time PCR analysis”.
-
57|
Open the chip run to be analyzed.
-
58|
Select “Analysis view”.
-
59|
With the view of the results, change any parameter of interest, such as the threshold or baseline correction. Click “Analyze”.
-
60|
The results are shown as threshold cycle (CT) values. The CT values can be seen in the software such as heat map view, image view and results table. Export all formats with the “.csv” extension (Fig. 4).
? TROUBLESHOOTING
-
61|
The data can be visualized and fully analyzed using Fluidigm Real-time PCR analysis or any program for gene expression arrays.
Figure 4.

Single-cell real-time PCR results. Results can be obtained from the Fluidigm Real-time PCR analysis software in three different formats: (a) results table, (b) image view, and (c) heatmap. (d) Different software types can be used to analyze the data and create graphs to show gene expression levels.
Step 1–4, Preparation of RT-STA master mix: ~1 hr
Step 5–21, Cell sample preparation: 1 hr
Step 22–26, FACS sorting: 30 min
Step 27–29, Reverse transcription and specific target amplification: ~2 hr
Step 30–32, Sample preparation for Real-time PCR: 1 hr
Step 33–40, Chip priming: 20 min
Step 41–46, Chip loading: 1.5 hr
Step 47–55, Real-time PCR: ~2 hr
Step 56–61, Result analysis: 1–2 hr
? TROUBLESHOOTING
Troubleshooting advice is summarized in Table 1.
TABLE 1.
Troubleshooting.
| Step | Problem | Possible reason | Solution |
|---|---|---|---|
| 46 | After loading the array light lines can be seen on the chip | The assay or sample mixes did not flow through the chip properly | Make sure there are no bubbles on the bottom of the chip wells after loading the assays and sample mixes |
| 60 | No product amplification for some samples | Sorted cell attached to the well wall | Flick the 96-well plate after cell sorting and then spin down briefly |
| Cell sorting did not work properly | Revise FACS setting to sort single cells into 96-well plates | ||
| RNA degradation | Work in RNase-free environment. Use clean instruments and tips with filters | ||
| Air bubbles on chip | Add the assays and samples to the chip pushing the pipette only down to the first pipette stop | ||
| Chip is dirty | Avoid touching the top of the chip with your hands or any liquid | ||
| Gene is not present | The sample does not contain the gene | ||
| 60 | No product amplification in the whole chip | Protective plastic was not removed | Remove the blue plastic film just before starting the Real-time PCR |
| RT-STA did not work | Double check that all the reagents were added and the thermal cycle was correct | ||
| 61 | New results are not consistent with results from previous chip runs | Wrong sorted cells; FACS gates were incorrect | Make sure the gating principle is consistent over time when sorting cells |
| Cell gene expression pattern has changed | Sort the cells as soon as possible and keep them always on ice |
ANTICIPATED RESULTS
Successful chip-runs will generate heatmaps with gene Ct values encoded by different colours (Fig 5). In an optimal situation, all the samples rows loaded with cell cDNA will show Ct values at least at the housekeeping gene column. However, depending on the experimental design, not all the gene columns may yield a value. The lack of Ct values for a specific gene, represented in the heatmap in black, can be read as the absence of gene expression in that sample. In a bad chip run the housekeeping gene levels will be barely or not detected, or the same cell type will create overly different transcriptome patterns which will hinder result interpretation.
Figure 5.

Heatmap results interpretation. The heatmap shows Ct values encoded by different colors. Positive controls will show results for all the studied genes, whereas negative controls will not show any Ct value (encoded in black). Good samples will have high Ct values for the housekeeping gene, whereas a bad sample or chip-run will not show housekeeping gene Ct values or these will be contradictory. Among the good samples there will be genes which are highly expressed compare to others barely detected. It is also possible to get no Ct values for a specific gene, which can be interpreted as a lack of expression by that cell sample.
Acknowledgments
We are grateful to Patricia E. de Almeida for FACS discussion. We acknowledge funding support from Swiss National Science Foundation PBBEP3_129803 (V.S.F.); German Research Foundation (A.D.E.); Howard Hughes Medical Institute (S.R.Q.); National Institutes of Health (NIH) DP2OD004437, RC1AG036142, R01AI085575, and Burroughs Welcome Foundation (J.C.W.).
Footnotes
AUTHOR CONTRIBUTIONS V.S.F. and A.D.E. prepared most of the paper. T.K., S.R.Q., and J.C.W provided advice and proofread the paper.
COMPETING FINANCIAL INTERESTS S.R.Q. is affiliated with Fluidigm. The rest of the authors declare no competing financial interests.
References
- 1.Kalisky T, Quake SR. Single-cell genomics. Nat Methods. 2011;8:311–314. doi: 10.1038/nmeth0411-311. [DOI] [PubMed] [Google Scholar]
- 2.Heid CA, Stevens J, Livak KJ, Williams PM. Real time quantitative PCR. Genome Res. 1996;6:986–994. doi: 10.1101/gr.6.10.986. [DOI] [PubMed] [Google Scholar]
- 3.Harris TD, et al. Single-molecule DNA sequencing of a viral genome. Science. 2008;320:106–109. doi: 10.1126/science.1150427. [DOI] [PubMed] [Google Scholar]
- 4.Kurimoto K, Yabuta Y, Ohinata Y, Saitou M. Global single-cell cDNA amplification to provide a template for representative high-density oligonucleotide microarray analysis. Nat Protoc. 2007;2:739–752. doi: 10.1038/nprot.2007.79. [DOI] [PubMed] [Google Scholar]
- 5.Flatz L, et al. Single-cell gene-expression profiling reveals qualitatively distinct CD8 T cells elicited by different gene-based vaccines. Proc Natl Acad Sci U S A. 2011;108:5724–5729. doi: 10.1073/pnas.1013084108. [DOI] [PMC free article] [PubMed] [Google Scholar]
- 6.Guo G, et al. Resolution of cell fate decisions revealed by single-cell gene expression analysis from zygote to blastocyst. Dev Cell. 2010;18:675–685. doi: 10.1016/j.devcel.2010.02.012. [DOI] [PubMed] [Google Scholar]
- 7.Shi X, et al. Real-time PCR of single bacterial cells on an array of adhering droplets. Lab Chip. 2011;11:2276–2281. doi: 10.1039/c1lc20207c. [DOI] [PubMed] [Google Scholar]
- 8.Elowitz MB, Levine AJ, Siggia ED, Swain PS. Stochastic gene expression in a single cell. Science. 2002;297:1183–1186. doi: 10.1126/science.1070919. [DOI] [PubMed] [Google Scholar]
- 9.Levsky JM, Singer RH. Gene expression and the myth of the average cell. Trends Cell Biol. 2003;13:4–6. doi: 10.1016/s0962-8924(02)00002-8. [DOI] [PubMed] [Google Scholar]
- 10.Stahlberg A, Bengtsson M. Single-cell gene expression profiling using reverse transcription quantitative real-time PCR. Methods. 2010;50:282–288. doi: 10.1016/j.ymeth.2010.01.002. [DOI] [PubMed] [Google Scholar]
- 11.Rajan S, Djambazian H, Dang HC, Sladek R, Hudson TJ. The living microarray: a high-throughput platform for measuring transcription dynamics in single cells. BMC Genomics. 2011;12:115. doi: 10.1186/1471-2164-12-115. [DOI] [PMC free article] [PubMed] [Google Scholar]
- 12.Zhang Y, Zhu Y, Yao B, Fang Q. Nanolitre droplet array for real time reverse transcription polymerase chain reaction. Lab Chip. 2011;11:1545–1549. doi: 10.1039/c0lc00502a. [DOI] [PubMed] [Google Scholar]
- 13.Morris J, Singh JM, Eberwine JH. Transcriptome analysis of single cells. J Vis Exp. 2011 doi: 10.3791/2634. [DOI] [PMC free article] [PubMed] [Google Scholar]
- 14.White AK, et al. High-throughput microfluidic single-cell RT-qPCR. Proc Natl Acad Sci U S A. 2011;108:13999–14004. doi: 10.1073/pnas.1019446108. [DOI] [PMC free article] [PubMed] [Google Scholar]
- 15.Narsinh KH, et al. Single cell transcriptional profiling reveals heterogeneity of human induced pluripotent stem cells. J Clin Invest. 2011;121:1217–1221. doi: 10.1172/JCI44635. [DOI] [PMC free article] [PubMed] [Google Scholar]
- 16.Warren L, Bryder D, Weissman IL, Quake SR. Transcription factor profiling in individual hematopoietic progenitors by digital RT-PCR. Proc Natl Acad Sci U S A. 2006;103:17807–17812. doi: 10.1073/pnas.0608512103. [DOI] [PMC free article] [PubMed] [Google Scholar]
- 17.Takahashi K, Yamanaka S. Induction of pluripotent stem cells from mouse embryonic and adult fibroblast cultures by defined factors. Cell. 2006;126:663–676. doi: 10.1016/j.cell.2006.07.024. [DOI] [PubMed] [Google Scholar]
- 18.Schroeder T. Long-term single-cell imaging of mammalian stem cells. Nat Methods. 2011;8:S30–35. doi: 10.1038/nmeth.1577. [DOI] [PubMed] [Google Scholar]
- 19.Hope K, Bhatia M. Clonal interrogation of stem cells. Nat Methods. 2011;8:S36–40. doi: 10.1038/nmeth.1590. [DOI] [PubMed] [Google Scholar]
- 20.Spurgeon SL, Jones RC, Ramakrishnan R. High throughput gene expression measurement with real time PCR in a microfluidic dynamic array. PLoS One. 2008;3:e1662. doi: 10.1371/journal.pone.0001662. [DOI] [PMC free article] [PubMed] [Google Scholar]
- 21.Mary P, et al. Analysis of gene expression at the single-cell level using microdroplet-based microfluidic technology. Biomicrofluidics. 2011;5:24109. doi: 10.1063/1.3596394. [DOI] [PMC free article] [PubMed] [Google Scholar]
- 22.Tamburini BA, et al. Gene expression profiling identifies inflammation and angiogenesis as distinguishing features of canine hemangiosarcoma. BMC Cancer. 2010;10:619. doi: 10.1186/1471-2407-10-619. [DOI] [PMC free article] [PubMed] [Google Scholar]
- 23.Stahlberg A, Kubista M, Aman P. Single-cell gene-expression profiling and its potential diagnostic applications. Expert Rev Mol Diagn. 2011;11:735–740. doi: 10.1586/erm.11.60. [DOI] [PubMed] [Google Scholar]
- 24.Al Dahouk S, Tomaso H, Nockler K, Neubauer H. The detection of Brucella spp. using PCR-ELISA and real-time PCR assays. Clin Lab. 2004;50:387–394. [PubMed] [Google Scholar]
- 25.Simunovic F, Yi M, Wang Y, Stephens R, Sonntag KC. Evidence for gender-specific transcriptional profiles of nigral dopamine neurons in Parkinson disease. PLoS One. 2010;5:e8856. doi: 10.1371/journal.pone.0008856. [DOI] [PMC free article] [PubMed] [Google Scholar]
- 26.Lindstrom S, Hammond M, Brismar H, Andersson-Svahn H, Ahmadian A. PCR amplification and genetic analysis in a microwell cell culturing chip. Lab Chip. 2009;9:3465–3471. doi: 10.1039/b912596e. [DOI] [PubMed] [Google Scholar]
- 27.Zeng Y, Novak R, Shuga J, Smith MT, Mathies RA. High-performance single cell genetic analysis using microfluidic emulsion generator arrays. Anal Chem. 2010;82:3183–3190. doi: 10.1021/ac902683t. [DOI] [PMC free article] [PubMed] [Google Scholar]
- 28.Chan EM, et al. Live cell imaging distinguishes bona fide human iPS cells from partially reprogrammed cells. Nat Biotechnol. 2009;27:1033–1037. doi: 10.1038/nbt.1580. [DOI] [PubMed] [Google Scholar]
- 29.Sun N, et al. Feeder-free derivation of induced pluripotent stem cells from adult human adipose stem cells. Proc Natl Acad Sci U S A. 2009;106:15720–15725. doi: 10.1073/pnas.0908450106. [DOI] [PMC free article] [PubMed] [Google Scholar]
- 30.Liu J, Hansen C, Quake SR. Solving the “world-to-chip” interface problem with a microfluidic matrix. Anal Chem. 2003;75:4718–4723. doi: 10.1021/ac0346407. [DOI] [PubMed] [Google Scholar]
- 31.Li Z, et al. Functional and transcriptional characterization of human embryonic stem cell-derived endothelial cells for treatment of myocardial infarction. PLoS One. 2009;4:e8443. doi: 10.1371/journal.pone.0008443. [DOI] [PMC free article] [PubMed] [Google Scholar]
- 32.Ludwig TE, et al. Derivation of human embryonic stem cells in defined conditions. Nat Biotechnol. 2006;24:185–187. doi: 10.1038/nbt1177. [DOI] [PubMed] [Google Scholar]