

Abstract
Background
Alcoholic liver disease progresses from steatosis to inflammation, fibrosis and cirrhosis. Although alcoholic liver disease has been associated with insulin resistance, it is unclear whether insulin resistance coincides with the development of steatosis.
Methods
We studied the temporal relationship of steatosis and glucose homeostasis in mice fed a Lieber-DeCarli liquid control or ethanol diet for 2, 4 or 8 weeks. We studied the effects of alcohol consumption on energy balance, body composition, and hepatic lipids. Glucose tolerance test was performed, and insulin sensitivity was evaluated with hyperinsulinemic-euglycemic clamp.
Results
Ethanol-fed mice developed hepatic steatosis over time as compared with control-fed mice despite similar energy intake and expenditure, and gain in body weight and fat. Ethanol-fed mice developed glucose intolerance as early as 2 weeks, while insulin resistance developed at 4 weeks. A hyperinsulinemic-clamp study at 8 weeks revealed both hepatic and peripheral insulin resistance in ethanol-fed mice. Insulin resistance was associated with hepatic steatosis, increased ceramide levels, and Perilipin 2 expression.
Conclusions
Chronic ethanol consumption leads to the development of hepatic steatosis, impaired glucose tolerance and insulin resistance. These changes are independent of energy intake or expenditure, weight, whole body fat content, and inflammation. A better understanding of the processes linking ethanol-induced steatosis and abnormal glucose homeostasis may lead to novel therapies targeting the progression of alcoholic liver disease.
Keywords: Alcoholic steatosis, insulin resistance, ceramides, Perilipin 2, metabolic phenotyping
INTRODUCTION
Alcoholic liver disease (ALD) is a major cause of liver failure worldwide, and its management costs billions of dollars annually (O’Shea et al., 2010; Services, 2000). Hepatic steatosis is an early pathologic feature of ALD, and may progress to steatohepatitis and fibrosis (Raynard et al., 2002). Insulin resistance is predictive of severity of ALD in humans (Wanless and Lentz, 1990). Experimental rat models have linked alcoholic steatohepatitis with impaired hepatic insulin signaling (Denucci et al., 2010; de la Monte et al., 2008; Sasaki et al., 1994), whereas administration of insulin sensitizers to alcohol-fed rats improves steatohepatitis (de la Monte et al., 2011; Xu et al., 2003). However, the temporal relationship of the development of ALD and alteration in glucose homeostasis is unclear. Indeed, several population studies have suggested a U-shaped relationship between alcohol consumption and development of insulin resistance (Kiechl et al., 1996; Shah, 1988).
Unlike rats, mice fed chronically with Lieber-DeCarli liquid ethanol diet develop steatosis without significant steatohepatitis (Liangpunsakul et al., 2012; Lieber and DeCarli, 1982). Mice fed a Lieber-DeCarli diet with 38% ethanol content for 8 weeks are insulin resistant, as determined by whole body insulin tolerance testing (Zhong et al., 2012). It was recently shown that mice fed a 27.5% ethanol caloric content for 4 weeks developed glucose intolerance; however, insulin sensitivity was not examined in this model (Liangpunsakul et al., 2012). The aim of the current study was to examine in greater detail the temporal relationship between alcoholic liver steatosis and glucose homeostasis. In addition, we performed comprehensive metabolic phenotyping of mice to determine whether energy balance was affected by alcohol consumption.
MATERIALS AND METHODS
Animals and diets
Experiments were performed according to protocols reviewed and approved by the Institutional Animal Care and Use Committee of the University of Pennsylvania. Ten week-old male C57BL/6J mice (Jackson Laboratory, Bar Harbor, ME) were housed under a 12:12-h light-dark cycle (light on at 0700) and ambient temperature of 22°C. Mice were fed a control Lieber-DeCarli diet containing 12% fat (corn oil, olive oil, and safflower oil), 70% carbohydrates (maltose-dextrin), and 18% protein, or an ethanol-containing diet in which ethanol was added to account for 15% of total calories, and the equivalent caloric amount of carbohydrates was removed. To allow for acclimation to the alcohol diet, the mice were given 5% ethanol calorie content for 2 days, which was increased to 10% ethanol calorie content for 2 days, followed by 15% ethanol calorie content diet.
Physiologic studies
Caloric intake was measured daily and body weight was measured twice weekly. Body composition was measured at 2, 4 and 8 weeks with nuclear magnetic resonance spectroscopy (Echo MRI, Houston, TX) (Carr et al., 2012). Indirect calorimetry was performed at 2 and 4 weeks with a Comprehensive Laboratory Animal Monitoring System (CLAMS) (Columbus Instruments), and locomotor activity was measured simultaneously using infrared beam breaks (Carr et al., 2012; Varela et al., 2008).
Glucose homeostasis
Glucose tolerance testing (GTT) was done at 2, 4 and 8 weeks. The mice were fasted for 6 hours (7 am-1 pm), intraperitoneal (I.P.) injection of a glucose solution (2g/kg) was given and glucose concentration in the tail blood was measured at time 0 (before I.P. glucose injection), and 15, 30, 60, and 90 minutes with a glucometer (One Touch Ultra, Johnson & Johnson) (Carr et al., 2012; Varela et al., 2008). Whole body insulin tolerance testing (ITT) was done at 4 weeks. The mice were fasted for 6 hours, and 0.75 U/kg insulin was injected I.P. Tail blood glucose was measured with a glucometer at time 0 (prior to insulin injection), and 15, 30, 60, 90 and 120 minutes (Imai et al., 2007).
Hyperinsulinemic-euglycemic clamp and radioisotopic tracer kinetic studies were done at 2 and 8 weeks to evaluate insulin sensitivity in the liver, adipose tissue and muscle (Varela et al., 2008). The mice were anesthetized and the right internal jugular vein was cannulated. After 4 days of recovery to the pre-surgery weight, the mice were fasted for 6 hours (7 am-1pm), a bolus intravenous injection of 5 μCi of [3-3H] glucose was administered, followed by continuous intravenous infusion at 0.05 μCi/min. Baseline glucose kinetics were measured for 120 minutes followed by hyperinsulinemic clamp for 120 minutes. A priming dose of regular insulin (16mU/kg, Humulin; Eli Lilly, Indianapolis, IN) was given intravenously, followed by a continuous infusion at 2.5 mU/kg/min. Blood glucose was maintained at 140 mg/dL via a variable infusion of 20% glucose. 2-Deoxy-D-[1-14C] glucose was injected 45 minutes before the end of the clamp, and blood samples were collected to estimate glucose uptake. The mice were euthanized, and liver, epidydimal white adipose tissue (WAT) and gastrocnemius muscle were excised, frozen immediately in liquid nitrogen, and stored at −80°C for analysis of glucose uptake (Varela et al., 2008).
Biochemical assays
Cohorts of ethanol or control-fed mice were euthanized at 12 noon-1 pm, and blood samples were obtained via cardiac puncture. Liver samples were rapidly dissected, frozen in liquid nitrogen, and stored at −80°C for analysis. Serum triglycerides and alanine aminotransferase (ALT) were measured by enzymatic assays (Carr et al., 2012). Serum insulin concentration was measured with an ELISA (Crystal Chem, Evanston, IL) (Carr et al., 2012).
Lipids were extracted from livers for triglyceride measurement as previously described (Carr et al., 2012; Varela et al., 2008). Other liver tissues were homogenized in Tris:EDTA and analyzed for ceramides by the Lipidomics Shared Resource at the Medical University of South Carolina (Mullen et al., 2011). mRNA was prepared from liver samples using Trizol reagent (Invitrogen, Carlsbad, CA), and expression of lipid droplet proteins, Perilipin 1, 2 and 3, was analyzed using real-time PCR reagents (Carr et al., 2012; Takahashi et al., 2004). The level of mRNA expression was normalized to phosphoriboprotein (36B4).
Total Akt and phosphorylated Akt (p-Akt) levels in liver were determined by immunoblotting (Goncalves et al., 2010). Liver samples were homogenized in lysis buffer containing 1% NP-40, 0.5% Triton, 10% glycerol, 0.15M NaCl, 0.001 M EDTA, 0.5M Tris-HCl, at pH 7.4, and supplemented with complete protein inhibition cocktail tablet from Roche (Penzberg, Germany). 30 μg protein extract were separated by 4–12% NuPage Bis-Tris gel (Invitrogen) and transferred to nitrocellulose overnight at 4°C using wet transfer. Membranes were blocked with 5% nonfat dried milk for 1 h at room temperature and then incubated with p-Akt Ser 473 antibody (Santa Cruz, #SC7985-R) at 1:1000 dilution overnight at 4°C. Membranes were washed with TBS with 0.1% (vol/vol) Tween 20, and incubated with 1:5000 dilution of goat anti-rabbit horseradish peroxidase antibody (Santa Cruz, #SC 2004) for 1 h at room temperature. Blots were visualized with enhanced chemiluminescence (GE Healthcare, Piscataway, NJ). Membranes were then stripped and blotted for total Akt (Santa Cruz, SC 8312) or GPDH (Cell Signaling, #14C10), at 1:1000 dilution. Film autoradiograms were analyzed with National Institutes of Health Image J software (Carr et al., 2012).
Histology
Liver tissue from the same hepatic lobe was excised from ethanol and control-fed mice, fixed in 10% buffered formalin, and stained with hematoxylin and eosin. Slides were examined and images captured under bright field with Olympus DP72 microscope BX43 and CellSens Entry imaging software. Liver histology was examined by a pathologist blinded to the experiments. Representative images from control (n=4) and ethanol-fed (n=5) mice were taken at 40x magnification for morphometric analysis of lipid droplets using Photoshop CS3 (Adobe), and histograms of lipid droplet size distribution were plotted (GraphPad Prism, La Jolla, CA).
STATISTICAL ANALYSIS
Data are expressed as means +/− SEM. Statistical analysis was performed using t test, or ANOVA with post hoc Newman Keuls test (GraphPad Prism, La Jolla, CA). P < 0.05 is considered significant.
RESULTS
Effects of ethanol consumption on energy balance and hepatic steatosis
Mice in the control or ethanol-fed groups gained 2, 3, and 7 grams after 2, 4 and 8 weeks, respectively (Table 1). Body composition measured by nuclear magnetic resonance spectroscopy showed that ethanol and control diets increased body fat by 50% after 8 weeks. However, there were no significant differences in the fat or lean masses between the control and ethanol groups at any time point (Table 1). The daily caloric intake was similar between the groups. Mice on ethanol or control diets consumed 14 kcal daily (Table 1). Energy expenditure was measured at 2 and 4 weeks during a 6 hour fast between 10am and 4pm. There was no difference in oxygen consumption (V̇o 2) between the control and ethanol groups (Table 1). The respiratory quotient (RQ = V̇ co2/V̇o 2) is an index of fuel oxidation. RQ value of 0.7 indicates fat oxidation, and RQ value of 1 indicates carbohydrate oxidation. The RQ value was 0.7 for ethanol and control diets at 2 weeks and 4 weeks, suggesting that fat oxidation was predominant in both control and ethanol groups. Locomotor activity level was also similar between ethanol and control groups at all ages (Table 1).
Table 1.
Metabolic phenotyping and chemistries of mice fed control or ethanol diets for two, four or eight weeks
Data are reported as means ± SEM and compared by t test; n = 10/group. P<0.05 is considered significant.
| Metabolic parameters | 2 wks | 4 wks | 8 wks | ||||||
|---|---|---|---|---|---|---|---|---|---|
| CTRL | ETOH | P | CTRL | ETOH | P | CTRL | ETOH | P | |
| Body weight (g) | 27.3 ± 0.5 | 26.4 ± 0.4 | 0.19 | 27.1 ± 0.7 | 26.8 ± 0.5 | 0.73 | 32.3 ± 1.1 | 31.0 ± 0.6 | 0.26 |
| Energy intake (kcal/mouse/day) | 13.9 ± 0.1 | 13.8 ± 0.4 | 0.73 | 13.5 ±0.1 | 13.5 ±0.1 | 0.83 | 14 ± 0.1 | 14.0 ± 0.2 | 0.89 |
| Activity (counts) | 8570 ±28 | 9415 ±1225 | 0.79 | 8125 ± 533.4 | 6739 ±1572 | 0.43 | ---- | ---- | ---- |
| V̇o2 (mL/h) | 82.1 ± 6.1 | 83.9 ± 6.4 | 0.84 | 89.1 ± 7.0 | 85.4 ± 7.2 | 0.72 | ---- | ---- | ---- |
| RQ | 0.71 ± 0.002 | 0.71 ± 0.003 | 0.55 | 0.71 ± .004 | 0.72 ± 0.005 | 0.37 | ---- | ---- | ---- |
| %Fat | 12.2 ±2.7 | 12.7 ±1.6 | 0.88 | 13.1 ±0.7 | 10.3 ±2.1 | 0.20 | 18.3 ±1.9 | 19.8 ± 2.2 | 0.62 |
| %Lean | 86.3 ±2.6 | 85.2 ±1.5 | 0.71 | 83.5 ±1.3 | 88.4 ±2.3 | 0.10 | 81.4 ±1.5 | 78.9 ± 2.1 | 0.35 |
| Chemistries | |||||||||
| Blood glucose (mg/dL) | 145 ±7.6 | 136 ±7.9 | 0.44 | 149 ±4.0 | 152 ±5.1 | 0.60 | 126 ±15.9 | 164 ±21.0 | 0.19 |
| Serum insulin (ng/mL) | 0.81 ±0.1 | 0.57 ±0.2 | 0.27 | 0.77 ±0.2 | 1.27 ±0.2 | 0.14 | 1.97 ±0.5 | 1.27 ±0.2 | 0.16 |
| Serum ALT (IU/L) | 15 ±3.3 | 12 ±1.5 | 0.47 | 16 ±1.2 | 17 ±1.0 | 0.42 | 9 ±3.7 | 13 ±3.3 | 0.46 |
| Serum TG (mg/dL) | 87 ±6.0 | 95 ±1.9 | 0.27 | 93 ±3.7 | 94.52 ±7.4 | 0.82 | 70 ± 5.4 | 78 ±6.0 | 0.34 |
| Liver TG (mg/g tissue) | 40 ±7.0 | 29 ±6.4 | 0.31 | 34 ±5.5 | 59 ±9.0 | 0.04 | 62 ±2.9 | 76 ±25.3 | 0.65 |
CTRL= control-fed mice; ETOH= ethanol-fed mice; Vo 2= oxygen consumption; RQ=Respiratory quotient; ALT=alanine aminotransferase TG=triglyceride.
In contrast to the similarities in energy balance, liver histology revealed a temporal increase in hepatic steatosis in ethanol-fed mice compared with control-fed mice (Fig. 1). The hematoxylin and eosin-stained liver sections showed well defined vacuolated areas in the hepatocytes in ethanol-fed mice at 8 weeks. There was no apparent evidence of inflammation or necrosis (Fig. 1). Biochemical measurement showed an increase in liver triglyceride content in the ethanol-fed mice compared with control mice at 8 weeks; however, the values were highly variable and not statistically different (Table 1). We further assessed steatosis by comparing lipid droplet size distributions in histological sections from control and ethanol-fed mice (Fig. 2). Lipid droplet diameter ranged from 1.64 to 20.6 μm with mean diameter of 4.84 μm in control mice, and a range of 1.64 to 66.4 μm with mean diameter of 14.5 μm in ethanol-fed mice (P<0.0001) (Fig. 2). Ethanol-induced hepatic steatosis was not associated with an increase of ALT levels (Table 1).
Fig. 1. Liver histology of mice fed control or ethanol diets for two, four or eight weeks.

Representative hematoxylin and eosin stained liver sections. 40x magnification. Scale bar is 50 μm.
Fig. 2. Distribution of hepatic lipid droplet size in mice fed control or ethanol diets for eight weeks.

The histograms show diameters of lipid droplets in control (n=5) (CTRL) and ethanol-fed (ETOH) (n=5) livers. *P<0.0001 vs. control.
Chronic ethanol consumption results in glucose intolerance and insulin resistance
Mice fed the ethanol diet developed glucose intolerance as early as 2 weeks (Fig. 3A), and this persisted through 4 and 8 weeks (Fig. 3B–C). There was no significant difference in the serum insulin levels between the control and ethanol-fed mice at 2, 4 and 8 weeks (Table 1). A hyperinsulinemic-euglycemic clamp study was done at 2 weeks to determine whether insulin resistance was apparent at this early stage of ethanol feeding. Glucose production under basal (fasted) conditions was similar between the control and ethanol-fed mice (Fig. 4A). Moreover, 2 weeks of ethanol feeding did not affect the glucose infusion rate (GIR), hepatic glucose production (HGP), or glucose disposal rate (Rd) under hyperinsulinemic-euglycemic clamp (Fig. 4B–D). Thus, hepatic and peripheral insulin sensitivity were not significantly altered at 2 weeks on the ethanol diet. At 4 weeks of ethanol feeding, however, our screening of whole body insulin sensitivity with a bolus I.P. injection of insulin showed insulin resistance in the ethanol-fed mice (Fig. 4E). Because the degree of glucose intolerance was similar at 4 and 8 weeks, we performed a hyperinsulinemic-euglycemic clamp at 8 weeks to evaluate the changes in hepatic and peripheral insulin sensitivity. Unlike the 2 week ethanol-fed mice, ethanol consumption for 8 weeks resulted in a 50% reduction in GIR (P=0.003); 57% increase in HGP (P<0.017), and a 40% reduction in Rd (P<0.002) (Fig. 5A–D). These changes demonstrate that 8 weeks of ethanol feeding induces both hepatic and peripheral insulin resistance. Ethanol consumption for 8 weeks resulted in non-significant decreases of glucose uptake into skeletal muscle (Fig. 5E; P=0.15), and adipose tissue (Fig. 5F; P=0.11). Immunoblotting of total Akt and phosphorylated Akt was performed on liver samples from mice fed a control or ethanol diet for 8 weeks. Total Akt levels were similar in the control and ethanol-fed mice while p-Akt levels were reduced by 50% in ethanol-fed mice (Fig. 6A, B).
Fig. 3. Glucose tolerance testing.
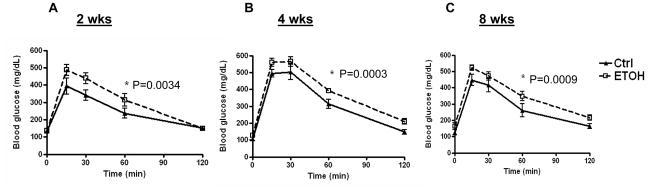
Glucose tolerance testing of mice fed control (Ctrl) or ethanol (ETOH) diets for (A) two, (B) four or (C) eight weeks. Data are means ± SEM. N=5/group/time period. *P<0.05 is considered significant. ANOVA at 2 weeks: Treatment P=0.0034, Time P<0.0001; ANOVA at 4 weeks: Treatment P=0.0003, Time P<0.0001; ANOVA at 8 weeks: Treatment P=0.0009, Time P<0.0001.
Fig. 4. Effects of control or ethanol diets on insulin sensitivity as measured by hyperinsulinemic-euglycemic clamp at two weeks, and insulin tolerance test at four weeks.

(A) Basal hepatic glucose production (HGP); (B) clamp glucose infusion rate (GIR); (C) clamp HGP; (D) rate of glucose disposal (Rd); (E) insulin tolerance test (ITT) at 4 weeks. Data are means ± SEM; N=5. *P<0.05 is significant. For Fig. 4E ANOVA: Treatment and Time P<0.0001. CTRL=Control-fed; ETOH= ethanol-fed.
Fig. 5. Hyperinsulinemic-euglycemic clamp of mice on control or ethanol diets for eight weeks.

A) Basal hepatic glucose production (HGP); (B) clamp glucose infusion rate (GIR); (C) clamp HGP; (D) rate of glucose disposal (Rd); (E) Muscle glucose uptake; (F) Adipose glucose uptake. Data are means ± SEM. N=5. *P<0.05 is considered significant. CTRL=Control-fed; ETOH= ethanol-fed.
Fig. 6. Effects of alcohol on hepatic Akt and p-Akt levels.

A) Immunoblots of total Akt, p-Akt, and GPDH of liver lysates of mice fed control or ethanol diets for 8 weeks. B) Quantification of protein levels normalized to GPDH. Data are means ± SEM. *P=0.0017 vs. control. CTRL=Control-fed; ETOH= ethanol-fed; GPDH= glycerol-3-phosphate dehydrogenase.
Effects of ethanol consumption on lipid droplet proteins and ceramide levels
Lipid droplets in the liver and other organs are surrounded by a phospholipid monolayer and a family of perilipin (Plin) proteins (Bickel et al., 2009). Plin1, 2 and 3 have been described in ALD in rodents and humans (Mak et al., 2008; Orlicky et al., 2011). We have previously shown that Plin2 and Plin3 are increased in livers of diet-induced and ob/ob mice, and mediate hepatic insulin resistance (Carr et al., 2012; Imai et al., 2007; Varela et al., 2008). Thus, we determined whether Plin proteins were affected by alcohol consumption. We found that Plin2 was increased significantly in ethanol-fed mice at 4 weeks (P=0.002), Plin3 was detectable but not increased, and Plin1 was barely detectable (Table 2).
Table 2.
Lipid droplet protein expression and hepatic ceramide content of control-fed and ethanol-fed mice at four weeks
Data are reported as means ± SEM; n=5/group. P<0.05 is considered significant.
| CTRL | ETOH | P | |
|---|---|---|---|
| Lipid droplet protein mRNA expression | |||
| Plin1 | 0.03 ± 0.01 | 0.02 ± 0.01 | 0.26 |
| Plin2 | 112.0 ± 13.2 | 201.0 ± 21.2 | 0.002 |
| Plin3 | 9.39 ± 1.0 | 9.58 ± 0.9 | 0.89 |
| Hepatic ceramides (pmole/sample) | |||
| C14 | 1.40 ± 0.3 | 1.54 ± 0.3 | 0.72 |
| C16 | 21.24 ± 2.8 | 18.96 ± 2.2 | 0.54 |
| C18 | 3.90 ± 0.6 | 8.42 ± 1.1 | 0.006 |
| C18:1 | 0.56 ± 0.1 | 0.90 ± 0.1 | 0.02 |
| C20 | 25.04 ± 3.3 | 33.74 ± 3.3 | 0.10 |
| C20:1 | 1.84 ± 0.1 | 2.42 ± 0.3 | 0.06 |
| C22 | 33.42 ± 1.6 | 38.78 ± 2.7 | 0.13 |
| C22:1 | 10.12 ± 0.5 | 13.16 ± 0.9 | 0.02 |
| C24 | 30.10 ± 1.8 | 35.22 ± 2.4 | 0.12 |
| C24:1 | 54.94 ± 3.0 | 74.46 ± 2.6 | 0.001 |
| C26 | 0.12 ± 0.02 | 0.1 ± 0 | 0.35 |
| C26:1 | 0.08 ± 0.04 | 0.16 ± 0.02 | 0.11 |
CTRL= control-fed mice; ETOH= ethanol-fed mice; Plin1= Perilipin 1; Plin2= Perilipin 2; Plin3= Perilipin 3. Expression of Plin1, 2 and 3 was normalized to 36B4 (phosphoriboprotein).
Sphingomyelin, a precursor of ceramide, is a component of the lipid droplet membrane (McIntosh et al., 2010). Ceramides can disrupt insulin signaling and have been implicated in the pathogenesis of ALD (Deaciuc et al., 2000; Liangpunsakul et al., 2010; 2012). Therefore, we measured hepatic ceramides in ethanol and control-fed mice at 4 weeks to determine if insulin resistance at this stage correlated with an increase in ceramides. Some ceramide species, i.e. C18, C18:1, C22:1, and C24:1, were increased in the ethanol-fed mice compared with control mice, while other ceramide species, i.e. C14, C16, C20, C22, C24, C26, were not affected by ethanol consumption (Table 2).
DISCUSSION
Alcoholic liver disease (ALD) spans the histologic spectrum of steatosis, steatohepatitis, cirrhosis, and hepatocellular carcinoma, and is a leading cause of liver-related morbidity and mortality worldwide (O’Shea et al., 2010; Services, 2000; Singal, 2010). Besides continued alcohol consumption, there are few predictors of disease progression in ALD (National Institute on Alcohol Abuse and Alcoholism (U.S.), 2005). Insulin resistance is strongly associated with liver disease severity in ALD (Quintana et al., 2011; Raynard et al., 2002).
Both human and rodent studies have demonstrated impaired glucose tolerance and insulin sensitivity in ALD. In humans, alcoholic cirrhosis leads to impaired responses to intravenous glucose and insulin (Magnusson and Tranberg, 1987). Additionally, insulin resistance predicts liver fibrosis in ALD (Raynard et al., 2002). Consistent with these human studies, rodent studies demonstrate a reduction in expression of key insulin signaling molecules in experimental models of ALD (de la Monte et al., 2008; Sasaki et al., 1994). For example, Long-Evans rats chronically fed ethanol develop steatosis, inflammation and apoptosis associated with impaired insulin receptor binding, and increased expression of IGF-1 (de la Monte et al., 2008). Chronically-ethanol fed rats develop impaired IRS-1 phosphorylation following partial hepatectomy (Sasaki et al., 1994). Moreover, administration of PPARδ agonist or adiponectin, which enhance insulin sensitivity, ameliorates ALD in rats and mice (de la Monte et al., 2011; Xu et al., 2003). In contrast, some studies have reported that low or moderate chronic alcohol consumption improved insulin sensitivity (Kiechl et al., 1996; Koppes et al., 2005). This raises the possibility of a temporal relationship between the development of ALD and changes in glucose homeostasis.
The Lieber-DeCarli liquid ethanol diet pair feeding mouse model is a well established model of alcoholic steatosis (Lieber and DeCarli, 1982). Unlike rats, mice fed this diet do not develop significant inflammation and fibrosis (Denucci et al., 2010; Liangpunsakul et al., 2012; Lieber and DeCarli, 1982). Nonetheless, the Lieber-DeCarli diet is a useful model for examining the effects of alcohol-induced steatosis on glucose homeostasis. To our knowledge, there are only two recent studies demonstrating impaired glucose tolerance or insulin resistance in mice chronically fed the Lieber-DeCarli alcohol diet. In an examination of the role of ceramide inhibition in ALD, mice chronically fed ethanol had impaired glucose tolerance compared with pair-fed controls (Liangpunsakul et al., 2012). However, it is unclear if the difference in glucose tolerance was due to changes in body weight. The impact of ethanol consumption on insulin sensitivity was not studied. A subsequent study examining the role of ethanol on adipose tissue lipolysis in mice fed 38% calorie-content ethanol for 8 weeks demonstrated insulin resistance by insulin tolerance test despite a significant loss of fat mass in ethanol-fed mice (Zhong et al., 2012). The majority of studies examining the development of insulin resistance in alcoholic liver disease were performed in rats, in which hepatic inflammation may be a contributing factor (Kang et al., 2007; Shoelson et al., 2007; Wan et al., 2005).
In the current study, we carefully characterized the temporal effects of ethanol consumption on energy balance, glucose tolerance, and insulin sensitivity. We found that while glucose intolerance was detected as early as 2 weeks and persisted throughout 8 weeks duration of our studies, insulin resistance was not apparent until 4 weeks on the alcohol diet. It is possible the early occurrence of impaired glucose tolerance in ethanol-fed mice is partly due to changes in counterregulatory hormones, e.g. glucagon. The changes in glucose homeostasis in ethanol-fed mice were independent of energy intake and expenditure, and total body fat. It is important to point out that our indirect calorimetry was done during a 6 hour fast, hence the V̇o 2 and RQ values in the control and ethanol-fed mice reflect energy expenditure and fuel oxidation in the fasted state. It is possible alcohol may have different effects on energy expenditure and fuel oxidation in the fed state. Alcohol has been shown to promote hepatic steatosis by inhibiting fatty acid oxidation and increasing lipogenesis. Alcohol inhibits activation of AMPK (You et al., 2004), which normally inhibits the lipogenic enzyme acetyl-CoA carboxylase (ACC) and indirectly activates the beta-oxidation enzyme carnitine palmitoyltransferase I (CPTI) (Liu et al., 2011; Long and Zierath, 2006). Indeed, we found reduced AMPK levels in the livers of ethanol-fed mice (data not shown).
Our clamp results showed that hepatic insulin resistance was increased in ethanol-fed mice at 8 weeks compared with control mice. Consistent with these data, p-Akt levels were significantly reduced in ethanol-fed mice. The glucose disposal rate during hyperinsulinemic clamp was significantly attenuated in ethanol-fed mice, suggesting peripheral insulin resistance. There was a tendency toward impaired glucose uptake in perigonadal adipose tissue and gastrocnemius muscle in alcohol fed mice, but the difference was not significant. Wan et al. reported an impairment of muscle insulin sensitivity in Wistar rats fed alcohol via intragastric pump (Wan et al., 2005). The difference between the two studies may be partly due to the duration of alcohol feeding, i.e. 8 weeks in our study in mice compared with 20 weeks in rats (Wan et al., 2005). Glucose disposal rate (Rd) reflects glucose uptake of all tissues that utilize insulin. Our measurement of glucose uptake was limited to perigonadal adipose tissue and gastrocnemius muscle. Future studies will determine the specific effects of alcohol on insulin-mediated glucose uptake in various adipose tissue depots and skeletal muscle groups.
Several studies have associated the accumulation of lipid species with disruption of hepatic insulin signaling (Carr et al., 2012; Imai et al., 2007; Samuel et al., 2010; Varela et al., 2008). In the current study, we found that hepatic triglycerides and several ceramide species were increased at the onset of insulin resistance in alcoholic steatosis. Triglycerides do not impair insulin signaling (Erion and Shulman, 2010; Nagle et al., 2009), however, ceramides and other lipid metabolites have been implicated in the pathogenesis of hepatic insulin resistance (Dobrowsky et al., 1993; Erion and Shulman, 2010; Hannun and Obeid, 2008; Summers, 2006; Yang et al., 2009). A mechanism by which hepatic ceramides impair insulin signaling is through the activation of protein phosphatase 2A and subsequent inhibition of Akt phosphorylation (Dobrowsky et al., 1993; Hannun and Obeid, 2008). Hepatic ceramides are increased in experimental models of ALD, and pharmacologic reduction of hepatic ceramides correlates with histologic improvement of ALD (Deaciuc et al., 2000; Liangpunsakul et al., 2010; 2012, Zhao et al., 2011). Our findings are consistent with studies showing an increase in hepatic ceramides after 4 weeks of ethanol feeding in mice (Liangpunsakul et al., 2010; 2012; Zhao et al., 2011). Specifically, we observed an increase in the ceramide species C18, C18:1, C22:1, and C24:1. Consistent with the present study, C18 ceramide was increased in a metabolomic study of ethanol feeding (Zhao et al., 2011). A recent study demonstrated that pharmacologic reduction of C24 ceramide was associated with improvement of alcoholic steatosis (Liangpunsakul et al., 2012), but we did not observe an increase in C24 in our study. In general, the specific biological roles of ceramide species are poorly understood, and their effects in ALD have yet to be examined (Grosch et al., 2012; Hannun and Obeid, 2011).
We have previously reported that Plin2 and Plin3 are both involved in the pathogenesis of hepatic insulin resistance in non-alcoholic fatty liver disease (Carr et al., 2012; Chang et al., 2006; Imai et al., 2007; Motomura et al., 2006; Varela et al., 2008). In the current study, we demonstrated a two-fold increase in hepatic Plin2 expression in ethanol-fed mice compared with control mice. Our results are consistent with prior studies demonstrating an increased expression of Plin2 in rodent models of ALD (Mak et al., 2008; Orlicky et al., 2011). However, unlike a previous report (Orlicky et al., 2011), Plin1 expression was barely detectable in our samples, while Plin3 was detectable but not increased in ethanol-fed mice. The difference in these results may be due to the fat content of the diet, i.e. 45% fat in the experiments of Orlicky, et al. compared with 12% fat content of our diet (Straub et al., 2008). Plin2-mediated lipid droplet biogenesis may be involved mechanistically in ceramide metabolism and insulin sensitivity in alcoholic steatosis. Plin2 binds with high affinity to sphingomyelin on the surface of the lipid droplet (McIntosh et al., 2010), and the production of ceramide from sphingomyelin hydrolysis is implicated in alcohol’s impairment of glucose homeostasis (Liangpunsakul et al., 2012). Further studies will determine whether there is a causal relationship between Plin2 upregulation, ceramide metabolism and impaired insulin signaling in ALD.
In summary, we have demonstrated a temporal relationship of impaired glucose tolerance, insulin resistance and alcohol-induced steatosis in mice. The changes in glucose homeostasis at this early stage of alcohol-induced steatosis are independent of body weight, fat mass, energy intake or expenditure. Additionally, we observed an increased expression of the lipid droplet protein, Plin2, and hepatic ceramide species with the onset of insulin resistance in alcohol fed mice. Further studies are needed to determine the specific roles of Plin2 and ceramides in the development of insulin resistance in alcoholic steatosis. A better understanding of these processes may lead to novel diagnostic and therapeutic strategies for early liver disease in patients unable to achieve abstinence from alcohol.
Acknowledgments
Financial support
This project was supported by National Institutes of Health Grant P01-DK-049210 (to R. S. Ahima), Diabetes Research Center Mouse Metabolic Phenotyping Core (Grant P30-DK-19525); and the Center for Molecular Studies of Digestive and Liver Disease Morphology Core (Grant P30-DK-50306). R. M. Carr was supported by National Institutes of Health Training Grant T32-DK-007066. This project was additionally supported by the National Center for Research Resources and the Office of the Director of the National Institutes of Health through Grant Number C06 RR018823. Liver ceramides were measured by the Lipidomics Shared Resource, Hollings Cancer Center, Medical University of South Carolina (P30 CA138313), and the Lipidomics Core in the SC Lipidomics and Pathobiology COBRE (P20 RR017677).
Footnotes
Conflict of interest
There are no conflicts of interest for any of the authors.
References
- Bickel PE, Tansey JT, Welte MA. PAT proteins, an ancient family of lipid droplet proteins that regulate cellular lipid stores. Biochim Biophys Acta. 2009;1791:419–440. doi: 10.1016/j.bbalip.2009.04.002. [DOI] [PMC free article] [PubMed] [Google Scholar]
- Carr RM, Patel RT, Rao V, Dhir R, Graham MJ, Crooke RM, Ahima RS. Reduction of TIP47 improves hepatic steatosis and glucose homeostasis in mice. Am J Physiol Regul Integr Comp Physiol. 2012;302:R996–1003. doi: 10.1152/ajpregu.00177.2011. [DOI] [PMC free article] [PubMed] [Google Scholar]
- Chang BH, Li L, Paul A, Taniguchi S, Nannegari V, Heird WC, Chan L. Protection against fatty liver but normal adipogenesis in mice lacking adipose differentiation-related protein. Mol Cell Biol. 2006;26:1063–1076. doi: 10.1128/MCB.26.3.1063-1076.2006. [DOI] [PMC free article] [PubMed] [Google Scholar]
- de la Monte SM, Pang M, Chaudhry R, Duan K, Longato L, Carter J, Ouh J, Wands JR. Peroxisome proliferator-activated receptor agonist treatment of alcohol-induced hepatic insulin resistance. Hepatol Res. 2011;41:386–398. doi: 10.1111/j.1872-034X.2011.00775.x. [DOI] [PMC free article] [PubMed] [Google Scholar]
- de la Monte SM, Yeon JE, Tong M, Longato L, Chaudhry R, Pang MY, Duan K, Wands JR. Insulin resistance in experimental alcohol-induced liver disease. J Gastroenterol Hepatol. 2008;23:e477–486. doi: 10.1111/j.1440-1746.2008.05339.x. [DOI] [PMC free article] [PubMed] [Google Scholar]
- Deaciuc IV, Nikolova-Karakashian M, Fortunato F, Lee EY, Hill DB, McClain CJ. Apoptosis and dysregulated ceramide metabolism in a murine model of alcohol-enhanced lipopolysaccharide hepatotoxicity. Alcohol Clin Exp Res. 2000;24:1557–1565. [PubMed] [Google Scholar]
- Denucci SM, Tong M, Longato L, Lawton M, Setshedi M, Carlson RI, Wands JR, de la Monte SM. Rat strain differences in susceptibility to alcohol-induced chronic liver injury and hepatic insulin resistance. Gastroenterol Res Pract. 2010;2010 doi: 10.1155/2010/312790. [DOI] [PMC free article] [PubMed] [Google Scholar]
- Dobrowsky RT, Kamibayashi C, Mumby MC, Hannun YA. Ceramide activates heterotrimeric protein phosphatase 2A. The Journal of Biological Chemistry. 1993;268:15523–15530. [PubMed] [Google Scholar]
- Erion DM, Shulman GI. Diacylglycerol-mediated insulin resistance. Nature Medicine. 2010;16:400–402. doi: 10.1038/nm0410-400. [DOI] [PMC free article] [PubMed] [Google Scholar]
- Goncalves MD, Pistilli EE, Balduzzi A, Birnbaum MJ, Lachey J, Khurana TS, Ahima RS. Akt deficiency attenuates muscle size and function but not the response to ActRIIB inhibition. PLoS One. 2010;5:e12707. doi: 10.1371/journal.pone.0012707. [DOI] [PMC free article] [PubMed] [Google Scholar]
- Grosch S, Schiffmann S, Geisslinger G. Chain length-specific properties of ceramides. Prog Lipid Res. 2012;51:50–62. doi: 10.1016/j.plipres.2011.11.001. [DOI] [PubMed] [Google Scholar]
- Hannun YA, Obeid LM. Principles of bioactive lipid signalling: lessons from sphingolipids. Nat Rev Mol Cell Biol. 2008;9:139–150. doi: 10.1038/nrm2329. [DOI] [PubMed] [Google Scholar]
- Hannun YA, Obeid LM. Many ceramides. The Journal of Biological Chemistry. 2011;286:27855–27862. doi: 10.1074/jbc.R111.254359. [DOI] [PMC free article] [PubMed] [Google Scholar]
- Imai Y, Varela GM, Jackson MB, Graham MJ, Crooke RM, Ahima RS. Reduction of hepatosteatosis and lipid levels by an adipose differentiation-related protein antisense oligonucleotide. Gastroenterology. 2007;132:1947–1954. doi: 10.1053/j.gastro.2007.02.046. [DOI] [PubMed] [Google Scholar]
- Kang L, Chen X, Sebastian BM, Pratt BT, Bederman IR, Alexander JC, Previs SF, Nagy LE. Chronic ethanol and triglyceride turnover in white adipose tissue in rats: inhibition of the anti-lipolytic action of insulin after chronic ethanol contributes to increased triglyceride degradation. The Journal of Biological Chemistry. 2007;282:28465–28473. doi: 10.1074/jbc.M705503200. [DOI] [PubMed] [Google Scholar]
- Kiechl S, Willeit J, Poewe W, Egger G, Oberhollenzer F, Muggeo M, Bonora E. Insulin sensitivity and regular alcohol consumption: large, prospective, cross sectional population study (Bruneck study) BMJ. 1996;313:1040–1044. doi: 10.1136/bmj.313.7064.1040. [DOI] [PMC free article] [PubMed] [Google Scholar]
- Koppes LL, Dekker JM, Hendriks HF, Bouter LM, Heine RJ. Moderate alcohol consumption lowers the risk of type 2 diabetes: a meta-analysis of prospective observational studies. Diabetes Care. 2005;28:719–725. doi: 10.2337/diacare.28.3.719. [DOI] [PubMed] [Google Scholar]
- Liangpunsakul S, Rahmini Y, Ross RA, Zhao Z, Xu Y, Crabb DW. Imipramine blocks ethanol-induced ASMase activation, ceramide generation, and PP2A activation, and ameliorates hepatic steatosis in ethanol-fed mice. American journal of physiology. Gastrointestinal and liver physiology. 2012;302:G515–523. doi: 10.1152/ajpgi.00455.2011. [DOI] [PMC free article] [PubMed] [Google Scholar]
- Liangpunsakul S, Sozio MS, Shin E, Zhao Z, Xu Y, Ross RA, Zeng Y, Crabb DW. Inhibitory effect of ethanol on AMPK phosphorylation is mediated in part through elevated ceramide levels. American journal of physiology. Gastrointestinal and liver physiology. 2010;298:G1004–1012. doi: 10.1152/ajpgi.00482.2009. [DOI] [PMC free article] [PubMed] [Google Scholar]
- Lieber CS, DeCarli LM. The feeding of alcohol in liquid diets: two decades of applications and 1982 update. Alcohol Clin Exp Res. 1982;6:523–531. doi: 10.1111/j.1530-0277.1982.tb05017.x. [DOI] [PubMed] [Google Scholar]
- Liu JF, Ma Y, Wang Y, Du ZY, Shen JK, Peng HL. Reduction of lipid accumulation in HepG2 cells by luteolin is associated with activation of AMPK and mitigation of oxidative stress. Phytother Res. 2011;25:588–596. doi: 10.1002/ptr.3305. [DOI] [PubMed] [Google Scholar]
- Long YC, Zierath JR. AMP-activated protein kinase signaling in metabolic regulation. J Clin Invest. 2006;116:1776–1783. doi: 10.1172/JCI29044. [DOI] [PMC free article] [PubMed] [Google Scholar]
- Magnusson J, Tranberg KG. Impaired early insulin response to intravenous glucose in alcoholic liver cirrhosis. Scand J Gastroenterol. 1987;22:301–307. doi: 10.3109/00365528709078595. [DOI] [PubMed] [Google Scholar]
- Mak KM, Ren C, Ponomarenko A, Cao Q, Lieber CS. Adipose differentiation-related protein is a reliable lipid droplet marker in alcoholic fatty liver of rats. Alcohol Clin Exp Res. 2008;32:683–689. doi: 10.1111/j.1530-0277.2008.00624.x. [DOI] [PubMed] [Google Scholar]
- McIntosh AL, Storey SM, Atshaves BP. Intracellular lipid droplets contain dynamic pools of sphingomyelin: ADRP binds phospholipids with high affinity. Lipids. 2010;45:465–477. doi: 10.1007/s11745-010-3424-1. [DOI] [PMC free article] [PubMed] [Google Scholar]
- Motomura W, Inoue M, Ohtake T, Takahashi N, Nagamine M, Tanno S, Kohgo Y, Okumura T. Up-regulation of ADRP in fatty liver in human and liver steatosis in mice fed with high fat diet. Biochem Biophys Res Commun. 2006;340:1111–1118. doi: 10.1016/j.bbrc.2005.12.121. [DOI] [PubMed] [Google Scholar]
- Mullen TD, Jenkins RW, Clarke CJ, Bielawski J, Hannun YA, Obeid LM. Ceramide synthase-dependent ceramide generation and programmed cell death: involvement of salvage pathway in regulating postmitochondrial events. The Journal of biological chemistry. 2011;286:15929–15942. doi: 10.1074/jbc.M111.230870. [DOI] [PMC free article] [PubMed] [Google Scholar]
- Nagle CA, Klett EL, Coleman RA. Hepatic triacylglycerol accumulation and insulin resistance. Journal of lipid research. 2009;50(Suppl):S74–79. doi: 10.1194/jlr.R800053-JLR200. [DOI] [PMC free article] [PubMed] [Google Scholar]
- National Institute on Alcohol Abuse and Alcoholism (U.S.) Alcohol alert. Available. [Google Scholar]
- O’Shea RS, Dasarathy S, McCullough AJ. Alcoholic liver disease. Hepatology. 2010;51:307–328. doi: 10.1002/hep.23258. [DOI] [PubMed] [Google Scholar]
- Orlicky DJ, Roede JR, Bales E, Greenwood C, Greenberg A, Petersen D, McManaman JL. Chronic ethanol consumption in mice alters hepatocyte lipid droplet properties. Alcohol Clin Exp Res. 2011;35:1020–1033. doi: 10.1111/j.1530-0277.2011.01434.x. [DOI] [PMC free article] [PubMed] [Google Scholar]
- Quintana JO, Garcia-Compean D, Gonzalez JA, Perez JZ, Gonzalez FJ, Espinosa LE, Hernandez PL, Cabello ER, Villarreal ER, Rendon RF, Garza HM. The impact of diabetes mellitus in mortality of patients with compensated liver cirrhosis-a prospective study. Annals of hepatology: official journal of the Mexican Association of Hepatology. 2011;10:56–62. [PubMed] [Google Scholar]
- Raynard B, Balian A, Fallik D, Capron F, Bedossa P, Chaput JC, Naveau S. Risk factors of fibrosis in alcohol-induced liver disease. Hepatology. 2002;35:635–638. doi: 10.1053/jhep.2002.31782. [DOI] [PubMed] [Google Scholar]
- Samuel VT, Petersen KF, Shulman GI. Lipid-induced insulin resistance: unravelling the mechanism. Lancet. 2010;375:2267–2277. doi: 10.1016/S0140-6736(10)60408-4. [DOI] [PMC free article] [PubMed] [Google Scholar]
- Sasaki Y, Hayashi N, Ito T, Fusamoto H, Kamada T, Wands JR. Influence of ethanol on insulin receptor substrate-1-mediated signal transduction during rat liver regeneration. Alcohol Alcohol Suppl. 1994;29:99–106. [PubMed] [Google Scholar]
- Services UDoHaH. The Economic Costs of Alcohol Abuse. 10th Special Report to the US Congress on Alcohol and Health: Highlights from Current Research; 2000. pp. 364–372. [Google Scholar]
- Shah JH. Alcohol decreases insulin sensitivity in healthy subjects. Alcohol Alcohol Suppl. 1988;23:103–109. [PubMed] [Google Scholar]
- Shoelson SE, Herrero L, Naaz A. Obesity, inflammation, and insulin resistance. Gastroenterology. 2007;132:2169–2180. doi: 10.1053/j.gastro.2007.03.059. [DOI] [PubMed] [Google Scholar]
- Singal AK. Comments on AASLD practice guidelines for alcoholic liver disease. Hepatology. 2010;51:1860–1861. doi: 10.1002/hep.23605. author reply 1861. [DOI] [PubMed] [Google Scholar]
- Straub BK, Stoeffel P, Heid H, Zimbelmann R, Schirmacher P. Differential pattern of lipid droplet-associated proteins and de novo perilipin expression in hepatocyte steatogenesis. Hepatology. 2008;47:1936–1946. doi: 10.1002/hep.22268. [DOI] [PubMed] [Google Scholar]
- Summers SA. Ceramides in insulin resistance and lipotoxicity. Prog Lipid Res. 2006;45:42–72. doi: 10.1016/j.plipres.2005.11.002. [DOI] [PubMed] [Google Scholar]
- Takahashi N, Qi Y, Patel HR, Ahima RS. A novel aminosterol reverses diabetes and fatty liver disease in obese mice. Journal of hepatology. 2004;41:391–398. doi: 10.1016/j.jhep.2004.05.006. [DOI] [PubMed] [Google Scholar]
- Varela GM, Antwi DA, Dhir R, Yin X, Singhal NS, Graham MJ, Crooke RM, Ahima RS. Inhibition of ADRP prevents diet-induced insulin resistance. Am J Physiol Gastrointest Liver Physiol. 2008;295:G621–628. doi: 10.1152/ajpgi.90204.2008. [DOI] [PMC free article] [PubMed] [Google Scholar]
- Wan Q, Liu Y, Guan Q, Gao L, Lee KO, Zhao J. Ethanol feeding impairs insulin-stimulated glucose uptake in isolated rat skeletal muscle: role of Gs alpha and cAMP. Alcohol Clin Exp Res. 2005;29:1450–1456. doi: 10.1097/01.alc.0000174768.78427.f6. [DOI] [PubMed] [Google Scholar]
- Wanless IR, Lentz JS. Fatty liver hepatitis (steatohepatitis) and obesity: an autopsy study with analysis of risk factors. Hepatology. 1990;12:1106–1110. doi: 10.1002/hep.1840120505. [DOI] [PubMed] [Google Scholar]
- Xu A, Wang Y, Keshaw H, Xu LY, Lam KS, Cooper GJ. The fat-derived hormone adiponectin alleviates alcoholic and nonalcoholic fatty liver diseases in mice. J Clin Invest. 2003;112:91–100. doi: 10.1172/JCI17797. [DOI] [PMC free article] [PubMed] [Google Scholar]
- Yang G, Badeanlou L, Bielawski J, Roberts AJ, Hannun YA, Samad F. Central role of ceramide biosynthesis in body weight regulation, energy metabolism, and the metabolic syndrome. Am J Physiol Endocrinol Metab. 2009;297:E211–224. doi: 10.1152/ajpendo.91014.2008. [DOI] [PMC free article] [PubMed] [Google Scholar]
- You M, Matsumoto M, Pacold CM, Cho WK, Crabb DW. The role of AMP-activated protein kinase in the action of ethanol in the liver. Gastroenterology. 2004;127:1798–1808. doi: 10.1053/j.gastro.2004.09.049. [DOI] [PubMed] [Google Scholar]
- Zhao Z, Yu M, Crabb D, Xu Y, Liangpunsakul S. Ethanol-induced alterations in fatty acid-related lipids in serum and tissues in mice. Alcohol Clin Exp Res. 2011;35:229–234. doi: 10.1111/j.1530-0277.2010.01338.x. [DOI] [PMC free article] [PubMed] [Google Scholar]
- Zhong W, Zhao Y, Tang Y, Wei X, Shi X, Sun W, Sun X, Yin X, Kim S, McClain CJ, Zhang X, Zhou Z. Chronic alcohol exposure stimulates adipose tissue lipolysis in mice: role of reverse triglyceride transport in the pathogenesis of alcoholic steatosis. Am J Pathol. 2012;180:998–1007. doi: 10.1016/j.ajpath.2011.11.017. [DOI] [PMC free article] [PubMed] [Google Scholar]