Abstract
Purpose
Our aim in this study was to apply three-dimensional (3D) MRI methods to analyze early postnatal morphological phenotypes in a Gbx2 conditional knockout (Gbx2-CKO) mouse that has variable midline deletions in the central cerebellum, reminiscent of many human cerebellar hypoplasia syndromes.
Methods
In vivo 3D manganese-enhanced MRI (MEMRI) at 100-µm isotropic resolution was used to visualize mouse brains between postnatal days 3 to 11, when cerebellum morphology undergoes dramatic changes. Deformation based morphometry (DBM) and volumetric analysis of MEMRI images were used to respectively detect and quantify morphological phenotypes in Gbx2-CKO mice. Ex vivo micro-MRI was performed after perfusion-fixation with supplemented gadolinium for higher resolution (50-µm) analysis.
Results
In vivo MEMRI and DBM correctly identified known cerebellar defects in Gbx2-CKO mice, and novel phenotypes were discovered in the deep cerebellar nuclei and the vestibulo-cerebellum, both validated using histology. Ex vivo micro-MRI revealed subtle phenotypes in both the vestibulo-cerebellum and the vestibulo-cochlear organ, providing an interesting example of complementary phenotypes in a sensory organ and its associated brain region.
Conclusion
These results show the potential of 3D MRI for detecting and analyzing developmental defects in mouse models of neurodevelopmental diseases.
Keywords: brain development, cerebellum, Gastrulation brain homeobox 2 gene, Gbx2, manganese enhanced MRI, MEMRI, mid-hindbrain, vestibulo-cochlear organ
INTRODUCTION
Advances in the field of mouse genetics have been critical in elucidating the roles of different genes in mammalian brain development and neurodevelopmental diseases (1–3). Specifically, genetic defects are commonly associated with congenital brain malformations, which can be mimicked in mutant mice to better understand the molecular and cellular basis of developmental brain disorders. The early postnatal period is a time of significant brain growth and patterning. Indeed, many mouse mutant brain phenotypes are first manifested during early postnatal stages, especially in the cerebellum, which acquires its complex foliation pattern during the first two weeks after birth. It is therefore important to develop and validate 3D neuroimaging approaches for quantitative analyses of neonatal mouse brain structures, enabling effective mutant phenotype analysis (4–6).
The cerebellum (derived from anterior hindbrain) and midbrain are regulated during embryogenesis from a common mid-hindbrain (MHB) organizing center – a tissue that sends molecular signals that instruct the fates of the surrounding midbrain and anterior hindbrain (cerebellum) cells. The MHB region has been the focus of numerous previous studies, with the result that many genes have been identified that are required for normal MHB development, and many mouse mutants are available that display a wide range of MHB defects (7–10). These mouse mutants are considered relevant to several human neurodevelopmental diseases, including Joubert, Dandy-Walker and other cerebellar hypoplasia syndromes, as well as diseases with more subtle anatomical features such as schizophrenia and autism (11–14). Important for the current studies, normal development of the MHB region depends on the gene gastrulation brain homeobox 2 (Gbx2) that is involved in determining the position of the MHB region. Gbx2 null mutant mice die at birth with a major deletion of the anterior hindbrain, including the entire cerebellum, and a posterior expansion of the midbrain (15). In contrast, Gbx2-conditional knockout (Gbx2-CKO) mice, in which Gbx2-expression is removed in the anterior hindbrain by embryonic day 9, are viable but smaller than wildtype littermates. Interestingly, while Gbx2-CKO mice have a cerebellum, these mutants exhibit variable deletions of the vermis, the central region of the cerebellum most affected in the majority of human hypoplasias (16).
Previously, we demonstrated the feasibility of visualizing early postnatal mouse cerebellum anatomy using 3D in vivo manganese (Mn)-enhanced MRI (MEMRI), including qualitative assessment of the variable deletions of the vermis in Gbx2-CKO mice during the second postnatal week (17). In the present study, we further investigated Gbx2-CKO mice using 3D MEMRI imaging, analyzing cerebellum and midbrain development in individual animals between postnatal day (P)3 and P11, with phenotypic comparison to littermate controls. We applied deformation based morphometry (DBM) approaches to MEMRI images, which provided an unbiased method to detect and quantify defects in brain anatomy in Gbx2-CKO mice at early postnatal stages. Interestingly, DBM analysis revealed novel phenotypes in both the deep cerebellar nuclei (DCN), the major output nuclei of the cerebellar circuitry, as well as the flocculus-paraflocculus (Fl-Pfl), the vestibulo-cerebellum that is involved in controlling balance. These previously unreported defects were both confirmed by histology. We further investigated the Gbx2-CKO vestibular phenotypes with ex vivo micro-MRI, and revealed subtle changes in anatomy in both the Fl-Pfl and the vestibular-cochlear organ (VCO), the sensory organ that sends projections to this brain region. These phenotypes are difficult to appreciate without 3D imaging approaches and, taken together, our results demonstrate the advantages of MRI approaches for 3D mutant phenotype analysis in the early postnatal mouse brain.
METHODS
Animals
All mice used in this study were maintained under protocols approved by the Institutional Animal Care and Use Committee of New York University School of Medicine. Contrast agent in the form of paramagnetic Mn2+ was delivered to neonates through lactation after maternal intraperitoneal (IP) injection of MnCl2 solution (30 mM solution in isotonic saline, 0.4mmol/kg of body weight), equivalent to 80mg MnCl2/kg body weight. This corresponded to injection of 0.4-ml of MnCl2 solution per 30g mouse, performed every other day, alternating between the right and left sides, for a total of 5 maternal injections per litter. No obvious abnormalities in the behavior or physical appearance of the mothers or pups as a result of MnCl2 injection were noticed during the course of this study. In each litter, 2–3 neonates were imaged 24–29h after maternal injection at each of 5 developmental stages: P3, P5, P7, P9 and P11. Table 1 provides a summary of the numbers of mice used for the in vivo MEMRI studies. The quantitative MEMRI results presented in this paper (N=6 mice for each stage and genotype) were generated from 15 wildtype and 15 Gbx2-CKO mice, using a combination of longitudinal and cross-sectional data (Table 1 and Supplemental Table 1). For imaging, each neonatal mouse was positioned in a custom built holder and anesthetized with 0.5–1% isoflurane in air delivered via nosecone. Warm air was blown through the magnet bore to maintain the mice at normal body temperature during imaging. After MRI, neonatal mice recovered for 15–20 minutes in a separate cage before being returned to their mothers and littermates. Tail PCR was used to confirm the genotype of each mouse being imaged, using previously reported primers and conditions (16).
Table 1. Summary of mice used in the in vivo MEMRI studies.
A combination of longitudinal and cross-sectional data was acquired from WT (N=19) and Gbx2-CKO (N=18) mice staged between P3 and P11. Quantitative analyses were performed on data acquired from 15 WT and 15 Gbx2-CKO mice (shaded region), where 1 to 4 image datasets were used for each mouse (see Supplemental Table 1 for details). Additional longitudinal studies (5 datasets per mouse) were used for qualitative comparisons between WT (N=4) and Gbx2-CKO (N=3) mice.
| Number of datasets (P3-P11) per mouse | ||||||
|---|---|---|---|---|---|---|
| Genotype | 1 | 2 | 3 | 4 | 5 | Total |
| WT | 8 | 2 | 2 | 3 | 4 | 19 |
| Gbx2-CKO | 8 | 2 | 2 | 3 | 3 | 18 |
| Number of mice | ||||||
Imaging Methods
MRI data were acquired using a 7T micro-imaging system, 200-mm horizontal bore magnet (Magnex Scientific, Yarnton UK) interfaced to a Bruker Biospec Avance II console (Bruker BioSpin MRI, Ettlingen Germany) and equipped with actively shielded gradients (gradient strength = 750 mT/m; BGA9S, Bruker). A 25-mm (ID) transmit / receive quadrature Litzcage coil (Doty Scientific, Columbia SC) was used to acquire the RF data. T1-weighted images were acquired using a 3D gradient echo (3DGE) pulse sequence (echo/repetition times, TE/TR = 3.6/50-ms; Flip Angle, FA = 40°; number of averages = 2; field of view, FOV = 2.56 × 2.56 × 2.56 cm3; matrix = 256 × 256 × 256), achieving isotropic resolution of 100-μm in 1h and 49 minutes.
To obtain higher resolution images, ex vivo 3D micro-MRI was also performed on a separate group of mice, not injected with MnCl2 solution, at P28. In this case, mice were anesthetized with pentobarbital (0.2 ml/30g) and perfused transcardially with a 10mM solution of gadopentetate dimeglumine (Magnevist, Bayer HealthCare Pharmaceuticals, Wayne NJ) in phosphate buffered saline (PBS) mixed with heparin (5000 u/L). The initial flush was followed by 4% paraformaldehyde (PFA) at 4°C mixed with 10mM Magnevist. The brains were left in skulls to preserve the soft tissue and bony anatomy, and kept in 1mM solution of Magnevist in 4%, 4°C PFA until imaging 48–72h after perfusion. Heads were mounted in a custom holder and immersed in perfluoropolyether (Fomblin, Solvay Solexis, Thorofare NJ) for the duration of the scan (3DGE: TE/TR=6.3/50ms; FA=40°; number of averages = 2; FOV = 2.56 × 2.56 × 2.56 cm3; matrix = 512 × 512 × 512; isotropic resolution = 50-μm; total imaging time = 7h and 15 minutes).
Deformation Based Morphometry
Deformation based morphometry (DBM) analysis was performed using software provided by the Mouse Imaging Centre (Toronto, Canada), utilizing image registration tools from the Montreal Neurologic Institute [Collins 2004]. To quantify regional volume differences between wildtype and Gbx2-CKO mice, all the images (wildtype and Gbx2-CKO, at each postnatal stage) were first registered (6-parameter, rigid-body) to a reference image to define orientation. Next, spatial nonuniformity correction and normalization of signal intensities was performed using previously described methods (18). Subsequently, pairwise 12-parameter registrations were performed to create an unbiased space and a first population average image. Nonlinear registration of each image to the average allowed generation of a refined average, a process performed iteratively at progressively finer spatial scales until the final resolution of 100-µm was achieved (19,20). The result of this process included a final average image and 3D deformation fields describing the anatomical differences between each mouse and the average. The logarithm of the determinant of the Jacobian matrix was computed on a voxel-by-voxel basis from these deformation fields (19,20) and compared voxel-wise by Student’s t-tests to identify significant differences in volume between Gbx2-CKO mice and wildtype littermates. Correction for multiple comparisons was achieved by using the false discovery rate (FDR<5%) method (21). All statistics were performed on the log of the determinant of the Jacobian matrix. For visualization and easier interpretation the group difference was displayed after taking the exponent after the thresholding the statistical map using the false discovery rate method. Additionally, average images of Gbx2-CKO and wildtype mice were generated for each developmental stage during the registration process.
Volumetric Analysis
Volumetric measurements and 3D renderings were generated from MEMRI images using AMIRA (Visage Imaging). The whole brain was extracted using semi-automated segmentation procedures available in AMIRA. First, the magic wand function was used to delineate a contour of the intracranial space on a coronal section. Based on this contour a semi-automatic propagation algorithm was used to expand the contour to other slices. Once the contour encompassing the entire brain was established, the contour was smoothed in 3D and corrected manually. The posterior cut off point for the brain volume was established by locating the first coronal section on which the spinal cord was visible, and using all the image data anterior to this coronal section. The subregions selected for volumetric analysis included: midbrain structures (inferior and superior colliculus), whole cerebellum, cerebellar vermis, hemispheres, Fl-Pfl complex and DCN. Delineation of each of the structures was based on defined landmarks that were established based on a (histological) mouse brain atlas (22). The volume of the whole cerebellum was calculated as the sum of the volumes of the cerebellar vermis, hemispheres and Fl-Pfl. Similarly, the cerebellum, Fl-Pfl and VCO were segmented from ex vivo micro-MRI images in AMIRA. For visualization of both in vivo MEMRI and ex vivo micro-MRI segmentations, the images were resampled to 25-µm resolution in AMIRA. Brain sub-regions were segmented manually by drawing contours on every other slice and using AMIRA’s interpolate function to fill in the gaps, after which each sub-region was smoothed and rendered using the Voltex function. For reconstructions from ex vivo micro-MRI, the enhancing fluid space in the VCO was segmented based on thresholding, and then manually edited and smoothed. Ex vivo micro-MRI images of the cerebellum also provided excellent contrast between the outer enhancing molecular layer and the inner layers, which allowed threshold-based segmentation of the cerebellar foliation patterns.
Histology and Tissue Staining
For histology and immunohistochemical (IHC) staining, mice were perfused transcardially with 4°C PBS and then with 4°C, 4% paraformaldehyde (PFA) to fix the tissue. After perfusion, brains were removed from the skull and left in 4°C, 4% PFA overnight, after which the brains were cryoprotected, first in 15% and then in 30% sucrose, and sectioned (14-µm) on a cryostat (Leica CM3050S). Cerebellar morphology and cytoarchitecture was examined using standard hematoxylin and eosin (H&E) staining. DCN morphology was examined using IHC staining for TBR1 (expressed by DCN neurons) and nuclear staining with DAPI. IHC staining was performed using previously described protocols (23), with rabbit anti-Tbr1 primary antibody (1:500, Abcam ab31940), followed by Alexa-488 conjugated donkey anti-rabbit secondary antibody, (1:500) and DAPI (1:500). After staining, sections were cover-slipped and imaged at 20× magnification using an Axio Observer (Zeiss) microscope.
RESULTS
In vivo MEMRI showed variable defects in the MHB region of Gbx2-CKO mice
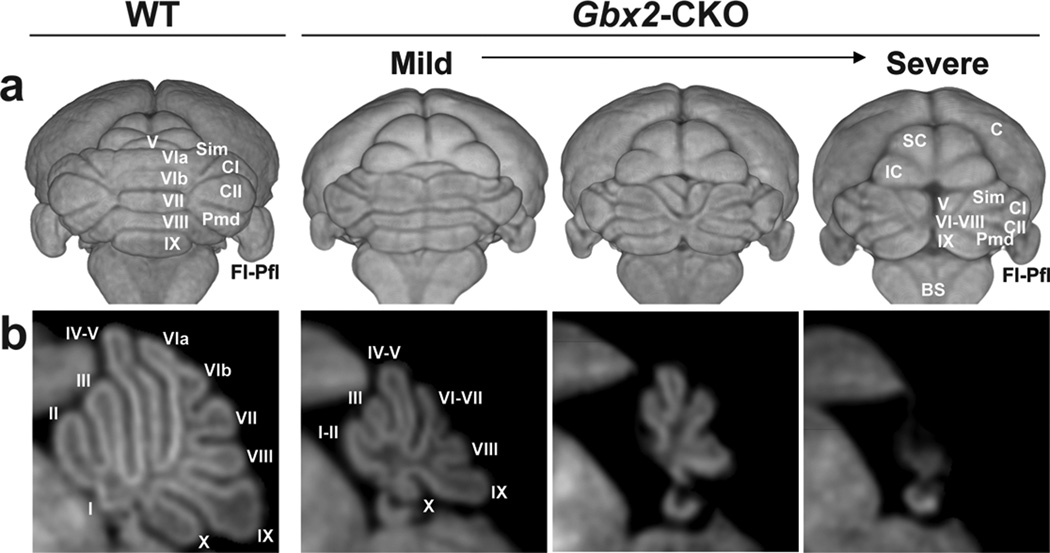
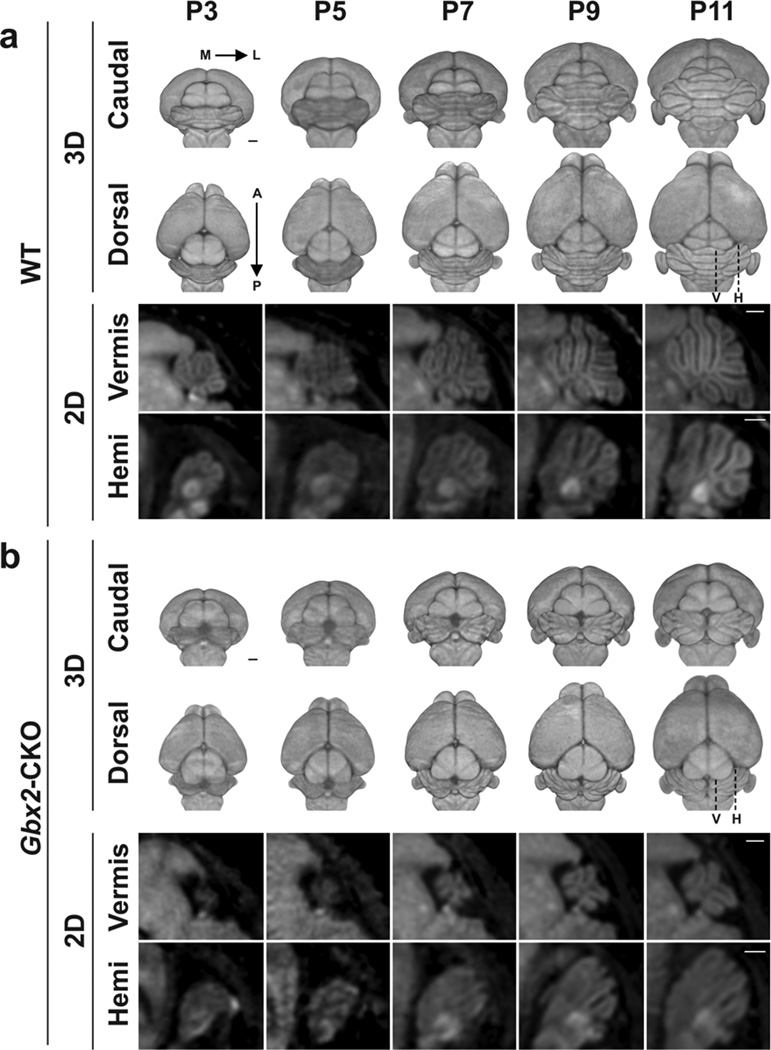
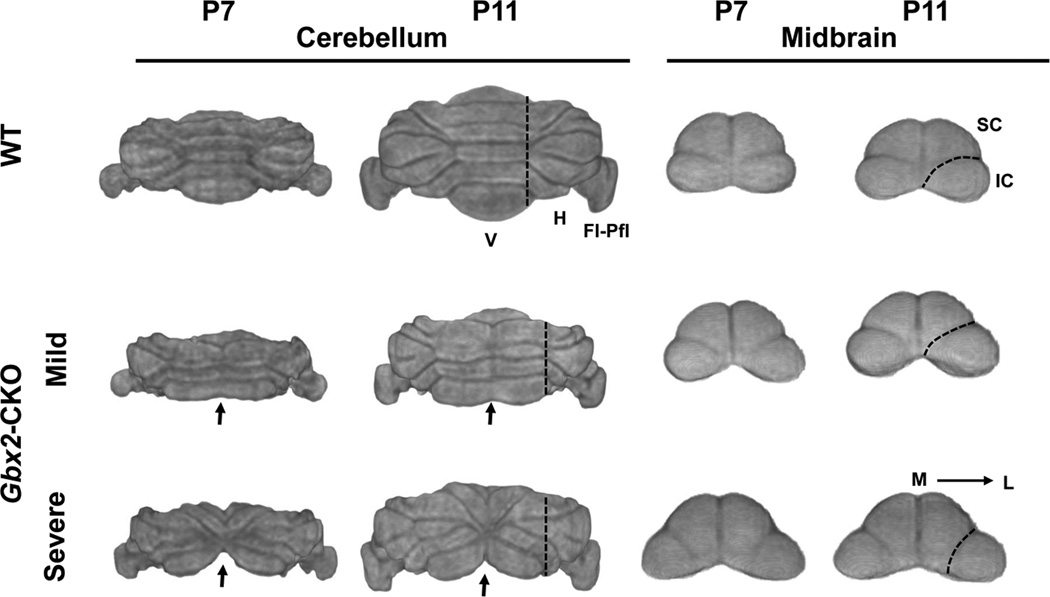
In vivo MEMRI images clearly demonstrated the expected reduction in overall brain size and variable cerebellar defects in Gbx2-CKO mice. 3D renderings of the whole brain, viewed from the back were especially useful for this purpose, showing defects ranging from a mild to a severe midline loss in the central vermis (Fig. 1). Longitudinal imaging allowed study of the evolution of these phenotypes from P3 to P11 in individual mice, using both 2D sections and 3D renderings from in vivo MEMRI data (Fig. 2; see Table 1 for numbers of mice imaged longitudinally). The variable midline cerebellar deletions were accompanied by variable alterations in midbrain morphology, likely a secondary effect since Gbx2 is not expressed in the developing midbrain (Fig. 3). Specifically, there were variable elongations of both the midbrain inferior colliculus (IC) and superior colliculus (SC), with the IC extending more laterally toward the cerebellar hemispheres, and the SC extending posteriorly towards the vermis in Gbx2-CKO mutants (Figs. 1–3).
Figure 1. MEMRI demonstrates variable defects in the Gbx2-CKO mouse brain.
(a) 3D volume renderings of MEMRI data acquired at P11 in wildtype (WT) and Gbx2-CKO mice. (b) 2D mid-sagittal sections through each cerebellum, illustrating the variable midline deletions in the Gbx2-CKO mutant mice, from a mild to severe (left to right) reduction of the central vermis region. Individual vermis lobules are labeled in roman numerals (I to X), as well as the four hemisphere lobules: simplex, Sim; crusI, CI; crusII, CII; paramedian, Pmd. Other labels: brainstem, BS; cortex, C; flocculus-paraflocculus, Fl-Pfl; inferior colliculus, IC; superior colliculus, SC.
Figure 2. MEMRI enables longitudinal imaging in individual neonatal mice.
Representative longitudinal datasets of a wildtype (WT) (a) and a severe Gbx2-CKO mutant (b) mouse, each imaged from P3 to P11. Cerebellar morphology was visible on 2D sections of vermis and hemisphere (Hemi) and in 3D renderings shown in dorsal (from the top) and caudal (from the back) views. The increase in cerebellar size and complexity known to occur through these postnatal stages were observed through development (left to right) in WT images. Cerebellar foliation patterns were easier to appreciate at later developmental stages both in the vermis as well as in the hemispheres. In mutants (b), the cerebellum could also be identified but was smaller (particularly in severely-affected mice) and had obvious midline defects. Labels: anterior, A; (cerebellar) hemisphere, H; lateral, L; medial, M; posterior, P; vermis, V. Scale bars = 500 µm.
Figure 3. Digital dissections show variable cerebellum and midbrain phenotypes.
3D caudal renderings of cerebellum (left) and midbrain (right) for individual wildtype (WT) and two Gbx2-CKO mutant mice (mild and severe), each imaged at P7 and P11. Midline defects in the mutants (arrows) appeared with variable severity, and were accompanied by changes in vermis (V) patterning, and reduced hemisphere (H) and flocculus-paraflocculus (Fl-Pfl) volumes. The cerebellar defects were accompanied by changes in midbrain anatomy, namely an elongation posteriorly of the superior colliculus (SC) and an elongation laterally of the inferior colliculus (IC). Dashed lines show the approximate position of the border between the V and H in the cerebellum, and between the IC and SC in the midbrain. Labels: lateral, L; medial, M.
DBM analysis revealed both known and novel phenotypes in Gbx2-CKO mice
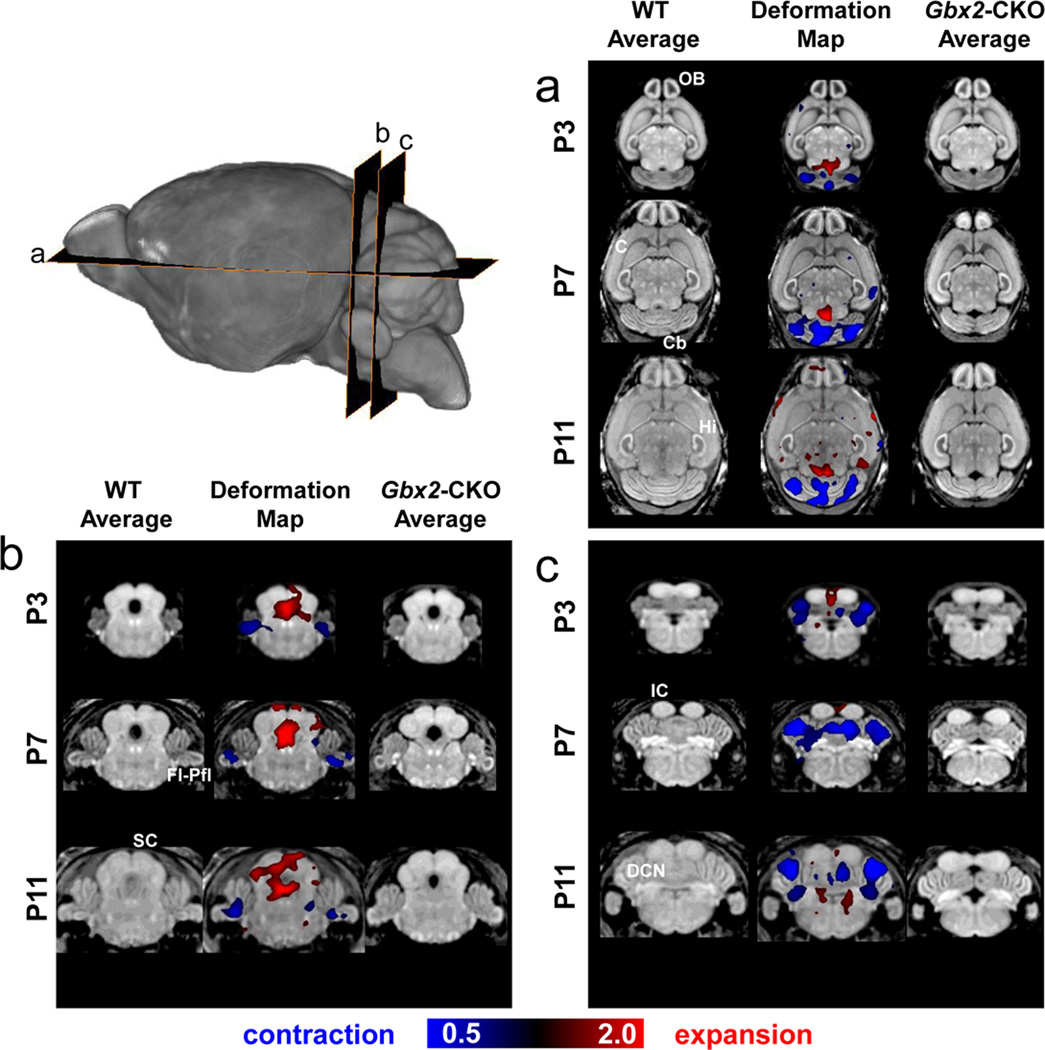
We used DBM as an unbiased approach to detect phenotypes in the developing mouse brain. MEMRI images from Gbx2-CKO mice and wildtype littermates were analyzed at three postnatal stages (P3, P7 and P11) using DBM (Fig. 4; N = 6 for each stage and genotype). After normalizing for the global decrease in brain size in Gbx2-CKO mice, DBM analysis revealed the expected relative volume reduction in the central vermis at all developmental stages. Our analysis also revealed novel, previously unreported phenotypes, namely reduced volumes in the cerebellar hemispheres, the Fl/Pfl complex, and the DCN. Interestingly, the DCN and many other nuclei throughout the neonatal mouse brain showed marked enhancement on MEMRI images. Consistent with the qualitative observations of midbrain alterations, DBM analysis also showed expanded volumes in parts of the IC and SC, as well as an increase in the volume of the fourth ventricle, likely a secondary effect as a result of the cerebellar deletions.
Figure 4. DBM reveals multiple developmental phenotypes in Gbx2-CKO mice.
After correcting for differences in the overall brain volume, deformation based morphometry (DBM) revealed statistically significant (false discovery rate, FDR<0.05) differences in brain volume and shape in a number of regions and developmental stages, comparing wildtype (WT) and Gbx2-CKO mice. Horizontal (a) and coronal (b,c) slices through the 3D MRI data show the WT and Gbx2-CKO average brain images, and selected DBM results at P3, P7 and P11 (inset shows the approximate level of each image slice). The middle column of each panel (a,b,c) shows the statistically significant voxel size changes in color, superimposed on the average WT image. The color scale indicates regions that were significantly larger (red; volume expansion up to 2x) or smaller (blue; volume contraction down to 0.5x) in the Gbx2-CKO mice compared to WT littermates. Labels: cortex, C; cerebellum, Cb; deep cerebellar nuclei, DCN; flocculus-paraflocculus, Fl-Pfl; hippocampus, Hi; olfactory bulb, OB.
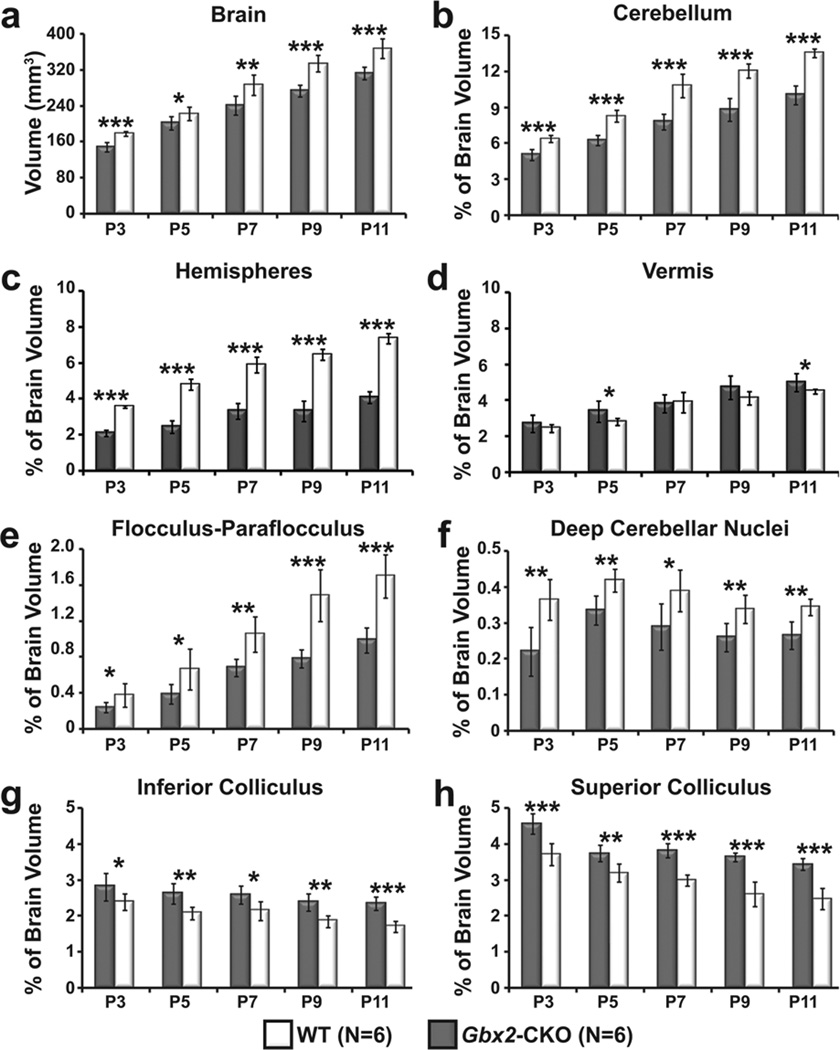
We further quantified neonatal phenotypes using semi-automatic segmentation and volumetric analysis of MEMRI images to analyze the volumes of the whole brain, cerebellum and subregions within the cerebellum and midbrain at all five (P3-P11) developmental stages (Fig. 5; N=6 for each stage and genotype; *p<0.05, **p<0.01, ***p<0.001). Paired-sample student’s t-test revealed statistically significant differences between wildtype and Gbx2-CKO mice in the whole brain (Fig. 5a), cerebellum, cerebellar hemispheres, Fl-Pfl, and DCN at all stages. These results remained significant even after controlling for overall brain size (Fig. 5b,c,e,f). Although the mutants all had midline vermis deletions, the whole vermis volume (normalized to the whole brain volume) was much less affected than other cerebellar sub-regions, and was actually slightly enlarged in Gbx2-CKO mice compared to wildtype (Fig. 5d). Volumetric analysis also confirmed the relative enlargement of the midbrain IC and SC at all stages, after normalization to the whole brain volume in each animal (Fig. 5g,h).
Figure 5. Volumetric analysis of Gbx2-CKO cerebellum and midbrain subregions.
Semi-automated ROI analysis showed significant differences in the whole brain, and a number of sub-regions at developmental stages between P3 and P11 (mean ± standard deviation shown in each region for Gbx2-CKO and wildtype (WT) littermates, N=6 for each genotype and stage). (a) The Gbx2-CKO mouse brain was significantly smaller than WT at each stage. After normalization to the whole brain volume, there were also stage-dependent differences in the volumes of the: (b) cerebellum; (c) hemispheres; (d) vermis; (e) flocculus-paraflocculus; (f) deep cerebellar nuclei; (g) inferior colliculus (IC); and (h) superior colliculus (SC). The p-values for each statistical comparison (WT vs Gbx2-CKO) were denoted as follows: *p < 0.05; **p < 0.01; ***p < 0.001.
In vivo MEMRI reveals altered morphology in the DCN of Gbx2-CKO mice
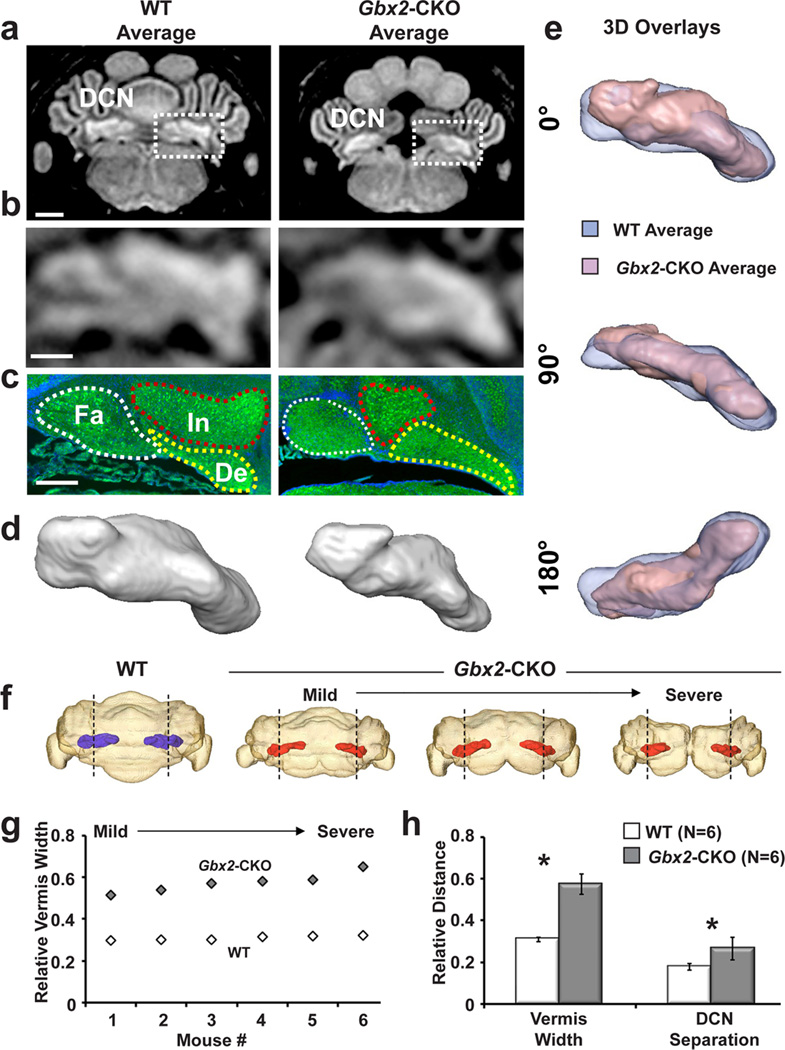
Further analyses were performed to investigate the novel DCN phenotypes in the Gbx2-CKO mutants revealed by MEMRI (Fig. 6). Registered and averaged P11 MEMRI images (N=6 for each genotype) were matched to histological sections, which showed altered morphology in the medial-to-laterally arranged fastigial, interposed and dentate nuclei, which make up the DCN (Fig. 6a–c). Surface renderings were generated from the MRI data to examine the 3D morphology of the DCN, which revealed local differences in the shape of the DCN along the medial-lateral axis, comparing the averaged wildtype and Gbx2-CKO images (Fig. 6d,e). Differences were also observed in the spatial localization of the DCN within the cerebellum, comparing individual P11 wildtype and Gbx2-CKO mice (Fig. 6f). Specifically, the DCN appeared to maintain their position relative to the vermis-hemisphere border, independent of the severity of the cerebellar defects in each mutant. Consistent with the previously observed enlargement of vermis volume in Gbx2-CKO mice (Fig. 5d), the relative medial-lateral width of the vermis, normalized by the width of the cerebellum, was significantly increased in the Gbx2-CKO mice compared to their wildtype littermates (Fig. 6g; *p<0.001, N=6 for each genotype). After normalization to the vermis width, there was also a significant increase in the medial-lateral separation between the left and right DCN in Gbx2-CKO mice compared to wildtype littermates (Fig. 6h; *p<0.01, N=6 for each genotype). These results strongly suggest that there is a more global transformation of both cerebellar vermis and hemispheres than previously appreciated in the Gbx2-CKO mice, which also translates into changes in the volume, shape and spatial localization of the Gbx2-CKO DCN.
Figure 6. MEMRI reveals altered shape and position of the Gbx2-CKO DCN.
(a,b) MEMRI images of the registered and averaged P11 wildtype (WT) and Gbx2-CKO mice (magnified views in b - dashed boxes on panel a show position of panel b) demonstrated the deep cerebellar nuclei (DCN), which appeared as an enhanced structure at the base of the cerebellum. (c) Matched histology was in good agreement with MEMRI. Staining in the histological sections was green for TBR1, a marker of DCN neurons, and blue for DAPI, a nuclear stain. Histology showed the three nuclei that make up the DCN: fastigial (Fa); interposed, (In); dentate, (De). (d) 3D reconstruction from MEMRI data shows surface-rendered views of WT and Gbx2-CKO DCN. (e) Overlays of surface-renderings of WT (blue) and Gbx2-CKO (red) DCN show the local shape differences in three views (rotated 90° about the medial-lateral axis between views). (f) Superimposed 3D renderings of cerebellum (semi-transparent) with DCN (color) show the relative positions of the DCN in a WT (blue) and three Gbx2-CKO mutants (red), with mild to severe midline deletions. The borders between vermis and hemispheres are marked with dashed lines. (g) The relative vermis width (normalized to cerebellum width) was measured in 6 WT and 6 Gbx2-CKO mice, showing an obvious increase in the mutants, with the largest increase in relative vermis width occurring in the Gbx2-CKO mice with the most severe midline deletions. (h) Quantitative analysis showed a significant increase in the vermis width (normalized to the cerebellum width) and in the separation between the left and right DCN (normalized to vermis width) in the Gbx2-CKO vs. WT mice (N=6 for each genotype; see text for statistical analysis). Scale bars = 1mm.
Ex vivo micro-MRI shows complementary defects in Gbx2-CKO Fl-Pfl and VCO
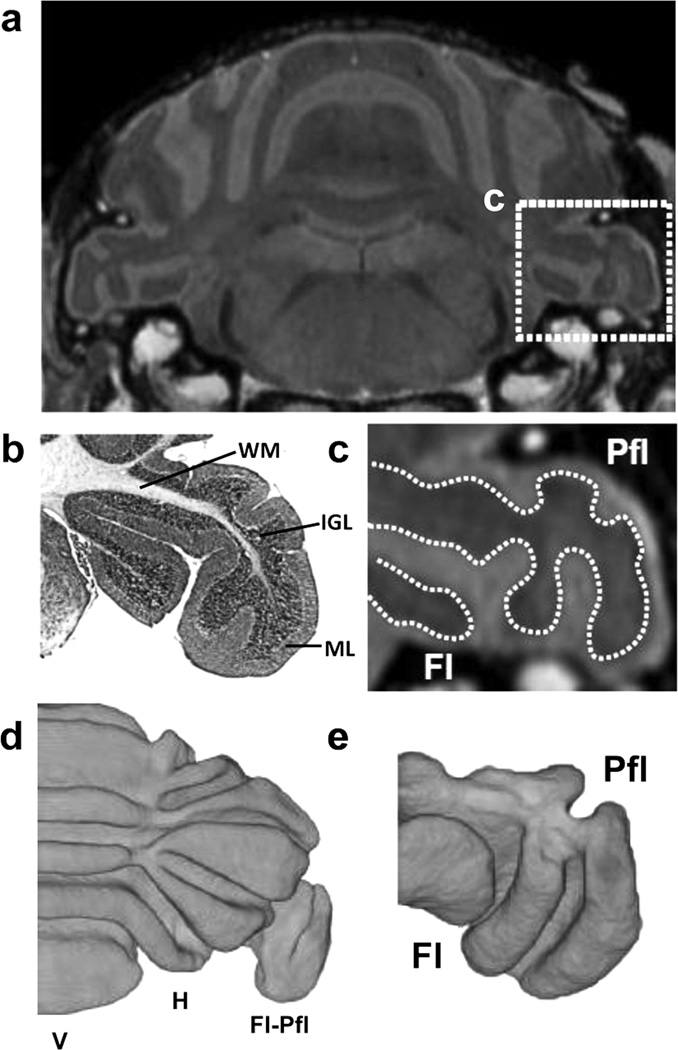
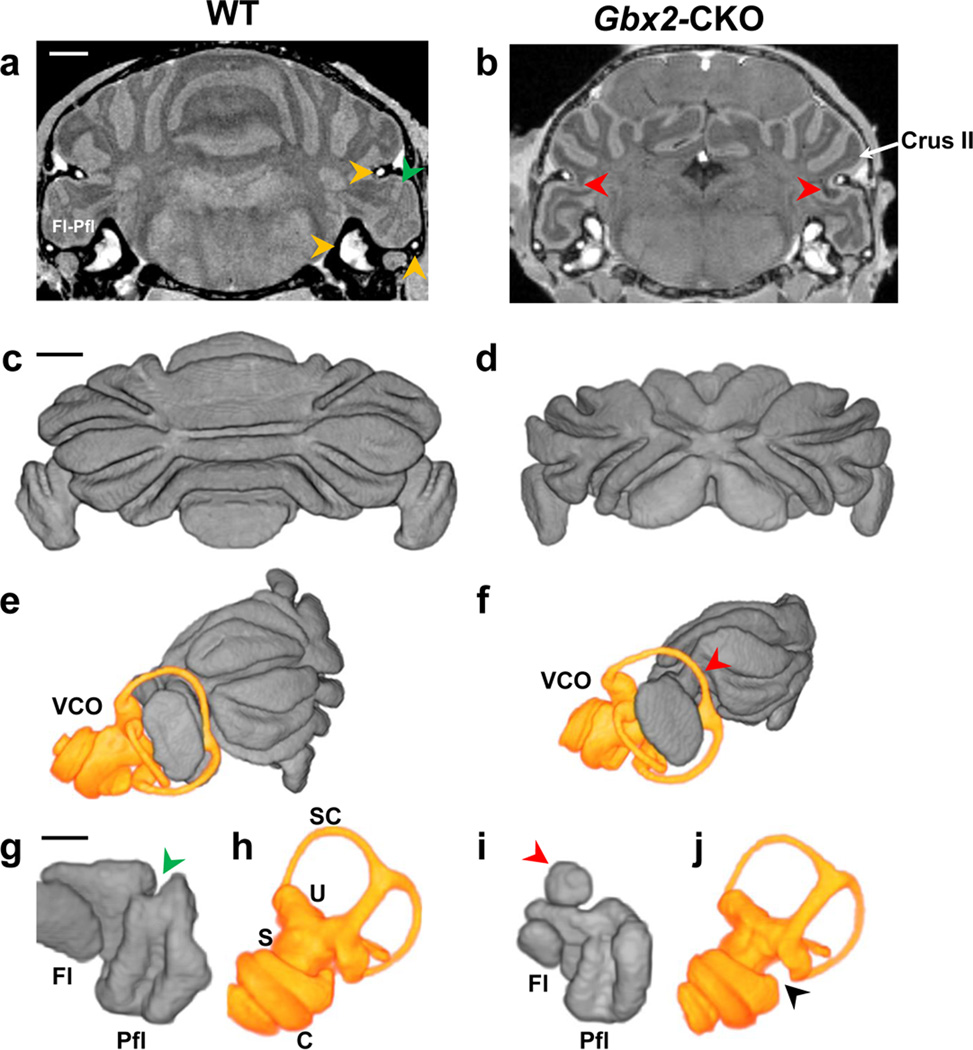
The results of the in vivo MEMRI studies highlighted the timing of normal cerebellum foliation patterning, and demonstrated a range of cerebellar defects in Gbx2-CKO mice, including a reduced volume of the Fl-Pfl complex, the most lateral region of cerebellum involved in vestibular function. To further study this phenotype, an analysis of the Fl-Pfl was undertaken at P28, a stage at which the Fl-Pfl are expected to be adult-like in both foliation patterns and vestibular function. For this analysis, we turned to an ex vivo, contrast-enhanced micro-MRI method to provide higher resolution (50-µm) images of the vestibulo-cerebellum (Fig. 7; N=6 wildtype mice). The ex vivo micro-MRI images gave excellent contrast between the molecular layer and the internal granular layer (Fig. 7a–c), allowing straightforward segmentation of the foliation patterns in the Fl-Pfl and the more central regions of the cerebellum (Fig. 7d,e; Fig. 8). Ex vivo micro-MRI also provided effective visualization and segmentation of the fluid-filled space within the vestibulo-cochlear organ (VCO), the sensory organ responsible for maintaining balance (Fig. 8; N=6 for each genotype). 3D micro-MRI enabled detailed examination of the morphologies of the cerebellum (Fig. 8a–d), and both the Fl-Pfl and VCO (Fig. 8e–j), showing phenotypes in both the vestibulo-cerebellum and its associated sensory organ in Gbx2-CKO mice. Specifically, differences were present in the Gbx2-CKO Fl-Pfl foliation pattern, especially in the medial Pfl, and subtle VCO shape were observed in the mutants, especially in the region connecting the cochlea to the semi-circular canals. We also observed the abnormal inclusion of part of the adjacent hemisphere lobule (crusII) into the more lateral space normally occupied by the Fl in a number of Gbx2-CKO mutants (Fig. 8f,i; observed bilaterally in N = 4/6 Gbx2-CKO mice, and N=0/6 wildtype mice). Therefore, ex vivo micro-MRI provided high resolution 3D data for simultaneous phenotype analysis of both the Fl-Pfl and the VCO.
Figure 7. Ex vivo micro-MRI for high-resolution imaging of Fl-Pfl.
(a) Ex vivo micro-MRI of the P28 wildtype mouse brain provided detailed visualization of the foliation pattern in the cerebellum, including the flocculus-paraflocculus (Fl-Pfl) (shown in the dashed box). (b) Matching histology (stained with H&E) and (c) micro-MRI (magnified view corresponding to the dashed box in panel a), and showed good (qualitative) correlation between the non-enhanced inner region on MRI and the combined white matter (WM) and internal granule cell (IGL) layers, and between the enhanced outer region on MRI and the molecular layer (ML). 3D reconstruction of the inner non-enhanced (WM and IGL) from ex vivo micro-MRI provided excellent visualization of the foliation patterns in (d) the cerebellum proper (shown bisected along the midline), as well as (e) the Fl-Pfl (viewed in a similar orientation as the section in panel c). Labels: hemispheres, H; vermis, V.
Figure 8. Ex vivo micro-MRI reveals phenotypes in the Gbx2-CKO Fl-Pfl and VCO.
Ex vivo MRI of fixed P28 wildtype (WT) (a) and Gbx2-CKO (b) heads enabled visualization of both the cerebellum and the enhanced vestibulo-cochlear organ (VCO) (a, yellow arrowheads), and demonstrated a missing fissure in the medial paraflocculus (Pfl) (a, green arrowhead), and the abnormal inclusion of part of the crusII hemisphere lobule in the flocculus-paraflocculus (Fl-Pfl) complex adjacent to the VCO (b, red arrowheads). 3D reconstructions showed the obvious differences in cerebellar foliation between WT (c) and Gbx2-CKO (d), as well as the close proximity of the VCO (yellow) and Fl-Pfl in WT (e) and Gbx2-CKO (f) mice. Separating the Fl-Pfl (g,i) and VCO (h,j) in WT (g,h) and Gbx2-CKO (i,j) further revealed the reduced size of the mutant Fl-Pfl most obvious in the flocculus (Fl), the missing fissure in the Gbx2-CKO Pfl (g, green arrowhead) and the abnormal extension of crusII into the mutant Fl-Pfl (f,i red arrowhead), as well as a small deletion in the VCO (j, black arrowhead). Labels: cochlea, c; flocculus-paraflocculus, Fl-Pfl; saccule, s; semi-circular canal, sc; utricle, u. Scale bar in (a) = 1 mm for (a,b); in (c) = 1 mm for (e–f); and in (g) = 500 µm for (g–j).
DISCUSSION
The results of these studies demonstrate the feasibility of MEMRI for longitudinal imaging and 3D analysis of early postnatal brain development, from P3 to P11 in individual mice. Maternal IP injection of MnCl2 was found to be a simple and effective method for Mn-delivery to neonatal mice via lactation, providing ample MEMRI contrast for imaging and analysis of normal brain development and mutant phenotypes. Enhancement of cerebellar foliation patterns on MEMRI images enabled in vivo 3D analysis of mutant phenotypes in the cerebellum and adjacent midbrain structures in Gbx2-CKO mouse neonates, a model of developmental cerebellar hypoplasia. The ability to follow individual animals during the course of brain development was especially useful for characterizing mouse models like the Gbx2-CKO mutants with variable phenotypes. More generally, longitudinal MEMRI imaging should provide a unique and powerful method for future quantitative analysis of developmental brain growth, in both normal neonatal mice and in a wide variety of defined mouse mutants. It should be noted that Mn at high dose is known to produce neurotoxic effects. Although no obvious neurotoxicity was observed in the current investigations, it will be important in future to establish the Mn-exposure conditions that are safe for MEMRI studies of neurodevelopment in mice (24,25).
Registration-based DBM analysis, applied to 3D MEMRI images, provided an effective and sensitive approach to detect phenotypes in the early postnatal mouse brain. Traditional manual or even semi-automated volumetric analyses of MRI data require an a priori hypothesis as to which brain regions are affected. These methods are not only labor intensive, but are also prone to intra- and inter-observer variability, which can bias the results and affect data interpretation. DBM provides an unbiased approach, which has found numerous applications within the field of human imaging and has recently been applied for phenotype analysis of genetically engineered mouse models (26–35). In the current study, DBM analysis correctly identified the previously reported midline deletion phenotype in the Gbx2-CKO cerebellar vermis, and also detected novel phenotypes in the cerebellum and midbrain.
MEMRI images of early postnatal mice demonstrated contrast enhancement in the DCN and a number of other brain nuclei, suggesting that MEMRI may be a useful approach for future analysis of developing circuits in neonatal mice. In the current study, we focused solely on morphological phenotypes in the Gbx2-CKO mice. Regional MEMRI signal intensity differences, which may reflect functional phenotypes in these mutant mice, were not analyzed. Interestingly, DBM analysis identified a volume reduction in the Gbx2-CKO DCN, a phenotype that was validated with both semi-automated volumetric analysis of MEMRI images, and with histology. In addition to these volumetric changes, MEMRI also demonstrated differences in the shape and spatial localization of the DCN in Gbx2-CKO mice, results that should motivate future investigations of the genetic factors controlling DCN development. Since the DCN are the major output nuclei from the cerebellum, these results may indicate a possible larger effect on cerebellar circuitry. Future investigations using diffusion tensor imaging (DTI) in the Gbx2-CKO mice may be informative to determine the extent of these circuit-related phenotypes.
In addition to phenotypes in cerebellar vermis and hemispheres, DBM and semi-automated volumetric analysis both showed a reduction in the Fl-Pfl complex of Gbx2-CKO mice. This most lateral region of the cerebellum is best known for its role in vestibular function, but is relatively less studied than the vermis and hemispheres. Ex vivo imaging provided further phenotype analysis in the regions of the Fl-Pfl and surrounding tissues. Three-dimensional renderings of the VCO, the vestibular sensory organ, segmented from ex vivo micro-MRI, were inherently registered to the images of Fl-Pfl that receives its projections. In this way, mutant phenotypes in both the vestibulo-cerebellum and VCO could be analyzed from the same micro-MRI images.
Taken together, the current results show great potential for MRI and DBM in studies of brain development and mutant phenotype analysis in mouse models of human neurodevelopmental disorders. MEMRI can be used for visualization and quantitative analysis of anatomy during the critical early postnatal period of brain development, and also enables longitudinal studies in individual mice. In the current studies we focused on the developing cerebellum, a brain region that has recently received increasing attention because of its involvement in many congenital brain malformation syndromes and neurodevelopmental disorders. However, the approaches demonstrated in this paper are not specific to the cerebellum, and should be generally applicable to other brain regions in a wide variety of mouse models of human developmental brain diseases.
Supplementary Material
ACKNOWLEDGMENTS
This work was supported by NIH grant RO1 N5038461. We thank Dr. Sandra Wilson (Sloan-Kettering Institute) for assistance with the histology and immunohistochemistry, Dr. Roy Sillitoe (Baylor College of Medicine) for useful discussions and advice in the early stages of the project, and Eugenia Volkova (New York University) for technical assistance with some of the volumetric image analysis.
REFERENCES
- 1.Collins FS, Rossant J, Wurst W. A mouse for all reasons. Cell. 2007;128(1):9–13. doi: 10.1016/j.cell.2006.12.018. [DOI] [PubMed] [Google Scholar]
- 2.Sajan SA, Waimey KE, Millen KJ. Novel approaches to studying the genetic basis of cerebellar development. Cerebellum. 2010;9(3):272–283. doi: 10.1007/s12311-010-0169-6. [DOI] [PMC free article] [PubMed] [Google Scholar]
- 3.Silverman JL, Yang M, Lord C, Crawley JN. Behavioural phenotyping assays for mouse models of autism. Nat Rev Neurosci. 2010;11(7):490–502. doi: 10.1038/nrn2851. [DOI] [PMC free article] [PubMed] [Google Scholar]
- 4.Turnbull DH, Mori S. MRI in mouse developmental biology. NMR in biomedicine. 2007;20(3):265–274. doi: 10.1002/nbm.1146. [DOI] [PMC free article] [PubMed] [Google Scholar]
- 5.Nieman BJ, Turnbull DH. Ultrasound and magnetic resonance microimaging of mouse development. Methods Enzymol. 2010;476:379–400. doi: 10.1016/S0076-6879(10)76021-3. [DOI] [PMC free article] [PubMed] [Google Scholar]
- 6.Nieman BJ, Wong MD, Henkelman RM. Genes into geometry: imaging for mouse development in 3D. Curr Opin Genet Dev. 2011;21(5):638–646. doi: 10.1016/j.gde.2011.08.009. [DOI] [PubMed] [Google Scholar]
- 7.Liu A, Joyner AL. Early anterior/posterior patterning of the midbrain and cerebellum. Annual review of neuroscience. 2001;24:869–896. doi: 10.1146/annurev.neuro.24.1.869. [DOI] [PubMed] [Google Scholar]
- 8.Liu A, Joyner AL. EN and GBX2 play essential roles downstream of FGF8 in patterning the mouse mid/hindbrain region. Development. 2001;128(2):181–191. doi: 10.1242/dev.128.2.181. [DOI] [PubMed] [Google Scholar]
- 9.Sgaier SK, Millet S, Villanueva MP, Berenshteyn F, Song C, Joyner AL. Morphogenetic and cellular movements that shape the mouse cerebellum; insights from genetic fate mapping. Neuron. 2005;45(1):27–40. doi: 10.1016/j.neuron.2004.12.021. [DOI] [PubMed] [Google Scholar]
- 10.Sillitoe RV, Joyner AL. Morphology, molecular codes, and circuitry produce the three-dimensional complexity of the cerebellum. Annu Rev Cell Dev Biol. 2007;23:549–577. doi: 10.1146/annurev.cellbio.23.090506.123237. [DOI] [PubMed] [Google Scholar]
- 11.Zervas M, Blaess S, Joyner AL. Classical embryological studies and modern genetic analysis of midbrain and cerebellum development. Current topics in developmental biology. 2005;69:101–138. doi: 10.1016/S0070-2153(05)69005-9. [DOI] [PubMed] [Google Scholar]
- 12.Gowen E, Miall RC. The cerebellum and motor dysfunction in neuropsychiatric disorders. Cerebellum. 2007;6(3):268–279. doi: 10.1080/14734220601184821. [DOI] [PMC free article] [PubMed] [Google Scholar]
- 13.Fatemi SH, Reutiman TJ, Folsom TD, Sidwell RW. The role of cerebellar genes in pathology of autism and schizophrenia. Cerebellum. 2008;7(3):279–294. doi: 10.1007/s12311-008-0017-0. [DOI] [PubMed] [Google Scholar]
- 14.Millen KJ, Gleeson JG. Cerebellar development and disease. Current opinion in neurobiology. 2008;18(1):12–19. doi: 10.1016/j.conb.2008.05.010. [DOI] [PMC free article] [PubMed] [Google Scholar]
- 15.Wassarman KM, Lewandoski M, Campbell K, Joyner AL, Rubenstein JL, Martinez S, Martin GR. Specification of the anterior hindbrain and establishment of a normal mid/hindbrain organizer is dependent on Gbx2 gene function. Development. 1997;124(15):2923–2934. doi: 10.1242/dev.124.15.2923. [DOI] [PubMed] [Google Scholar]
- 16.Li JY, Lao Z, Joyner AL. Changing requirements for Gbx2 in development of the cerebellum and maintenance of the mid/hindbrain organizer. Neuron. 2002;36(1):31–43. doi: 10.1016/s0896-6273(02)00935-2. [DOI] [PubMed] [Google Scholar]
- 17.Wadghiri YZ, Blind JA, Duan X, Moreno C, Yu X, Joyner AL, Turnbull DH. Manganese-enhanced magnetic resonance imaging (MEMRI) of mouse brain development. NMR in biomedicine. 2004;17(8):613–619. doi: 10.1002/nbm.932. [DOI] [PubMed] [Google Scholar]
- 18.Sled JG, Zijdenbos AP, Evans AC. A nonparametric method for automatic correction of intensity nonuniformity in MRI data. IEEE transactions on medical imaging. 1998;17(1):87–97. doi: 10.1109/42.668698. [DOI] [PubMed] [Google Scholar]
- 19.Kovacevic N, Henderson JT, Chan E, Lifshitz N, Bishop J, Evans AC, Henkelman RM, Chen XJ. A three-dimensional MRI atlas of the mouse brain with estimates of the average and variability. Cereb Cortex. 2005;15(5):639–645. doi: 10.1093/cercor/bhh165. [DOI] [PubMed] [Google Scholar]
- 20.Lerch JP, Sled JG, Henkelman RM. MRI phenotyping of genetically altered mice. Methods Mol Biol. 2011;711:349–361. doi: 10.1007/978-1-61737-992-5_17. [DOI] [PubMed] [Google Scholar]
- 21.Benjamini Y, Hochberg Y. Controlling the false discovery rate: a practical and powerful approach to multiple testing. J R Stat Soc B Methodol. 1995;57:289–300. [Google Scholar]
- 22.Paxinos G, Franklin KBG. The Mouse Brain in Stereotaxic Coordinates. Elsevier Academic Press; San Diego: 2001. [Google Scholar]
- 23.Wilson SL, Kalinovsky A, Orvis GD, Joyner AL. Spatially restricted and developmentally dynamic expression of engrailed genes in multiple cerebellar cell types. Cerebellum. 2011;10(3):356–372. doi: 10.1007/s12311-011-0254-5. [DOI] [PMC free article] [PubMed] [Google Scholar]
- 24.Deans AE, Wadghiri YZ, Berrios-Otero CA, Turnbull DH. Mn enhancement and respiratory gating for in utero MRI of the embryonic mouse central nervous system. Magn Reson Med. 2008;59(6):1320–1328. doi: 10.1002/mrm.21609. [DOI] [PMC free article] [PubMed] [Google Scholar]
- 25.Erikson KM, Dorman DC, Fitsanakis V, Lash LH, Aschner M. Alterations of oxidative stress biomarkers due to in utero and neonatal exposures of airborne manganese. Biol Trace Elem Res. 2006;111(1–3):199–215. doi: 10.1385/BTER:111:1:199. [DOI] [PubMed] [Google Scholar]
- 26.Nieman BJ, Flenniken AM, Adamson SL, Henkelman RM, Sled JG. Anatomical phenotyping in the brain and skull of a mutant mouse by magnetic resonance imaging and computed tomography. Physiol Genomics. 2006;24(2):154–162. doi: 10.1152/physiolgenomics.00217.2005. [DOI] [PubMed] [Google Scholar]
- 27.Nieman BJ, Lerch JP, Bock NA, Chen XJ, Sled JG, Henkelman RM. Mouse behavioral mutants have neuroimaging abnormalities. Hum Brain Mapp. 2007;28(6):567–575. doi: 10.1002/hbm.20408. [DOI] [PMC free article] [PubMed] [Google Scholar]
- 28.Lerch JP, Carroll JB, Spring S, Bertram LN, Schwab C, Hayden MR, Henkelman RM. Automated deformation analysis in the YAC128 Huntington disease mouse model. Neuroimage. 2008;39(1):32–39. doi: 10.1016/j.neuroimage.2007.08.033. [DOI] [PubMed] [Google Scholar]
- 29.Lau JC, Lerch JP, Sled JG, Henkelman RM, Evans AC, Bedell BJ. Longitudinal neuroanatomical changes determined by deformation-based morphometry in a mouse model of Alzheimer's disease. Neuroimage. 2008;42(1):19–27. doi: 10.1016/j.neuroimage.2008.04.252. [DOI] [PubMed] [Google Scholar]
- 30.Ellegood J, Pacey LK, Hampson DR, Lerch JP, Henkelman RM. Anatomical phenotyping in a mouse model of fragile X syndrome with magnetic resonance imaging. Neuroimage. 2010;53(3):1023–1029. doi: 10.1016/j.neuroimage.2010.03.038. [DOI] [PubMed] [Google Scholar]
- 31.Ellegood J, Lerch JP, Henkelman RM. Brain abnormalities in a Neuroligin3 R451C knockin mouse model associated with autism. Autism Res. 2011;4(5):368–376. doi: 10.1002/aur.215. [DOI] [PubMed] [Google Scholar]
- 32.Ellegood J, Henkelman RM, Lerch JP. Neuroanatomical Assessment of the Integrin beta3 Mouse Model Related to Autism and the Serotonin System Using High Resolution MRI. Front Psychiatry. 2012;3:37. doi: 10.3389/fpsyt.2012.00037. [DOI] [PMC free article] [PubMed] [Google Scholar]
- 33.Ali AA, Dale AM, Badea A, Johnson GA. Automated segmentation of neuroanatomical structures in multispectral MR microscopy of the mouse brain. Neuroimage. 2005;27(2):425–435. doi: 10.1016/j.neuroimage.2005.04.017. [DOI] [PubMed] [Google Scholar]
- 34.Badea A, Ali-Sharief AA, Johnson GA. Morphometric analysis of the C57BL/6J mouse brain. Neuroimage. 2007;37(3):683–693. doi: 10.1016/j.neuroimage.2007.05.046. [DOI] [PMC free article] [PubMed] [Google Scholar]
- 35.Maheswaran S, Barjat H, Bate ST, Aljabar P, Hill DL, Tilling L, Upton N, James MF, Hajnal JV, Rueckert D. Analysis of serial magnetic resonance images of mouse brains using image registration. Neuroimage. 2009;44(3):692–700. doi: 10.1016/j.neuroimage.2008.10.016. [DOI] [PubMed] [Google Scholar]
Associated Data
This section collects any data citations, data availability statements, or supplementary materials included in this article.


