

Abstract
Purpose
Phase images obtained by gradient-recalled echo (GRE) MRI provide new contrast in the brain that is distinct from that obtained with conventional T1-weighted and T2-weighted images. The results are especially intriguing in white matter where both signal amplitude and phase display anisotropic properties. However, the biophysical origins of these phenomena are not well understood. The goal of this paper is to provide a comprehensive theory of GRE signal formation based on a realistic model of neuronal structure.
Methods
We use Maxwell equations to find the distribution of magnetic field induced by myelin sheath and axon. We account for both anisotropy of neuronal tissue “magnetic micro-architecture” and anisotropy of myelin sheath magnetic susceptibility.
Results
Model describes GRE signal comprising of three compartments – axonal, myelin and extracellular. Both axonal and myelin water signals have frequency shifts that are affected by the magnetic susceptibility anisotropy of long molecules forming lipid bi-layer membranes. These parts of frequency shifts reach extrema for axon oriented perpendicular to the magnetic field and are zeros in a parallel case. Myelin water signal is substantially non-monoexponential.
Conclusion
Both, anisotropy of neuronal tissue “magnetic micro-architecture” and anisotropy of myelin sheath magnetic susceptibility, are important for describing GRE signal phase and magnitude.
Keywords: Gradient Echo, Phase contrast, White Matter, tissue anisotropy, magnetic susceptibility
INTRODUCTION
Phase images obtained by gradient-recalled echo MRI provide new contrast in the brain at high magnetic fields that is distinct from that obtained with conventional T1-weighted and T2-weighted images (1–5). However, the biophysical origins of the phase (frequency) contrast are not well understood yet and different contributions have been examined. They are: susceptibility effects induced due to the difference in magnetic susceptibilities of tissue chemical components such as iron (6–8), deoxyhemoglobin (9,10), proteins (11,12), and myelin (13,14), and magnetization exchange effects between “free” water and macromolecules (2,15,16). Myelin was proposed as one of the main contributors to MR signal phase in white matter (7) and it was demonstrated that demyelination leads to a loss of phase contrast between white matter (WM) and gray matter (GM) (13,14). This could have been explained by the difference in tissue cellular/molecular content (iron, lipids and proteins) between GM and WM. Yet it was also reported that the phase contrast is practically absent between WM and CSF (1,17) despite substantial differences in their molecular content.
To decipher information contained in phase images, we need to understand how underlying tissue microstructure at the cellular and sub-cellular levels affects MR signal phase. A traditional point of view relates MR signal frequency shift due to the local environment containing magnetic susceptibility inclusions (iron, proteins, lipids, etc.) with magnetic susceptibility χ by means of Lorentzian sphere approximation (18):
| [1] |
where f0 is the base Larmor frequency (f0 = γ B0) for a nuclide with gyromagnetic ratio γ (42.57 MHz/T for hydrogen nuclei in water). Since biological tissues are mostly water, it is convenient to reference frequency of MR signal in biological tissue to that of pure water. All magnetic susceptibilities used in this paper are differences between volume magnetic susceptibilities of a tissue (water + inclusions) and that of water. The list of all the susceptibilities used in this paper is given in Appendix.
As it was proposed in (17) and confirmed by computer simulations in (19), the local contribution to the MRI signal phase does not directly depend on the bulk magnetic susceptibility of the tissue, but on the “magnetic micro-architecture” of the tissue – i.e., the distribution of magnetic susceptibility inclusions (lipids, proteins, iron, etc.) at the cellular and sub-cellular levels. This effect is especially important for anisotropically arranged cellular structures such as axons. For such structures the relationship in Eq. [1] describing the effect of Lorentzian sphere is not valid and should be substituted by the expression followed from Generalized Lorentzian Approach (GLA) (17):
| [2] |
where χiso is a contribution to tissue magnetic susceptibility from isotropically distributed components of cellular structures (free floating organelles, proteins, lipids, etc), χL is a contribution to tissue magnetic susceptibility from longitudinally arranged components (neurofilaments, myelin sheath, etc.) and α is the angle between direction of the main magnetic field B0 and orientation of neuronal fibers. In contrast to the standard Lorentzian sphere approach, GLA takes into account cylindrical symmetry of neuronal fibers by introducing a concept of Lorentzian cylinder described by the second term in Eq. [2] (see details in (17) and (19)).
Equation [2] describes the local contribution of magnetic susceptibility effects to the MR signal frequency shift. An additional factor that contributes to the frequency shift is the object's (specifically, WM tracks) general external shape: Δf//f0|shape = SF · χ, where the shape factor SF describes the contribution from non-local magnetic susceptibility effects. As shown in (17,19), a combination of GLA and SF factors for axonal fiber bundles of circular cross section, leads to cancellation of the contribution from longitudinal structures to the frequency shift:
| [3] |
where χiso stands for susceptibility of isotropically distributed magnetic susceptibility inclusions. As demonstrated in (17), Eq. [3] effectively takes into account the presence of multiple longitudinally arranged axonal fibers. This result of GLA explained the “WM darkness effect” (17), (19) – the lack of phase contrast between WM and CSF despite substantial differences in their molecular content. The important consequence of Eqs. [2]–[3] is anisotropy of phase contrast in WM – correlation between MR signal phase and orientation of neuronal fibers with respect to main magnetic field B0. Such a correlation was indeed reported in (20,21).
While Eqs. [2]–[3] predict anisotropic behavior of phase contrast due to cylindrical symmetry in the arrangement of WM fibers, two groups (22–24) suggested that the magnetic susceptibility of WM can be anisotropic by itself. A basis for this phenomenon can be found in an elegant work of Lounila et al (25) who demonstrated the presence of magnetic susceptibility anisotropy in highly ordered radially-oriented long-chain molecules in the lipoprotein particles. As shown in (25), the presence of a layer formed by highly radially-oriented long-chain lipoprotein molecules surrounding a central compartment leads to a non-zero frequency shift in this compartment. A similar effect was reported recently in (26) for a cylindrical case. The goal of this paper is to incorporate this effect in GLA, thus providing a comprehensive theory of MR signal formation in neurons.
We explore a three-compartment model of neuronal fibers comprising intracellular (axonal), extracellular and myelin water. A need to describe transverse MR signal decay in terms of multiple compartments has been long recognized starting from the pioneering work of MacKay et al (27) for spin echo (SE) experiments. For gradient recalled echo (GRE) experiments, the importance of these compartments was re-emphasized in recent publications by He and Yablonskiy (28), Hwang et al (29), and van Gelderen et al (30).
In this manuscript we derived expressions for the frequency shifts of the MR signal from water in all three compartments (see Figure 1 and notations therein):
| [4] |
| [5] |
The expression for a frequency shift in the extracellular space is unaffected and remains the same as in Eq.[3]. Here Δχ is the difference between longitudinal and transverse components of magnetic susceptibility of lipoprotein layers in myelin sheath (see details below), and describe magnetic susceptibilities of isotropically distributed structures within the axon and myelin water, respectively. Importantly, the first terms in Eqs. [4]–[5] are solely due to the anisotropy Δχ.
Figure 1.
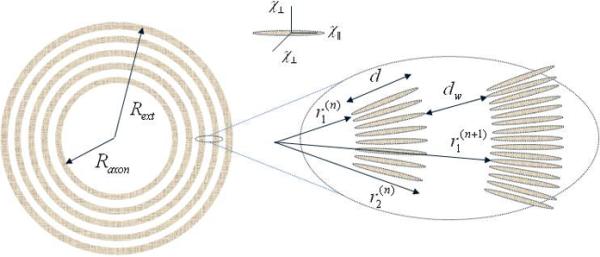
A schematic structure of an axon with radius Raxon surrounded by a myelin sheath consisting of interleaved bilayer membranes (marked in grey) separated by aqueous layers that alternate between the cytoplasmic and extracellular fluids (they are not distinguished herein). Each myelin bi-layer is formed by highly organized radially-oriented long molecules (shown as ellipsoids in inset) with presumed anisotropic magnetic susceptibility.
Our theory also predicts that the time course of GRE signal from myelin water cannot be described in terms of a simple T2* decay. For short GRE times it is Gaussian and for long GRE time it might exhibit a sinc-function-type oscillations.
METHODS
The myelin sheath is a multilamellar membrane surrounding the axons of neurons in central and peripheral nerve systems. It consists of repeating units of double bilayers (average thickness d about 4.5 nm (31)) separated by aqueous layers that alternate between the cytoplasmic and extracellular fluid content, e.g. (31–33). As the thicknesses of two types of aqueous layers, dw, are practically the same (on average dw is about 2.5 nm (31)), in what follows we will not distinguish between them. We model a neuron as a long cylinder of radius Rext consisting of an axon of radius Raxon surrounded by a myelin sheath comprising thin lipoprotein layers swirled around the axon and separated by water layers, see Fig. 1. As the thickness of each layer is much smaller than Raxon, we can simplify the spiral structure of the myelin sheath and consider its cross section in the plane perpendicular to the axon principal axis as a set of concentric interleaved myelin and aqueous rings.
Magnetic field induced by a single myelin layer
Let us first consider a single ring with internal and external radii r1 and r2, respectively, immersed in water. It is well known that if the magnetic susceptibility of such a structure is isotropic, the induced magnetization M within the ring is homogeneous and parallel to the external magnetic field B0. This magnetization induces a secondary (induced) magnetic field, which is equal to 0 inside the inner circle (at r < r1) and inhomogeneous magnetic field outside the outer circle (at r > r2) similar to the field induced by a homogeneously magnetized cylinder. As we will show below, this situation is different for the field induced by lipoprotein layers in the myelin due to their anisotropic structure.
According to (32), the myelin sheath comprises the layers filled with long lipoprotein molecules, which are radially oriented within the layers. Similar to the effect demonstrated in (25) for the lipoprotein particles, such a geometric ordering of these molecules may lead to anisotropic magnetic susceptibility of the ring material: , where and are the susceptibilities parallel and perpendicular to the radius vector r, see Fig. 1. In an external magnetic field B0, this anisotropic susceptibility leads to an inhomogeneous ring magnetization M = M(r) with the following components in the cylindrical coordinates (r, φ, z):
| [6] |
where α is the angle between the external magnetic field B0 and the axonal principal axis (z), the polar angle φ is counted from the direction of B0⊥ - the projection of the external field B0 on the plane perpendicular to the axon's principal axis.
In its turn, the magnetization M induces the secondary magnetic field h = h(r) that can be found from Maxwell equations (CGS units are used):
| [7] |
where Φ is the magnetostatic potential.
The potential Φ does not depend on coordinate z and can be readily found from Eqs. [6]–[7]:
| [8] |
where
| [9] |
The induced magnetic field h(r) inside and outside of the ring can be presented as:
| [10] |
| [11] |
where h|| and h⊥ are the components of h in the transverse plane along and perpendicular to B0⊥, respectively (hz = 0 everywhere). Hence, the induced magnetic field h outside the ring (r > r2) is the same as the field of a homogeneously magnetized cylindrical shell with an effective isotropic susceptibility . The anisotropic susceptibility leads to the non-zero induced field inside the ring (r < r1), which turns out to be parallel to B0⊥. Importantly, this field is homogeneous and depends on the ratio r2 / r1.
Magnetic Field Induced by a Neuronal Fiber
Let us now consider a neuron with the myelin sheath comprising N lipoprotein layers of the thickness d, separated by the water N −1 layers of thickness dw (see Fig. 1). In the cross section perpendicular to the axon principal axis, the layers forms concentric rings, the n-th lipoprotein ring (n = 1, 2, …, N) having the internal and external radii
| [12] |
Obviously, , .
We are interested in the projection of the induced field on B0, which is h|| (recall that hz = 0). Consider first the contribution of the lipoprotein layers with anisotropic magnetic susceptibility components and . The contribution of the lipoprotein layers with k < n to the field within the n-th water layer is described by the second line in Eq. [10], whereas the contribution of the lipoprotein layers with k ≥ n to the field in the n-th water layer is described by the first line in Eq. [10]. Hence, the field h|| = h||(r, φ) induced by all the lipoprotein layers within the n-th water layer is equal to
| [13] |
The expressions in Eq. [13] for the field h|| can be simplified by taken into account that the thickness of the layers is much smaller than their radii, :
| [14] |
A magnetic field induced by the lipoprotein layers inside the axon is homogeneous and is equal to:
| [15] |
This result is dramatically different from that in the case of a cylindrical shell with isotropic susceptibility when a corresponding induced field inside the shell (r < Raxon) is zero.
So far we have considered a magnetic field created by the lipoprotein layers of the myelin sheath. An additional field is induced by axonal tissue with magnetic susceptibility ( corresponds to magnetic susceptibility of longitudinally arranged neurofilaments1) and by water layers in the myelin sheath, containing isotropically distributed susceptibility inclusions with susceptibility . This additional field, Δh||, can be calculated in a similar way as above:
| [16] |
As the thickness of the lipoprotein and water layers is much smaller than their radii, the summation in Eqs. [14]–[16] can be substituted by integration, and the total magnetic field induced by the myelin sheath within the central axon can be written as
| [17] |
Importantly, this field is homogeneous and the contribution to it from the myelin sheath is not zero only if the susceptibility of myelin sheath is anisotropic, Δχ ≠ 0.
The field within the water layers in myelin sheath is inhomogeneous:
| [18] |
The field outside the axon (r > Rext), despite the anisotropic character of the susceptibility in the myelin sheath, is described by an expression that is similar to that for a field induced by a magnetized cylinder of radius Rext with an isotropic magnetic susceptibility:
| [19] |
where is susceptibility of isotropically distributed inclusions in the extracellular space, and χfiber is an effective magnetic susceptibility of the whole fiber:
| [20] |
The induced magnetic field leads to a shift in the local Larmor frequency of the hydrogen nuclei in water molecules (Δf)local (the index “local” is added to distinguish this local Larmor frequency shift from the frequency shift of the MR signal, see below):
| [21] |
where the magnetic fields h∥ and Δh∥ in different compartments are given by Eqs. [17]–[19], and δ f is the contribution from the local environment containing magnetic susceptibility inclusions, Eq. [2].
RESULTS
The time course of MR signal S(t) in the three-compartment system under consideration can be presented as a sum of the signals from the axon, Saxon, from the myelin sheath, Smyelin, and from the external space, Sext:
| [22] |
where t is a time after RF pulse (GRE time).
All the above equations for the induced magnetic fields were derived for a single neuronal fiber. As the magnetic field outside a fiber is not affected by anisotropic nature of myelin magnetic susceptibility, the effect of multiple fibers on MR signal frequency is exactly the same as for the case of multiple homogeneously magnetized fibers. According to GLA, the presence of cylindrically arranged fiber bundles does not affect MR signal (see details in (17)). Therefore we can restrict our consideration to a single fiber.
As the local Larmor frequency shift within the axon is homogeneous, Eqs. [17], [21], it does not result in an additional signal attenuation; hence the axonal signal can be presented as follows:
| [23] |
where R2axon is transverse relaxation rate constant of axonal water and the signal frequency shift Δfaxon is
| [24] |
Importantly, in contrast to Eq. [17] for the induced magnetic field within the axon, Eq. [24] has contribution only from isotropically distributed susceptibility inclusions with the magnetic susceptibility , not the total axonal susceptibility .
The local Larmor frequency shift in the external space is inhomogeneous, Eqs.[19]. As already mentioned above, it has a form of that induced by homogeneously magnetized cylinder with the “effective” magnetic susceptibility χfiber, Eq. [20]. Since for each given r the average of the terms in (Δf)local proportional to cos2φ is zero, the contribution of these terms in the case of fast diffusion will be zero for arbitrary direction of the external magnetic field B0 (in accordance with GLA (17)). Thus, in this motional averaging regime, Sext (t) can be presented as:
| [25] |
where R2ext is the transverse relaxation rate constant of extra-axonal water, and
| [26] |
The next approximation to the “extreme” motional averaging regime can be obtained in the framework of Gaussian phase approximation that takes into account diffusion of water molecules in an inhomogeneous field created by the myelin. Corresponding formulas can be readily obtained from (34,35) with the substitution of magnetic susceptibility in Eq. [20]. In the opposite case, when water molecules would be trapped in their positions in the extracellular space, the signal decay can be described in terms of the static dephasing regime (36) and Eq. [25] should be multiplied by a factor described by Eqs. [35–38] in (36). The intermediate regime has also been studied in (37,38).
Consider now the MR signal from the water in myelin compartment, Smyelin, that we present as:
| [27] |
where R2myelin is the transverse relaxation rate constant of myelin water that would exist in the absence of inhomogeneous field, smyelin (t) describes a modification of myelin water GRE signal due to the presence of inhomogeneous local Larmor frequency distribution in this compartment. First we consider the case of the static dephasing regime (36) in which water molecules are trapped and cannot move either between or along the myelin layers. In this case, the myelin signal attenuation due to the dephasing processes can be presented in the form:
| [28] |
where is the myelin sheath cross section area, myelin Δfmyelin is given by
| [29] |
After integration over φ, the signal from the myelin sheath can be written in the form:
| [30] |
where J0 is the Bessel function and other notations are:
| [31] |
Note that the parameter q1 (q1 ∈ [0,1]) is defined in such a way that q1 = 0 corresponds to the case when the parameter χeff is completely determined by the difference (), whereas q1 = 1 corresponds to the case when χeff is completely determined by (). The parameter q2 may vary in a broad interval.
It is convenient to represent signal in Eq. [30] as:
| [32] |
where A(t) and ΔΦ(t) are signal amplitude and the part of the phase additional to that described by GLA (the last factor in Eq. [32]). In the case of fast diffusion inside the aqueous layers, the water molecules sample all possible angles φ whereas their radial position remains practically the same. Thus, the phase accumulated along the diffusion trajectory and related to the cos2φ-term in Eq. [29] is averaged out, and the signal smyelin (t) can be calculated in the closed form:
| [33] |
where
| [34] |
For this case of fast diffusion, the amplitude A and the total phase Φ in Eq. [32] are given as
| [35] |
| [36] |
Figures 2 and 3 illustrate the signal from myelin water as a function of dimensionless time τ. Figure 2 corresponds to the case of fast diffusion when only susceptibility anisotropy contributes to the signal decay, Eq. [35]. Figure 3 corresponds to the case of static dephasing regime but without contribution of magnetic susceptibility anisotropy (q2 = 0).
Figure 2.

The signal magnitude from myelin sheath as a function of dimensionless time τ, Eq.[31], at different q2 (shown by numbers by the lines) for the case of fast diffusion when only susceptibility anisotropy contributes to the signal decay.
Figure 3.
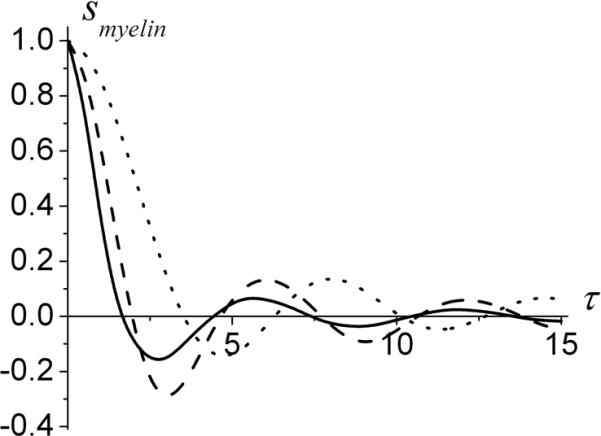
The signal from myelin sheath in a static dephasing regime but without contribution of magnetic susceptibility anisotropy (q2=0) as a function of dimensionless time τ, Eq.[31], for different q1. Solid line - q1=0, dashed line - q1=0.5, dotted line - q1=1. Note that for q2=0 the imaginary part of the signal is zero.
In the short-time regime, when |q1,2| << 1 the amplitude and phase of the signal for the general case in Eq. [30] have the form:
| [37] |
where
| [38] |
Note that in the linear in τ approximation, the function ΔΦ in Eq. [37] is determined only by the susceptibility anisotropy Δχ. In this time interval the phase of MR signal from myelin water can be described in standard manner in terms of frequency shift Δfmyelin :
| [39] |
Using Eqs. [32], [37], and [38], we can approximate the myelin water signal at short times as
| [40] |
Importantly, this signal decays for short times as quadratic exponential (Gaussian) rather than a linear exponential (Lorentzian) function and cannot be described in terms of T2* decay.
DISCUSSION
In this paper we have developed a comprehensive theory of Gradient Echo MRI signal formation in the presence of magnetic susceptibility effects induced by neuronal fibers. We have derived equations describing evolution of MR signal magnitude as well as phase. This theory should help in better understanding of different cellular contributions to MRI signal both in health and disease. It might be especially important for new and fast developing field of quantitative susceptibility mapping, QSM, (e.g. (23,39–44)), where anisotropic effects are not taken into account yet. It is also important for a so-called Susceptibility Tensor Imaging (23) that takes into account a global anisotropy of magnetic susceptibility but has not incorporated yet effects of anisotropic tissue microstructure (17) that modify the relationship between MR signal phase and tissue magnetic susceptibility, Eq. [2], and effects of radial ordering of long-chain molecules in lipoprotein layers discussed in the current paper. One can also argue that such effects are important for a Susceptibility Weighted Imaging (SWI) (45,46) that explores information from both phase and T2* tissue properties.
Our results provide specific dependences of frequency shifts on myelin geometric parameters; hence they might be helpful in deciphering WM tissue microstructure and changes that take place in different diseases. For example, it was demonstrated in (19) that myelin structural disordering in MS leads to increase in MR signal frequency because of a “redistribution of contributions” to Lorentzian signal frequency shift in Eq. [2] – longitudinally arranged myelin becomes disordered and contributes to isotropic part of tissue magnetic susceptibility. This effect can be even more enhanced due to an additional frequency shift predicted in this paper and described by the first term in Eq. [4] because it will also “disappear” if myelin sheath is structurally damaged.
Quantitative comparison of our predictions and experimental data is not possible at this time due to a lack of information on the susceptibility parameters , Δχ, , etc. However, a contribution of susceptibility anisotropy Δχ to the frequency shift in the axon, described by the first term in Eq.[24], can be estimated by using the value of Δχ in lipoprotein particles found in (25): Δχ ≈ −16ppb (which corresponds to Δχ ≈ −0.2ppm in SI units). Assuming typical values of axon and myelin sheath sizes, d = 4.5 nm, dw = 2.5 nm, Raxon = 1μm, Rext = 2μm, the contribution of the Δχ -term to the frequency shift in the axon is (for α = π / 2)
For B0 = 3T, it gives Δf = −5.6Hz, which is in agreement with a result of He and Yablonskiy (28) who found frequency shift in WM at 3T of about 5 Hz. In their experiment GESSE (gradient echo sampling of spin echo) sequence was employed with spin echo time of 60 ms. Under this condition, the myelin water signal with short T2* is already dead and only two components – intracellular and extracellular contributed to the GESSE signal evolution. This result is also consistent with measurements by Bender and Klose (47) who reported an average frequency shift at 3T in WM of about 4 Hz.
Chadzynski et al (48) conducted spectroscopy experiments in human brain and demonstrates that there are tissue-specific differences between frequency distances of water and metabolites that were biggest for NAA. This difference can be explained by a multi-compartment structure of the signal from neuronal fibers. Indeed, since NAA resides mostly in the axons, its signal represents a “pure” axonal signal described by a frequency shift in Eq. [4]. At the same time, water signal is a mixture of axonal and extracellular signals that were not distinguished in (48). Hence the water signal frequency is a weighted average of axonal frequency described by Eq. [4] and extracellular frequency described by Eq. [26].
Information on the frequency shift of myelin water signal can be found in paper by van Gelderen et al (30) who reported that at high field and short gradient echo times signal evolution requires three components with different frequencies. They found that the component with a short T2* of about 6 ms at 7T (presumably myelin water) had frequency shift of 36 Hz. By making use of Eq. [39] and parameters of myelin structure provided above, we can estimate that
For 7T experiment that would give a frequency shift of 14 Hz which is twice smaller as compared to reported in (30). The difference can be attributed to multiple reasons: (a) Δχ in myelin can be bigger than in lipoprotein particles; (b) our result for myelin water frequency shift is obtained under assumption of circular cylindrical shape of the axon while deviation from this shape might change this result, though we would not expect a big difference; (c) contribution of isotropic components in Eq. [39] could be compared to contribution of myelin anisotropy; (d) data in (30) were analyzed under assumption of simple T2* decay while our results predict that myelin water signal decay curve is more complicated (see Eqs. [30]–[38]); (e) we should also mention that measurement of this frequency shift is notoriously difficult due to the very short T2* of myelin water component (about 6 ms (30)).
Comparison is also due between our results and a method of susceptibility tensor imaging proposed by Liu (23). In his approach the assumption is made that the magnetic susceptibility of tissue is anisotropic but the local (Lorentzian) frequency shift can still be described in terms of Lorentzian sphere approximation. This approach is clearly inconsistent with our exact results. Consider for example a simplified situation when only myelin contributes to the tissue magnetic susceptibility and the axonal axis is parallel to the external magnetic field B0 (α = 0). Our result in Eq. [24] predicts that the frequency shift in this case is zero. This is an obvious conclusion because it follows from Maxwell equations that a long cylinder parallel to the magnetic field does not induce any magnetic field outside itself. On the other hand, an approach proposed by Liu suggests that the frequency shift in this situation is
where χ⊥ is a transverse component of long chain molecules (Fig. 1), and ς is a volume fraction of myelin. This frequency shift is non-zero which contradicts both our result and Maxwell equations.
Another important issue is anisotropy of WM transverse relaxation rate constant R2*=1/T2*. This effect was reported in a number of publications (20,22,49–53) and even was proposed as a tool for WM fiber orientation mapping (54,55). To compare our results with experimental data we first note that for multi-compartment structure of the neuron, R2* per se is not unambiguous parameter for defining GRE signal decay. By making use of Eq. [22] we can define R2* as:
| [41] |
Due to a rather complicated structure of signal in Eq. [22], that is a sum of decaying and oscillating components, this result depends not only on the combination of transverse relaxation rates of these components (R2axon, R2myelin, R2ext) but also on the shape of myelin water signal dephasing and the frequency shifts between these compartments. As a result, it also becomes GRE time TE dependent. Hence, comparison of our theory with experimental data would require more detailed measurements as compared to currently published data. Though we should notice that the angular dependence of such a defined R2* can be rather complicated and cannot always be described as a linear function of sin2α which could probably explain the result reported by Lee et al (54).
We should also mention that a multi-compartment nature of water signal with different compartment frequencies leads to a non-linear dependence of signal phase on GRE echo time – the effect directly observed by Wharton and Bowtell (56). This brings additional challenges for interpretation of measured MR signal phase and its relationship to underlying tissue magnetic susceptibility that is used in quantitative susceptibility mapping techniques (23,39–44).
CONCLUSION
Our theoretical results show that both, anisotropy of neuronal fibers' “magnetic micro-architecture” and anisotropy of myelin sheath magnetic susceptibility, are important for describing GRE signal phase and magnitude. Our model describes GRE signal comprising of three compartments – axonal, myelin and extracellular. Both axonal and myelin water signals have frequency shifts that are affected by the magnetic susceptibility anisotropy of long lipoprotein molecules forming bi-layer membranes. These parts of frequency shifts reach extrema for axon oriented perpendicular to the magnetic field and are zeros in a parallel case. Myelin water signal is substantially non-monoexponential.
ACKNOWLEDGEMENT
The authors are thankful to Drs. Jie Lou, Xiang He and Anne Cross for stimulating discussions. This work was supported by NIH grant R01NS055963 and NMSS grant RG 4463A18.
Appendix
List of notations for susceptibilities used in the text.
All magnetic susceptibilities used in this paper are differences between volume magnetic susceptibilities of a tissue (water + inclusions) and that of water.
χ - generic total susceptibility of a medium
χiso - generic susceptibility of isotropically distributed components in a medium
χL - generic susceptibility of longitudinally arranged components in a medium
- susceptibility of isotropically distributed components in axon
- susceptibility of isotropically distributed components in myelin water
- susceptibility of isotropically distributed components in extracellular space
- susceptibility of longitudinally oriented components in axon
χaxon - total susceptibility of an axon,
χ∥ - longitudinal susceptibility of lipoprotein layers
χ⊥ - transverse susceptibility of lipoprotein layers
Δχ = χ∥ − χ⊥
χfiber - total susceptibility of a fiber,
Footnotes
Generally speaking, can also be anisotropic. In this case, only the transverse component will enter all our equations instead of .
REFERENCES
- 1.Duyn JH, van Gelderen P, Li TQ, de Zwart JA, Koretsky AP, Fukunaga M. High-field MRI of brain cortical substructure based on signal phase. Proc Natl Acad Sci U S A. 2007;104(28):11796–11801. doi: 10.1073/pnas.0610821104. [DOI] [PMC free article] [PubMed] [Google Scholar]
- 2.Zhong K, Leupold J, von Elverfeldt D, Speck O. The molecular basis for gray and white matter contrast in phase imaging. Neuroimage. 2008;40(4):1561–1566. doi: 10.1016/j.neuroimage.2008.01.061. [DOI] [PubMed] [Google Scholar]
- 3.Marques JP, Maddage R, Mlynarik V, Gruetter R. On the origin of the MR image phase contrast: an in vivo MR microscopy study of the rat brain at 14.1 T. Neuroimage. 2009;46(2):345–352. doi: 10.1016/j.neuroimage.2009.02.023. [DOI] [PubMed] [Google Scholar]
- 4.Abduljalil AM, Schmalbrock P, Novak V, Chakeres DW. Enhanced gray and white matter contrast of phase susceptibility-weighted images in ultra-high-field magnetic resonance imaging. J Magn Reson Imaging. 2003;18(3):284–290. doi: 10.1002/jmri.10362. [DOI] [PubMed] [Google Scholar]
- 5.Rauscher A, Sedlacik J, Barth M, Mentzel HJ, Reichenbach JR. Magnetic susceptibility-weighted MR phase imaging of the human brain. AJNR Am J Neuroradiol. 2005;26(4):736–742. [PMC free article] [PubMed] [Google Scholar]
- 6.Hammond KE, Metcalf M, Carvajal L, Okuda DT, Srinivasan R, Vigneron D, Nelson SJ, Pelletier D. Quantitative in vivo magnetic resonance imaging of multiple sclerosis at 7 Tesla with sensitivity to iron. Ann Neurol. 2008;64(6):707–713. doi: 10.1002/ana.21582. [DOI] [PubMed] [Google Scholar]
- 7.Fukunaga M, Li TQ, van Gelderen P, de Zwart JA, Shmueli K, Yao B, Lee J, Maric D, Aronova MA, Zhang G, Leapman RD, Schenck JF, Merkle H, Duyn JH. Layer-specific variation of iron content in cerebral cortex as a source of MRI contrast. Proc Natl Acad Sci U S A. 2010;107(8):3834–3839. doi: 10.1073/pnas.0911177107. [DOI] [PMC free article] [PubMed] [Google Scholar]
- 8.Yao B, Li TQ, Gelderen P, Shmueli K, de Zwart JA, Duyn JH. Susceptibility contrast in high field MRI of human brain as a function of tissue iron content. Neuroimage. 2009;44(4):1259–1266. doi: 10.1016/j.neuroimage.2008.10.029. [DOI] [PMC free article] [PubMed] [Google Scholar]
- 9.Lee J, Hirano Y, Fukunaga M, Silva AC, Duyn JH. On the contribution of deoxy-hemoglobin to MRI gray-white matter phase contrast at high field. Neuroimage. 2010;49(1):193–198. doi: 10.1016/j.neuroimage.2009.07.017. [DOI] [PMC free article] [PubMed] [Google Scholar]
- 10.Petridou N, Wharton SJ, Lotfipour A, Gowland P, Bowtell R. Investigating the effect of blood susceptibility on phase contrast in the human brain. Neuroimage. 2010;50(2):491–498. doi: 10.1016/j.neuroimage.2009.12.052. [DOI] [PubMed] [Google Scholar]
- 11.He X, Zhu M, Yablonskiy DA. Validation of Oxygen Extraction Fraction Measurement by qBOLD Technique. Magn Reson Med. 2008;60(4):882–888. doi: 10.1002/mrm.21719. [DOI] [PMC free article] [PubMed] [Google Scholar]
- 12.Spees WM, Yablonskiy DA, Oswood MC, Ackerman JJ. Water proton MR properties of human blood at 1.5 Tesla: magnetic susceptibility, T(1), T(2), T*(2), and non-Lorentzian signal behavior. Magn Reson Med. 2001;45(4):533–542. doi: 10.1002/mrm.1072. [DOI] [PubMed] [Google Scholar]
- 13.Liu C, Li W, Johnson GA, Wu B. High-field (9.4 T) MRI of brain dysmyelination by quantitative mapping of magnetic susceptibility. Neuroimage. 2011;56(3):930–938. doi: 10.1016/j.neuroimage.2011.02.024. [DOI] [PMC free article] [PubMed] [Google Scholar]
- 14.Lodygensky GA, Marques JP, Maddage R, Perroud E, Sizonenko SV, Hüppi PS, Gruetter R. In vivo assessment of myelination by phase imaging at high magnetic field. Neuroimage. 2012;59(3):1979–1987. doi: 10.1016/j.neuroimage.2011.09.057. [DOI] [PubMed] [Google Scholar]
- 15.Luo J, He X, d'Avignon DA, Ackerman JJ, Yablonskiy DA. Protein-induced water 1H MR frequency shifts: contributions from magnetic susceptibility and exchange effects. J Magn Reson. 2010;202(1):102–108. doi: 10.1016/j.jmr.2009.10.005. [DOI] [PMC free article] [PubMed] [Google Scholar]
- 16.Shmueli K, Dodd SJ, Li TQ, Duyn JH. The contribution of chemical exchange to MRI frequency shifts in brain tissue. Magn Reson Med. 2011;65(1):35–43. doi: 10.1002/mrm.22604. [DOI] [PMC free article] [PubMed] [Google Scholar]
- 17.He X, Yablonskiy DA. Biophysical mechanisms of phase contrast in gradient echo MRI. Proc Natl Acad Sci U S A. 2009;106(32):13558–13563. doi: 10.1073/pnas.0904899106. [DOI] [PMC free article] [PubMed] [Google Scholar]
- 18.Chu SC, Xu Y, Balschi JA, Springer CS., Jr. Bulk magnetic susceptibility shifts in NMR studies of compartmentalized samples: use of paramagnetic reagents. Magn Reson Med. 1990;13(2):239–262. doi: 10.1002/mrm.1910130207. [DOI] [PubMed] [Google Scholar]
- 19.Yablonskiy DA, Luo J, Sukstanskii AL, Iyer A, Cross AH. Biophysical mechanisms of MRI signal frequency contrast in multiple sclerosis. Proc Natl Acad Sci U S A. 2012;109(35):14212–14217. doi: 10.1073/pnas.1206037109. [DOI] [PMC free article] [PubMed] [Google Scholar]
- 20.Denk C, Hernandez Torres E, MacKay A, Rauscher A. The influence of white matter fibre orientation on MR signal phase and decay. NMR Biomed. 2011;24(3):246–252. doi: 10.1002/nbm.1581. [DOI] [PubMed] [Google Scholar]
- 21.Luo J, He X, Yablonskiy DA. Magnetic susceptibility induced MR signal frequency shift in white matter - experimental comparison between Lorenzian sphere and generalized Lorenzian approaches. Proc. 20th ISMRM Annual Meeting; Melbourne, Australia. 2012. p. 415. [DOI] [PMC free article] [PubMed] [Google Scholar]
- 22.Lee J, Shmueli K, Fukunaga M, van Gelderen P, Merkle H, Silva AC, Duyn JH. Sensitivity of MRI resonance frequency to the orientation of brain tissue microstructure. Proc Natl Acad Sci U S A. 2010;107(11):5130–5135. doi: 10.1073/pnas.0910222107. [DOI] [PMC free article] [PubMed] [Google Scholar]
- 23.Liu C. Susceptibility tensor imaging. Magn Reson Med. 2010;63(6):1471–1477. doi: 10.1002/mrm.22482. [DOI] [PMC free article] [PubMed] [Google Scholar]
- 24.Li W, Wu B, Avram AV, Liu C. Magnetic susceptibility anisotropy of human brain in vivo and its molecular underpinnings. Neuroimage. 2012;59(3):2088–2097. doi: 10.1016/j.neuroimage.2011.10.038. [DOI] [PMC free article] [PubMed] [Google Scholar]
- 25.Lounila J, Ala-Korpela M, Jokisaari J, Savolainen MJ, Kesaniemi YA. Effects of orientational order and particle size on the NMR line positions of lipoproteins. Phys Rev Lett. 1994;72(25):4049–4052. doi: 10.1103/PhysRevLett.72.4049. [DOI] [PubMed] [Google Scholar]
- 26.Wharton S, Bowtell R. The Field Perturbation due to a Hollow Cylinder with radially-Oriented Anisotropic Magnetic SusceptibilityL A Model of the Myelin Sheath. Proc. 20th ISMRM Annual Meeting; Melbourne, Australia. 2012. p. 2363. [Google Scholar]
- 27.MacKay A, Whittall K, Adler J, Li D, Paty D, Graeb D. In vivo visualization of myelin water in brain by magnetic resonance. Magn Reson Med. 1994;31(6):673–677. doi: 10.1002/mrm.1910310614. [DOI] [PubMed] [Google Scholar]
- 28.He X, Yablonskiy DA. Quantitative BOLD: mapping of human cerebral deoxygenated blood volume and oxygen extraction fraction: default state. Magn Reson Med. 2007;57(1):115–126. doi: 10.1002/mrm.21108. [DOI] [PMC free article] [PubMed] [Google Scholar]
- 29.Hwang D, Kim DH, Du YP. In vivo multi-slice mapping of myelin water content using T2* decay. Neuroimage. 2010;52(1):198–204. doi: 10.1016/j.neuroimage.2010.04.023. [DOI] [PubMed] [Google Scholar]
- 30.van Gelderen P, de Zwart JA, Lee J, Sati P, Reich DS, Duyn JH. Nonexponential T(2) decay in white matter. Magn Reson Med. 2012;67(1):110–117. doi: 10.1002/mrm.22990. [DOI] [PMC free article] [PubMed] [Google Scholar]
- 31.Min Y, Kristiansen K, Boggs JM, Husted C, Zasadzinski JA, Israelachvili J. Interaction forces and adhesion of supported myelin lipid bilayers modulated by myelin basic protein. Proc Natl Acad Sci U S A. 2009;106(9):3154–3159. doi: 10.1073/pnas.0813110106. [DOI] [PMC free article] [PubMed] [Google Scholar]
- 32.Raine CS. In: Myelin. Morell P, editor. Plenum; New York: 1984. pp. 1–41. [Google Scholar]
- 33.Inouye H, Kirschner DA. Membrane interactions in nerve myelin. I. Determination of surface charge from effects of pH and ionic strength on period. Biophys J. 1988;53(2):235–245. doi: 10.1016/S0006-3495(88)83085-6. [DOI] [PMC free article] [PubMed] [Google Scholar]
- 34.Sukstanskii AL, Yablonskiy DA. Gaussian approximation in the theory of MR signal formation in the presence of structure-specific magnetic field inhomogeneities. J Magn Reson. 2003;163(2):236–247. doi: 10.1016/s1090-7807(03)00131-9. [DOI] [PubMed] [Google Scholar]
- 35.Sukstanskii AL, Yablonskiy DA. Gaussian approximation in the theory of MR signal formation in the presence of structure-specific magnetic field inhomogeneities. Effects of impermeable susceptibility inclusions. J Magn Reson. 2004;167(1):56–67. doi: 10.1016/j.jmr.2003.11.006. [DOI] [PubMed] [Google Scholar]
- 36.Yablonskiy DA, Haacke EM. Theory of NMR signal behavior in magnetically inhomogeneous tissues: the static dephasing regime. Magn Reson Med. 1994;32(6):749–763. doi: 10.1002/mrm.1910320610. [DOI] [PubMed] [Google Scholar]
- 37.Kiselev VG, Posse S. Analytical model of susceptibility-induced MR signal dephasing: effect of diffusion in a microvascular network. Magn Reson Med. 1999;41(3):499–509. doi: 10.1002/(sici)1522-2594(199903)41:3<499::aid-mrm12>3.0.co;2-o. [DOI] [PubMed] [Google Scholar]
- 38.Dickson JD, Ash TW, Williams GB, Sukstanskii AL, Ansorge RE, Yablonskiy DA. Quantitative phenomenological model of the BOLD contrast mechanism. J Magn Reson. 2011;212(1):17–25. doi: 10.1016/j.jmr.2011.06.003. [DOI] [PMC free article] [PubMed] [Google Scholar]
- 39.de Rochefort L, Brown R, Prince MR, Wang Y. Quantitative MR susceptibility mapping using piece-wise constant regularized inversion of the magnetic field. Magn Reson Med. 2008;60(4):1003–1009. doi: 10.1002/mrm.21710. [DOI] [PubMed] [Google Scholar]
- 40.Liu T, Spincemaille P, de Rochefort L, Wong R, Prince M, Wang Y. Unambiguous identification of superparamagnetic iron oxide particles through quantitative susceptibility mapping of the nonlinear response to magnetic fields. Magn Reson Imaging. 2010;28(9):1383–1389. doi: 10.1016/j.mri.2010.06.011. [DOI] [PMC free article] [PubMed] [Google Scholar]
- 41.Shmueli K, De Zwart JA, Van Gelderen P, Li TQ, Dodd SJ, Duyn JH. Magnetic susceptibility mapping of brain tissue in vivo using MRI phase data. Magn Reson Med. 2009;62(6):1510–1522. doi: 10.1002/mrm.22135. [DOI] [PMC free article] [PubMed] [Google Scholar]
- 42.Schweser F, Deistung A, Lehr BW, Reichenbach JR. Differentiation between diamagnetic and paramagnetic cerebral lesions based on magnetic susceptibility mapping. Med Phys. 2010;37(10):5165–5178. doi: 10.1118/1.3481505. [DOI] [PubMed] [Google Scholar]
- 43.de Rochefort L, Liu T, Kressler B, Liu J, Spincemaille P, Lebon V, Wu J, Wang Y. Quantitative susceptibility map reconstruction from MR phase data using bayesian regularization: validation and application to brain imaging. Magn Reson Med. 2010;63(1):194–206. doi: 10.1002/mrm.22187. [DOI] [PubMed] [Google Scholar]
- 44.Schweser F, Sommer K, Deistung A, Reichenbach JR. Quantitative susceptibility mapping for investigating subtle susceptibility variations in the human brain. Neuroimage. 2011;62(3):2083–2100. doi: 10.1016/j.neuroimage.2012.05.067. [DOI] [PubMed] [Google Scholar]
- 45.Reichenbach JR, Venkatesan R, Schillinger DJ, Kido DK, Haacke EM. Small vessels in the human brain: MR venography with deoxyhemoglobin as an intrinsic contrast agent. Radiology. 1997;204(1):272–277. doi: 10.1148/radiology.204.1.9205259. [DOI] [PubMed] [Google Scholar]
- 46.Haacke EM, Mittal S, Wu Z, Neelavalli J, Cheng YC. Susceptibility-weighted imaging: technical aspects and clinical applications, part 1. AJNR Am J Neuroradiol. 2009;30(1):19–30. doi: 10.3174/ajnr.A1400. [DOI] [PMC free article] [PubMed] [Google Scholar]
- 47.Bender B, Klose U. Cerebrospinal fluid and interstitial fluid volume measurements in the human brain at 3T with EPI. Magn Reson Med. 2009;61(4):834–841. doi: 10.1002/mrm.21915. [DOI] [PubMed] [Google Scholar]
- 48.Chadzynski GL, Bender B, Groeger A, Erb M, Klose U. Tissue specific resonance frequencies of water and metabolites within the human brain. J Magn Reson. 2011;212(1):55–63. doi: 10.1016/j.jmr.2011.06.009. [DOI] [PubMed] [Google Scholar]
- 49.Wiggins C, Gudmundsdottir V, LeBihan D, Lebon V, Chaumeil M. Orientation dependence of white matter T2* contrast at 7T: a direct demonstration. Proc. 16th ISMRM Annual Meeting; Toronto, Canada. 2008. p. 237. [Google Scholar]
- 50.Schafer A, Bowtell R, Turner R. Orientation dependence of grey/white matter contrast in ultra high fields. Proc. 17th ISMRM Annual Meeting; Honolulu, HI. 2009. p. 2921. [Google Scholar]
- 51.Cherubini A, Peran P, Hagberg GE, Varsi AE, Luccichenti G, Caltagirone C, Sabatini U, Spalletta G. Characterization of white matter fiber bundles with T2* relaxometry and diffusion tensor imaging. Magn Reson Med. 2009;61(5):1066–1072. doi: 10.1002/mrm.21978. [DOI] [PubMed] [Google Scholar]
- 52.Bender B, Klose U. The in vivo influence of white matter fiber orientation towards B(0) on T2* in the human brain. NMR Biomed. 2010;23(9):1071–1076. doi: 10.1002/nbm.1534. [DOI] [PubMed] [Google Scholar]
- 53.Sati P, Silva AC, van Gelderen P, Gaitan MI, Wohler JE, Jacobson S, Duyn JH, Reich DS. In vivo quantification of T(2) anisotropy in white matter fibers in marmoset monkeys. Neuroimage. 2012;59(2):979–985. doi: 10.1016/j.neuroimage.2011.08.064. [DOI] [PMC free article] [PubMed] [Google Scholar]
- 54.Lee J, van Gelderen P, Kuo LW, Merkle H, Silva AC, Duyn JH. T2*-based fiber orientation mapping. Neuroimage. 2011;57(1):225–234. doi: 10.1016/j.neuroimage.2011.04.026. [DOI] [PMC free article] [PubMed] [Google Scholar]
- 55.Cohen-Adad J, Polimeni JR, Helmer KG, Benner T, McNab JA, Wald LL, Rosen BR, Mainero C. T(2)* mapping and B(0) orientation-dependence at 7 T reveal cyto- and myeloarchitecture organization of the human cortex. Neuroimage. 2012;60(2):1006–1014. doi: 10.1016/j.neuroimage.2012.01.053. [DOI] [PMC free article] [PubMed] [Google Scholar]
- 56.Wharton S, Bowtell R. Fiber orientation-dependent white matter contrast in gradient echo MRI. Proc Natl Acad Sci U S A. 2012 doi: 10.1073/pnas.1211075109. [DOI] [PMC free article] [PubMed] [Google Scholar]