

Abstract
Background
There is currently a contrast between the demonstrated benefits of fibrinogen concentrate in correcting bleeding and reducing transfusion, and its perceived thrombogenic potential. This analysis evaluates the effects of fibrinogen concentrate on coagulation up to 12 days after administration during aortic surgery.
Methods
We performed a post hoc analysis of a prospective, randomized, double-blind, controlled trial of fibrinogen concentrate as first-line haemostatic therapy in aortic surgery. After cardiopulmonary bypass (CPB) and protamine administration, subjects with coagulopathic bleeding received fibrinogen concentrate or placebo. The placebo group received allogeneic blood products, including fresh-frozen plasma (FFP; n=32); the fibrinogen concentrate group received fibrinogen concentrate alone (FC; n=14), or fibrinogen concentrate followed by allogeneic blood products (FC+FFP; n=15). Plasma fibrinogen, fibrin-based clotting (ROTEM®-based FIBTEM assay), and peri- and postoperative haematological and coagulation parameters were compared.
Results
Plasma fibrinogen and FIBTEM maximum clot firmness (MCF) decreased ∼50% during CPB but were corrected by FC or FC+FFP. At last suture, the highest values for plasma fibrinogen (360 mg dl−1) and FIBTEM MCF (22 mm) were within normal ranges—below the acute phase increases observed after surgery. In patients receiving only FFP as a source of fibrinogen, these parameters recovered marginally by last suture (P<0.001 vs FC and FC+FFP). All groups displayed comparable haemostasis at 24 h post-surgery. Fibrinogen concentrate did not cause alterations of other haemostasis parameters.
Conclusions
Fibrinogen concentrate provided specific, significant, short-lived increases in plasma fibrinogen and fibrin-based clot firmness after aortic surgery.
Keywords: blood coagulation tests, cardiopulmonary bypass, fibrin, fibrinogen, plasma
Editor's key points.
Fibrinogen concentrate can reduce bleeding and transfusion in aortic surgery, but there are concerns regarding its thrombogenicity.
In a post hoc analysis of a prior randomized clinical trial, fibrinogen concentrate increased plasma fibrinogen and clotting activity.
These effects were short-lived and were not associated with significant alterations in haemostatic parameters, which should be confirmed in larger multicentre studies.
There is a contrast between the demonstrated benefits of fibrinogen concentrate in correcting bleeding and reducing transfusion,1 and its perceived thrombogenic potential, reported either as an independent association between plasma fibrinogen and cardiovascular disease2,3 or as thromboembolic complications in afibrinogenaemia after fibrinogen supplementation.4,5 Given the latter, one might expect increased risk for thrombogenic complications after fibrinogen supplementation in perioperative bleeding, although current data do not support this. One explanation is that, paradoxically, afibrinogenaemia is itself a risk factor for thromboembolic complications, possibly through von Willebrand factor-induced platelet aggregation, increased thrombin generation, or the absence of fibrin's antithrombin I function.6
Further confusion arises from plasma fibrinogen concentration being variously described as a marker,2 predictor,3 and mediator of coronary conditions.7 As an acute-phase reactant, fibrinogen levels increase substantially after tissue injury, inflammation, infection, and atrial fibrillation.2 Sustained plasma fibrinogen elevation has also been reported after aortic surgery.8 It is important to distinguish between elevated plasma fibrinogen during an acute-phase response and that due to targeted fibrinogen supplementation. Thus, a crucial question is: how does a fibrinogen concentrate bolus impact the coagulation system after surgery, compared with standard therapy using fresh-frozen plasma (FFP)?
We performed a randomized, double-blind, placebo-controlled study of fibrinogen concentrate as first-line haemostatic therapy in aortic surgery. Efficacy analysis showed that fibrinogen concentrate reduced perioperative transfusion compared with placebo.9 All placebo group subjects received allogeneic blood products, including FFP as a source of fibrinogen. In the fibrinogen concentrate group, some subjects received fibrinogen concentrate as a sole source of fibrinogen, while others received fibrinogen concentrate and allogeneic blood products. Here, we provide a post hoc analysis of coagulation and haematological parameters recorded intraoperatively and after surgery. We aimed to determine whether fibrinogen concentrate induces large, long-lived increases in fibrinogen concentration and fibrin-based clotting, and also derangement of other coagulation parameters, compared with treatment with allogeneic blood components including FFP.
Methods
Study design and patient population
This single-centre, prospective, randomized, double-blind, parallel-group, placebo-controlled study was conducted at Hannover Medical School, Germany. It was approved by the local Ethics Committee and German Regulatory Authorities and conducted in accordance with the Declaration of Helsinki and Good Clinical Practice. The study was assigned Local Ethics Committee reference code 4891M-mono, EudraCT trial number 2007-004612-31, and clinicaltrials.gov identifier number NCT00701142. Details of study rationale, design, and patient selection have been published.9
Briefly, patients ≥18 yr old, undergoing elective aortic-replacement surgery involving cardiopulmonary bypass (CPB), were screened for eligibility (June 2008 to April 2010). Based on a power calculation for analysis of transfusion requirements, 60 subjects were planned; 80 patients were screened and randomized to the fibrinogen concentrate or placebo groups. An unblinded pharmacist bound by confidentiality agreement performed the randomization and prepared study medications. Randomization numbers were assigned sequentially, in a 1:1 ratio, block size of 4, stratified by surgery type. After signed consent was obtained, 61 subjects were included. Aortic valve operations with root/ascending aorta replacement, with or without aortic arch replacement, and thoracoabdominal replacements were included. Exclusion criteria included: patients with congenital or acquired (pre-surgery) coagulation disorders, previous surgery at the same site, stroke or myocardial infarction ≤2 months before surgery, and use of aspirin, clopidogrel, or vitamin K antagonists 2–5 days pre-surgery.
Procedures and groups
Details of surgical methods, measurement of coagulopathic bleeding, and the therapy algorithm have been published.9 Subjects randomized to receive fibrinogen concentrate (Haemocomplettan® P/RiaSTAP™, CSL Behring, Marburg, Germany) or placebo (0.9% saline) were administered individualized doses based on thromboelastometric measurement of fibrin-based clot firmness using the ROTEM®-based FIBTEM test. Medication was administered only if coagulopathic bleeding (defined as 5 min bleeding mass of 60–250 g) was observed immediately after CPB removal, protamine reversal of heparin, and surgical control of focal bleeding. Anaesthesiologists and surgical staff were blinded to study medication (fibrinogen concentrate or placebo), which was delivered in opaque syringes. The content of each syringe (either 50 ml of 0.9% saline as placebo or 1 g fibrinogen concentrate dissolved in 50 ml water for injection) was administered in less than 20 s. The median total dose was 8 g (minimum 3 g, maximum 14 g). If coagulopathic bleeding continued after administration of study medication, a transfusion algorithm was initiated. If platelet count was <100 000 µl−1, 2 units of apheresis platelet concentrate were administered; if platelet count was ≥100 000 µl−1, 4 units of FFP were administered. If a second transfusion cycle was needed, subjects received whichever of the two treatments they had not been given initially. Subsequently, treatment was with 1 unit of platelet concentrate and 2 units of FFP until the 5 min bleeding mass was <60 g.
Bleeding was arrested in 14 of 29 subjects who received fibrinogen concentrate; no further haemostatic therapy was administered (‘FC’ group). Coagulopathic bleeding continued in 15 of 29 subjects post-fibrinogen concentrate; FFP, platelet concentrate, or both were administered according to the treatment algorithm (‘FC+FFP’ group). This post hoc subdivision allowed assessment of differential responses after treatment using fibrinogen concentrate±FFP. All 32 placebo group subjects continued bleeding post-infusion and subsequently received FFP, with or without platelets, according to the treatment algorithm (‘FFP’ group).
Haematology and coagulation monitoring assays
Blood samples were drawn pre-study medication (before induction of anaesthesia, 20 min before removal of CPB, and after removal from CPB/administration of protamine) and post-study medication [after last suture, at 24 h (day 1), 48 h (day 2), and 8–12 days (day 10) after surgery]. Assays were performed at the study centre's laboratory by an unblinded technician bound by confidentiality agreement.
Laboratory coagulation tests
Tests were performed using a Sysmex® CA-7000 device (device and reagents obtained from Siemens Healthcare Diagnostics GmbH, Erlangen, Germany). Three millilitres of citrated blood were centrifuged; 1.5 ml of resulting plasma was used to determine plasma fibrinogen levels via the Clauss assay (Dade Thrombin Reagent). Remaining plasma was used to measure antithrombin (Innovance® Antithrombin Kit), factor II (FII; measured using FII-deficient plasma with Thromborel® S reagent), FV (FV-deficient plasma with Thromborel® S reagent), FVIII (Factor VIII Chromogenic Assay), FXIII (Berichrom® Factor XIII kit), prothrombin time (PT; Thromborel® S reagent), and activated partial thromboplastin time (aPTT; Pathromtin® SL reagent).
Thromboelastometric measurements
A viscoelastic point-of-care device (ROTEM®, Tem International GmbH, Munich, Germany) was used to perform two coagulation assays: an extrinsically activated test (EXTEM) using recombinant tissue factor (TF), and a fibrin clot test (FIBTEM) involving TF-induced activation plus cytochalasin D-mediated platelet inhibition. For each assay, 0.3 ml citrated whole blood was used. Parameters recorded for EXTEM were clotting time (CT; time elapsed from beginning of analysis until clot amplitude of 2 mm) and maximum clot firmness (MCF; maximum amplitude of clot). For FIBTEM, only MCF was recorded. The platelet component of clot elasticity was calculated from EXTEM and FIBTEM maximum clot elasticity values (EXTEM MCE–FIBTEM MCE), which were derived from MCF measurements as described previously.10
Haematological measures
Haemoglobin, haematocrit, and platelet count were recorded using a Sysmex® XE-2100 device (Siemens Healthcare Diagnostics GmbH). Blood was supplemented with ethylenediamine tetraacetic acid or heparin, or whole blood used depending on the time-point and evaluation.
Platelet function analysis
A multiple platelet function analyzer (Multiplate®, Verum Diagnostica GmbH, Munich, Germany) was used as described previously.11 Three platelet activation tests were performed, each using 0.3 ml hirudin-anticoagulated blood: (i) ADPtest (adenosine diphosphate), (ii) COLtest (collagen), and (iii) TRAPtest (thrombin receptor activating peptide-6).
Statistical analysis
Analysis of the primary and secondary endpoints is presented elsewhere.9 Here, we present post hoc assessments in which the FC group was subdivided to enable analysis of the effects of fibrinogen concentrate with or without FFP. Each pair of the three subgroups (FC vs FC+FFP; FC vs FFP; FC+FFP vs FFP) was compared at each time-point for each parameter. Data analyses were performed using Excel 2007 (Microsoft, Redmond, WA, USA) and Stata version 12.0 (StataCorp, College Station, TX, USA).
Data distributions were verified using the Kolmogorov–Smirnov test. For normally distributed variables, the mean and standard deviation (sd) were typically used as descriptive measures. Pairs of groups were compared using analysis of variance post hoc tests. If values were not normally distributed, the median and inter-quartile range (IQR) were used as descriptive measures; the Mann–Whitney U-test was used for between-group comparisons. Some variables were normally distributed but contained values which were beyond measurable boundaries. Such values preclude calculation of mean and sd; so, these data sets were analysed in the same way as non-normally distributed variables. As three comparisons were performed for each parameter at each time-point, the risk of obtaining significant results due to chance was increased. A Bonferroni adjustment was therefore applied; each P-value was multiplied by the number of comparisons (i.e. ×3).
Results
Group characteristics
Each group displayed characteristics typical for aortic surgery patients (Table 1). Most subjects were male, with similar mean ages, weights, and BMIs across groups. There were no important between-group differences in operation type.
Table 1.
Subject characteristics. AVAA, aortic valve with root/ascending aorta replacement; AVAA with arch, aortic valve with root/ascending aorta and aortic arch replacement; FC, fibrinogen concentrate; FFP, fresh-frozen plasma; n, total number of patients in the group; N, number of patients fulfilling given criteria; sd, standard deviation; TAAA, thoracoabdominal aortic aneurysm surgery
| FFP (n=32) | FC+FFP (n=15) | FC (n=14) | |
|---|---|---|---|
| Males (n, %) | 25 (78) | 11 (73) | 8 (57) |
| Mean age (range) (yr) | 61.1 (32–88) | 61.1 (34–76) | 57.1 (20–78) |
| Mean height (sd) (m) | 1.771 (0.102) | 1.793 (0.114) | 1.723 (0.139) |
| Mean weight (sd) (kg) | 87.2 (20.2) | 89.7 (18.7) | 85.9 (17.3) |
| Mean BMI (sd) (kg m−2) | 27.6 (4.8) | 27.8 (3.9) | 29.3 (5.2) |
| Obesity (BMI >30 kg m−2) | 7 (21.8) | 3 (20.0) | 4 (28.6) |
| Smoking (N, %) | 8 (25) | 5 (33) | 3 (21) |
| Operation type (N, %) | |||
| TAAA | 10 (31) | 4 (27) | 4 (29) |
| AVAA | 12 (38) | 4 (27) | 5 (36) |
| AVAA with arch | 10 (31) | 7 (47) | 5 (36) |
The FC group received a median (IQR) individualized dose of 6 (5–8) g fibrinogen concentrate and neither FFP nor platelets. The FC+FFP group received 8 (8–10) g fibrinogen concentrate, then 3 units (0–4 units) FFP and 2 units (2–3.5 units) platelet concentrate. After placebo infusion, FFP group patients received 8 units (4–10 units) FFP and 4 units (2–4.5 units) platelets.
Plasma fibrinogen concentration and FIBTEM MCF
Compared with pre-surgery baseline, plasma fibrinogen was ∼50% lower immediately after CPB removal and protamine administration in all groups (Fig. 1a; Table 2). There were no significant between-group differences in plasma fibrinogen at any time-point before study medication. For patients who received fibrinogen concentrate (FC and FC+FFP groups), plasma fibrinogen recovered to near-preoperative levels by the first time-point after infusion (i.e. last suture). The highest plasma fibrinogen level observed at this time-point was 360 mg dl−1 (FC group), within the normal range (200–450 mg dl−1). In contrast, plasma fibrinogen recovered only marginally by last suture in the FFP group, remaining significantly lower than the FC and FC+FFP groups (P<0.001). There were no significant differences in plasma fibrinogen between the FC and FC+FFP groups at any time-point.
Fig 1.
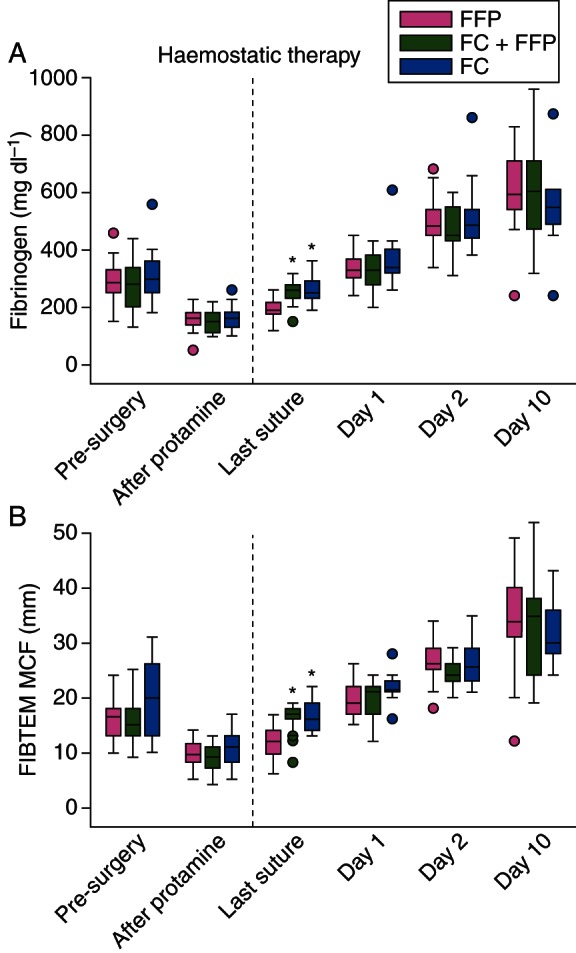
Profiles of plasma fibrinogen and fibrin-based clot firmness recorded during and after aortic surgery. (a) Plasma fibrinogen concentration determined using the Clauss method, and (b) MCF measured using the FIBTEM test. The ‘after protamine’ time-point indicates samples drawn immediately after removal from CPB and administration of protamine, and immediately before administration of intraoperative haemostatic therapy (fibrinogen concentrate, placebo, FFP, platelets as appropriate; dashed line) for coagulopathic bleeding. Boxes represent the median, lower and upper quartiles, with whiskers indicating the minimum and maximum values. Whisker length is restricted to 1.5 times the IQR from the median, and dots indicate individual values beyond this range. The time-point before removal from CPB is omitted for consistency with Figure 2; these data are presented in Table 2. FIBTEM MCF values follow a normal distribution and mean (sd) is provided in Table 2; however, (b) plots the median (IQR) for consistency with the other graphs presented in Figures 1 and 2. Significant differences between groups are indicated as follows; *P<0.001 vs FFP group. CPB, cardiopulmonary bypass; FC, fibrinogen concentrate; FFP, fresh-frozen plasma; MCF, maximum clot firmness.
Table 2.
Coagulation and haematological measurements at pre- and intraoperative time-points. Data presented as median (lower quartile, upper quartile) or as mean (sd). Statistically significant differences (bold text) indicated as follows: *P<0.001 vs FFP group; †P<0.05 vs FFP group; ‡P<0.05 vs FC+FFP group. §Heparin sensitivity of coagulation tests (based on manufacturer's' information unless indicated): fibrinogen concentration assay is sensitive to heparin concentrations above 2 IU ml−1; FII assay is sensitive to heparin above 0.6 IU ml−1; FV assay incorporates a heparin neutralizer so is not sensitive to heparin at therapeutic concentrations; FVIII assay is sensitive to heparin only above 10 IU ml−1; FXIII assay is not coagulation-based so is not considered to be heparin-sensitive; PT reagent is sensitive to heparin above 0.6 IU ml−1; aPTT test is highly sensitive to heparin; EXTEM parameters are stable in heparin concentrations up to 4 IU ml−1 23; FIBTEM MCF is not affected by heparin below 6 IU ml−1.23 ADP, adenosine diphosphate; aPTT, activated partial thromboplastin time; AT, antithrombin; COL, collagen; CPB, cardiopulmonary bypass; CT, clotting time; EXTEM, extrinsically activated thromboelastometric whole-blood test; FC, fibrinogen concentrate; FIBTEM, thromboelastometric whole-blood test for assessment of the fibrin-based clot; MCF, maximum clot firmness; TRAP, thrombin receptor activating peptide-6
| Before surgery |
20 min before removal of CPB§ |
After CPB and protamine administration |
After last suture |
|||||||||
|---|---|---|---|---|---|---|---|---|---|---|---|---|
| FFP (n=32) | FC+FFP (n=15) | FC (n=14) | FFP (n=32) | FC+FFP (n=15) | FC (n=14) | FFP (n=32) | FC+FFP (n=15) | FC (n=14) | FFP (n=32) | FC+FFP (n=15) | FC (n=14) | |
| Standard laboratory coagulation factors | ||||||||||||
| Fibrinogen (mg dl−1) | 285 (250, 330) | 280 (200, 340) | 300 (250, 360) | 165 (140, 180) | 150 (130, 180) | 175 (130, 220) | 160 (135, 180) | 150 (110, 180) | 160 (130, 180) | 190 (175, 215) | 260 (230, 280)* | 250 (230, 290)* |
| FII activity (%) | 96 (87, 109) | 94 (81, 105) | 105 (93, 112) | 23 (17, 28) | 18 (15, 22) | 26 (18, 30) | 48 (42, 57) | 47 (42, 55) | 53 (50, 60) | 69 (59, 79) | 46 (31, 54)* | 51 (43, 56)* |
| FV activity (%) | 120 (99, 152) | 140 (125, 160) | 128 (112, 142) | 47 (40, 56) | 50 (46, 66) | 49 (44, 55) | 70 (62, 88) | 83 (62, 100) | 78 (67, 95) | 74 (67, 87) | 73 (43, 75) | 70 (57, 78) |
| FVIII activity (%) | 124 (103, 179) | 148 (108, 200) | 167 (107, 181) | 155 (117, 175) | 169 (108, 188) | 142 (107, 184) | 120 (105, 163) | 143 (98, 170) | 117 (90, 146) | 127 (99, 152) | 124 (84, 153) | 122 (92, 146) |
| FXIII activity (%) | 96 (72, 107) | 85 (77, 99) | 102 (96, 112) | 54 (45, 61) | 51 (48, 57) | 56 (49, 67) | 64 (51, 72) | 61 (47, 67) | 61 (51, 65) | 83 (69, 91) | 63 (58, 77)† | 64 (63, 72)† |
| Antithrombin (%) | 81 (74, 88) | 79 (72, 87) | 86 (78, 97) | 50 (46, 56) | 51 (40, 57) | 49 (46, 60) | 48 (43, 55) | 50 (38, 56) | 51 (45, 55) | 65 (59, 72) | 46 (31, 51)* | 46 (41, 52)* |
| Standard laboratory clotting times | ||||||||||||
| PT (s) | 14.4 (13.7, 14.9) | 14.1 (13.7, 14.7) | 14.3 (14.0, 15.1) | — | — | — | 21.2 (20.1, 22.7) | 20.7 (19.3, 23.1) | 21.3 (19.8, 21.6) | 17.5 (16.9, 18.4) | 20.4 (18.7, 22.3)* | 20.4 (19.8, 21.0)* |
| aPTT (s) | 32 (30, 34) | 30 (29, 34) | 32 (28, 32) | — | — | — | 39 (35, 46) | 40 (35, 43) | 39 (38, 43) | 36 (33, 38) | 45 (38, 66)* | 43 (36, 52)† |
| ROTEM® | ||||||||||||
| EXTEM CT (s) | 59 (56, 66) | 59 (55, 67) | 60 (54, 66) | 76 (73, 84) | 69 (64, 76) | 76 (65, 86) | 77 (70, 87) | 79 (66, 90) | 74 (71, 76) | 63 (59, 72) | 62 (53, 64) | 63 (61, 69) |
| EXTEM MCF (mm) | 60.4 (5.4) | 59.5 (5.3) | 63.8 (6.2) | 50.5 (7.3) | 47.5 (7.1) | 53.2 (7.5) | 51.8 (5.5) | 48.6 (6.1) | 52.4 (6.9) | 55.4 (7.0) | 56.3 (4.9) | 56.7 (4.9) |
| Platelet component | 137 (31) | 132 (32) | 159 (43) | 95 (23) | 84 (22) | 106 (31) | 99 (20) | 87 (21) | 102 (25) | 116 (28) | 112 (19) | 114 (23) |
| FIBTEM MCF (mm) | 16.4 (3.8) | 16.2 (5.1) | 19.7 (6.6) | 9.5 (2.7) | 8.3 (1.8) | 11.1 (3.6)‡ | 9.6 (2.5) | 8.7 (2.7) | 10.7 (3.8) | 11.5 (3.3) | 16.1 (2.9)* | 16.4 (2.8)* |
| Haematology tests | ||||||||||||
| Haemoglobin (g dl−1) | 13.2 (1.3) | 12.4 (1.6) | 12.8 (1.0) | 9.6 (1.1) | 9.7 (1.0) | 9.1 (0.8) | 10.0 (0.9) | 9.9 (0.9) | 9.6 (1.0) | 9.7 (1.6) | 9.6 (1.2) | 10.3 (0.8) |
| Haematocrit (%) | 37.5 (3.6) | 35.7 (4.3) | 35.7 (2.8) | 27.0 (3.3) | 27.6 (3.3) | 25.6 (2.6) | 28.1 (3.6) | 28.0 (3.2) | 27.2 (2.6) | 26.9 (3.8) | 27.5 (3.8) | 30.0 (2.9) |
| Platelet count (×109 litre−1) | 193 (41) | 187 (44) | 244 (72)† | 113 (38) | 108 (41) | 129 (37) | 85 (24) | 82 (30) | 102 (38) | 147 (39) | 105 (23)† | 105 (34)† |
| Multiplate® platelet function | ||||||||||||
| ADPtest (units) | 51 (38, 68) | 55 (35, 70) | 69 (45, 74) | 22 (16, 29) | 23 (12, 29) | 23 (17, 34) | 15 (12, 19) | 12 (8, 21) | 18 (13, 21) | 18 (13, 30) | 11 (7, 15)† | 14 (9, 22) |
| COLtest (units) | 69 (55, 81) | 63 (48, 77) | 63 (56, 93) | 22 (11, 30) | 19 (6, 29) | 17 (10, 36) | 19 (11, 31) | 17 (11, 26) | 22 (12, 28) | 23 (9, 55) | 14 (9, 29) | 16 (11, 28) |
| TRAPtest (units) | 91 (16) | 89 (17) | 104 (18) | 60 (26) | 46 (23) | 58 (30) | 42 (16) | 35 (14) | 42 (16) | 64 (25) | 37 (15)† | 45 (19)† |
Fibrin clot measurements mirrored plasma fibrinogen profiles (Fig. 1b; Table 2). In all groups, FIBTEM MCF decreased ∼50% by the time of CPB removal and protamine administration. Although FIBTEM MCF was higher (P=0.03) in the FC group than the FC+FFP group 20 min before CPB removal (Table 2), this difference disappeared by the time study medication was administered. At last suture, FIBTEM MCF was significantly higher (P<0.001) in the FC and FC+FFP groups than the FFP group. The highest FIBTEM MCF value observed at this time-point was 22 mm (FC group), within the normal range (9–25 mm).
Between-group differences in plasma fibrinogen and FIBTEM MCF at last suture were short-lived; all groups were comparable by 24 h post-surgery (day 1; Table 3). By postoperative day 10, plasma fibrinogen and FIBTEM MCF reached 150–200% of preoperative levels in all groups.
Table 3.
Coagulation and haematological measurements at postoperative time-points. Data presented as median (lower quartile, upper quartile) or as mean (sd). Statistically significant differences (bold text) indicated as follows: †P<0.05 vs FFP group; ‡P<0.05 vs FC+FFP group. ADP, adenosine diphosphate; aPTT, activated partial thromboplastin time; AT, antithrombin; COL, collagen; CPB, cardiopulmonary bypass; CT, clotting time; EXTEM, extrinsically activated thromboelastometric whole-blood test; FII, factor II; FV, factor V; FVIII, factor VIII; FXIII, factor XIII; FC, fibrinogen concentrate; FIBTEM, thromboelastometric whole-blood test for assessment of the fibrin-based clot; MCF, maximum clot firmness; TRAP, thrombin receptor activating peptide-6
| Postoperative day 1 |
Postoperative day 2 |
Postoperative day 10 |
|||||||
|---|---|---|---|---|---|---|---|---|---|
| FFP (n=31) | FC+FFP (n=15) | FC (n=14) | FFP (n=31) | FC+FFP (n=15) | FC (n=14) | FFP (n=31) | FC+FFP (n=15) | FC (n=14) | |
| Standard laboratory coagulation factors | |||||||||
| Fibrinogen (mg dl−1) | 330 (300, 370) | 330 (280, 380) | 340 (320, 400) | 480 (450, 540) | 450 (430, 550) | 485 (440, 540) | 590 (540, 710) | 605 (470, 710) | 550 (490, 610) |
| FII activity (%) | 76 (63, 91) | 64 (55, 68) | 68 (51, 80) | 86 (78, 92) | 73 (62, 83) | 79 (70, 90) | 103 (58, 124) | 104 (71, 115) | 93 (60, 112) |
| FV activity (%) | 95 (80, 126) | 98 (85, 115) | 122 (94, 143) | 120 (108, 156) | 135 (110, 151) | 132 (105, 153) | 157 (140, 197) | 200 (176, 200)† | 157 (133, 174)‡ |
| FVIII activity (%) | 215 (199, 232) | 202 (187, 216) | 210 (183, 261) | 259 (245, 291) | 221 (242, 273) | 261 (232, 300) | 303 (272, 327) | 283 (252, 325) | 293 (232, 347) |
| FXIII activity (%) | 94 (81, 107) | 85 (69, 97) | 78 (69, 83) | 89 (79, 106) | 74 (67, 91) | 74 (68, 84) | 94 (89, 115) | 81 (72, 124) | 87 (70, 98) |
| Antithrombin (%) | 70 (61, 75) | 61 (50, 66) | 62 (57, 69) | 69 (65, 75) | 67 (52, 76) | 69 (61, 72) | 90 (79, 104) | 89 (76, 107) | 90 (79, 101) |
| Standard laboratory clotting times | |||||||||
| PT (s) | 16.4 (15.2, 17.2) | 16.6 (15.8, 17.1) | 16.0 (14.9, 18.5) | 15.3 (14.7, 16.5) | 14.9 (14.5, 16.6) | 15.7 (15.1, 16.5) | 16.2 (14.9, 22.0) | 15.4 (14.3, 19.8) | 20.4 (15.4, 23.9) |
| aPTT (s) | 43 (36, 50) | 44 (36, 48) | 47 (41, 51) | 39 (36, 43) | 40 (35, 51) | 43 (38, 49) | 38 (32, 42) | 45 (32, 51) | 45 (38, 47) |
| ROTEM® | |||||||||
| EXTEM CT (s) | 64 (58, 67) | 58 (56, 64) | 60 (55, 68) | 62 (58, 72) | 62 (54, 66) | 60 (56, 70) | 72 (67, 75) | 66 (62, 76) | 72 (65, 82) |
| EXTEM MCF (mm) | 60.9 (4.3) | 59.1 (5.1) | 61.7 (5.2) | 64.3 (4.6) | 62.4 (4.6) | 64.6 (4.8) | 70.9 (5.8) | 68.7 (8.8) | 70.8 (3.4) |
| Platelet component | 134 (25) | 124 (28) | 138 (40) | 149 (34) | 137 (30) | 151 (37) | 202 (51) | 186 (65) | 199 (31) |
| FIBTEM MCF (mm) | 19.8 (3.0) | 19.4 (3.6) | 22.1 (3.1) | 26.3 (3.3) | 24.3 (2.4) | 26.8 (4.3) | 34.1 (7.9) | 33.1 (9.9) | 31.8 (5.5) |
| Haematology tests | |||||||||
| Haemoglobin (g dl−1) | 10.1 (0.9) | 10.4 (1.1) | 10.4 (1.2) | 10.0 (1.0) | 10.6 (1.5) | 10.6 (1.2) | 11.8 (1.4) | 11.7 (1.3) | 11.4 (1.1) |
| Haematocrit (%) | 29.9 (2.7) | 31.0 (3.2) | 31.4 (4.0) | 30.0 (2.8) | 31.8 (4.3) | 31.9 (3.8) | 35.5 (4.1) | 35.8 (4.2) | 34.6 (3.3) |
| Platelet count (×109 litre−1) | 133 (43) | 107 (30) | 119 (37) | 130 (45) | 110 (37) | 125 (52) | 294 (109) | 234 (109) | 337 (140) |
| Multiplate® platelet function | |||||||||
| ADPtest (units) | 32 (23, 52) | 24 (15, 31) | 29 (24, 45) | 38 (21, 49) | 34 (20, 43) | 32 (25, 37) | 69 (49, 97) | 60 (31, 69) | 82 (52, 92) |
| COLtest (units) | 71 (38, 97) | 38 (29, 48)† | 56 (40, 67) | 65 (46, 85) | 55 (26, 68) | 49 (40, 60) | 70 (29, 103) | 73 (45, 83) | 85 (49, 99) |
| TRAPtest (units) | 75 (23) | 63 (20) | 57 (19)† | 66 (22) | 64 (24) | 50 (13) | 100 (30) | 99 (22) | 95 (18) |
Activity of other coagulation factors
Pre-treatment, there were no between-group differences in the activities of the other recorded coagulation factors analysed (FII, antithrombin, FV, FVIII and FXIII; Fig. 2a–e; Table 2). At last suture, however, FII, antithrombin, and FXIII were significantly higher in the FFP group compared with the FC group (P<0.001, <0.001, 0.04, respectively) and the FC+FFP group (P<0.001, <0.001, 0.03, respectively). These differences disappeared by day 1 (Table 3). Although FII and antithrombin levels were higher in the FFP group at last suture, the FII:antithrombin ratio was consistently comparable across groups (data not shown) and was between 1.0 and 1.3 for all time-points that were not heparin-influenced (Tables 2 and 3). There were no significant between-group differences in FV activity before day 10, when FV activity was higher in the FC+FFP group compared with the FFP (P=0.008) and FC groups (P=0.006). There were no significant between-group differences in FVIII activity at any time-point. Unlike other factors, FVIII did not decrease intraoperatively. FVIII increased by ∼200% after surgery.
Fig 2.

Profiles of haemostatic factors recorded during and after aortic surgery. Activity of Factor II (a), antithrombin (b), Factor V (c), Factor VIII (d), and Factor XIII (e). The ‘after protamine’ time-point indicates samples drawn immediately after removal from CPB and administration of protamine, and immediately before administration of intraoperative haemostatic therapy (fibrinogen concentrate, placebo, FFP, platelets as appropriate; dashed line) for coagulopathic bleeding. The time-point before removal from CPB is omitted, as patients were under the influence of heparin. Boxes represent the median, lower and upper quartiles, with whiskers indicating the minimum and maximum values. Whisker length is restricted to 1.5 times the IQR from the median, and dots indicate individual values beyond this range. Significant differences between the groups are indicated as follows; *P<0.001 vs FFP group; †P<0.05 vs FFP group; ‡P<0.05 vs FC+FFP group. CPB, cardiopulmonary bypass; FC, fibrinogen concentrate; FFP, fresh-frozen plasma.
Clotting assays
PT and aPTT were comparable across groups at all time-points except last suture (Tables 2 and 3), when both were significantly shorter in the FFP group than the FC group (P<0.001 for PT; P=0.006 for aPTT) and the FC+FFP group (P<0.001 for both). No significant differences in EXTEM CT, EXTEM MCF, or platelet component were observed at any time-point.
Haematological assays
There were no significant between-group differences in haemoglobin or haematocrit at any time-point (Tables 2 and 3). Compared with the FFP group, platelet count was higher (P=0.007) in the FC group pre-surgery, and lower in the FC group (P=0.001) and the FC+FFP group (P=0.001) at last suture. There were no significant differences in platelet function before study medication. At last suture, ADPtest readings were significantly higher for the FFP group than the FC+FFP group (P=0.02). TRAPtest readings at this time-point were higher in the FFP group than in both FC groups (FC group, P=0.03; FC+FFP group, P=0.001). At day 1, TRAPtest readings in the FFP group remained higher (P=0.03) than in the FC group, while COLtest readings in the FFP group were higher (P=0.01) than in the FC+FFP group.
Discussion
There have been calls for high-quality trials investigating fibrinogen concentrate.12,13 In this randomized, controlled study, we show that fibrinogen concentrate as targeted first-line haemostatic therapy in aortic surgery significantly increased plasma fibrinogen and fibrin-based clotting. The increases were surprisingly short-lived; all groups displayed comparable plasma fibrinogen and FIBTEM MCF by 24 h post-surgery and during the subsequent acute-phase response. Compared with the FFP group, subjects receiving fibrinogen concentrate did not exhibit significant increases in other coagulation parameters; hence, targeted, FIBTEM-guided fibrinogen concentrate therapy did not cause widespread haemostatic changes.
Compared with the FC subgroups, plasma fibrinogen recovered weakly in the FFP group by last suture. This is unsurprising, as the target fibrinogen level was higher than the fibrinogen concentration of FFP (typical FFP fibrinogen content ∼200 mg dl−1).14 Fibrinogen concentrate raises plasma fibrinogen more effectively than FFP, allowing targeting of a high normal level.
Fibrinogen preparations have been used to control haemorrhage since 1948.15 Owing to hepatitis transmission risks, the US Food and Drug Administration revoked all licences for fibrinogen in 1977 and its benefits were questioned.16 Fibrinogen concentrate was re-launched in Europe in 1985, with a pasteurization step in the manufacturing process, and has since undergone a renaissance, with over 3 tons administered.17 A 22 yr pharmacosurveillance programme reported one thromboembolic complication per 28 735 fibrinogen concentrate infusions.18 In our study, after decreases in plasma fibrinogen and FIBTEM MCF during CPB (consistent with other studies),10,19,20 fibrinogen concentrate infusion resulted in both parameters recovering to pre-surgery levels. No further coagulation or haematological changes were observed.
Compared with both FC subgroups at last suture, the FFP group displayed elevated antithrombin, FII and FXIII activity, shortened PT and aPTT, and increased platelet count and function. Elevated antithrombin, FII, and FXIII might be due to the increased quantity of FFP administered to the FFP group. Similarly, PT and aPTT might be shortened by increased FII activity coupled with small, non-significant increases in other factors present in FFP. However, although shorter in the FFP group, PT and aPTT were within normal ranges at last suture in both FC subgroups. Elevated platelet count in the FFP group is attributable to increased platelet transfusion compared with subjects receiving fibrinogen concentrate. In all groups, Multiplate® platelet function parameters and ROTEM® platelet component evolved in parallel with platelet count during CPB, corroborating data from coronary artery bypass graft (CABG) surgery.21
Most significant between-group differences were at last suture. These results should not be heparin-influenced; the only time-point potentially affected by heparin was 20 min before CPB removal. Circulating heparin concentration was not measured, although values of ∼2.3 IU ml−1 are commonly reported before CPB discontinuation.22 According to the manufacturer, plasma fibrinogen measurement in our study was insensitive to heparin <2 IU ml−1. FIBTEM analysis is insensitive to heparin up to 6 IU ml−1.23 Interpretation of measurements at 20 min before CPB removal should consider these effects.
The plasma fibrinogen levels observed after surgery corroborate previous data from cardiovascular surgery,8,24,25 and reflect fibrinogen's role as an acute-phase protein. Fibrinogen has been reported as a predictor,3 marker,2 and mediator of coronary conditions.7 For example, elevated preoperative plasma fibrinogen is associated with increased mortality post-CABG,26 although recent data show that prophylactic fibrinogen concentrate pre-CABG improves outcomes.27 To reconcile these apparently conflicting findings, it is important to distinguish between elevated plasma fibrinogen levels due to a pre-existing condition and due to targeted haemostatic therapy. Failure to appreciate this distinction might explain the historically negative perception of fibrinogen as a therapeutic agent.
During an acute-phase response, plasma fibrinogen increases two- to 20-fold.28–30 The half-life of fibrinogen in healthy and coagulopathic humans is 4–6.7 days;31,32 so once elevated, high plasma fibrinogen levels can persist. Owing to the ∼8 day interval between our penultimate and final postoperative time-points, we cannot determine whether fibrinogen and MCF values at day 10 represent a continuing increase, or whether fibrin(ogen) levels peaked between days 2 and 10. However, all fibrin(ogen) levels reported here are consistent with the literature. Acute postoperative increases in FVIII were observed, consistent with FVIII being an acute-phase protein.33 Antithrombin and FII can also decrease during CPB and increase during the acute phase, although our data indicate no substantial postoperative recovery beyond preoperative levels; this might have occurred between days 2 and 10, when no blood was drawn. Given the observed stability of FII:antithrombin ratios, plus previous data on thrombin generation post-cardiac surgery,10 it seems unlikely that increased postoperative thrombin generation was an issue in our study.
Our data support swine model investigations of fibrinogen availability after haemorrhage and volume resuscitation,34 whereby fibrinogen levels decreased up to 6 h post-resuscitation, then increased two-fold over baseline by 24 h post-resuscitation. In contrast, platelet count decreased continuously. However, whole-blood clot amplitude decreased up to 6 h and returned to baseline by 24 h, suggesting that increased fibrinogen compensates for decreased platelets in clot formation.35,36 We observed similar trends; platelet counts decreased throughout surgery and up to postoperative day 2 in all groups. However, clot firmness recovered post-CPB and exceeded baseline levels by day 1, supporting a compensatory role for fibrinogen during thrombocytopenia.
Considering fibrinogen's life-span in vivo, we observed surprisingly low plasma fibrinogen 24 h after fibrinogen concentrate administration. There is little understanding of how i.v. administered fibrinogen integrates within the haemostatic process and is subsequently cleared. Consequently, the relative contributions of infused and endogenous fibrinogen in our study are unclear. Questions remain: does fibrinogen infusion influence endogenous fibrinogen synthesis? Is fibrinogen concentrate cleared from the circulation after surgery by increased fibrin(ogeno)lysis or other mechanisms? Animal models using stable isotopes will help answer these questions.
Regarding clinical outcomes from this study, analysis of primary and secondary endpoints9 showed that, compared with placebo, fibrinogen concentrate substantially reduced transfusion of allogeneic blood products during the first 24 h after administration. Total avoidance of transfusion was achieved in 45% of subjects who received fibrinogen concentrate, while all placebo group subjects received transfusion. The safety profile of fibrinogen concentrate was similar to that of placebo.
The main limitation of the present analysis is its post hoc nature; the statistical analyses were not pre-specified. The study was designed to confer statistical power upon the primary efficacy analysis,9 and the fibrinogen concentrate group was subdivided post hoc to analyse the effects of fibrinogen concentrate with or without FFP. Additionally, the time from infusion of study medication to last suture varied due to differences in management, defined by the treatment algorithm. Nevertheless, this is the largest prospective, randomized trial investigating fibrinogen concentrate, and consolidates accumulating evidence on the effectiveness of fibrinogen concentrate as first-line therapy in bleeding patients. Given safety and efficacy issues surrounding FFP, there is a clear need for larger, multicentre trials investigating the efficacy and safety of fibrinogen concentrate.
Conclusions
First-line haemostatic therapy with fibrinogen concentrate increased plasma fibrinogen levels and fibrin-based clotting in aortic surgery. These improvements were short-lived; all subjects displayed comparable fibrin(ogen) levels at 24 h and during the subsequent acute-phase response. Targeted fibrinogen administration was specific in its effects and did not cause widespread haemostatic alteration.
Declaration of interest
C.S. is an employee of CSL Behring, but was not an employee of CSL Behring while the study was being conducted, and has received speaker honoraria and/or research support from Tem International and CSL Behring, and travel support from Haemoscope Ltd. N.R.-M. has participated in advisory boards and received speaker honoraria and research support from CSL Behring and Tem International.
Funding
This work was supported by research funding from CSL Behring. The sponsor (CSL Behring) participated in study design with the principal investigator, but was not involved in data collection. Data analysis was performed independently by a contract research organization funded by CSL Behring. Editorial assistance with manuscript preparation was provided by Meridian HealthComms, funded by CSL Behring. The funding for Open Access was provided by CSL Behring.
Acknowledgements
We would like to thank the Hannover Clinical Trial Center (HCTC), Hannover, Germany, which provided the monitoring as a contract research organization. We would also like to thank Brigitte Buchalik (Medical Technician at Clinic for Anesthesiology and Intensive Care Medicine, Hannover Medical School, Hannover, Germany) for her important contribution to this study: blood sample collection, performance of coagulation tests, and data collection.
References
- 1.Kozek-Langenecker S, Sorensen B, Hess JR, Spahn DR. Clinical effectiveness of fresh frozen plasma compared with fibrinogen concentrate: a systematic review. Crit Care. 2011;15:R239. doi: 10.1186/cc10488. doi:10.1186/cc10488. [DOI] [PMC free article] [PubMed] [Google Scholar]
- 2.Reinhart WH. Fibrinogen—marker or mediator of vascular disease? Vasc Med. 2003;8:211–6. doi: 10.1191/1358863x03vm494ra. doi:10.1191/1358863x03vm494ra. [DOI] [PubMed] [Google Scholar]
- 3.Stone MC, Thorp JM. Plasma fibrinogen—a major coronary risk factor. J R Coll Gen Pract. 1985;35:565–9. [PMC free article] [PubMed] [Google Scholar]
- 4.De Mattia D, Regina G, Giordano P, et al. Association of congenital afibrinogenemia and K-dependent protein C deficiency—a case report. Angiology. 1993;44:745–9. doi: 10.1177/000331979304400913. doi:10.1177/000331979304400913. [DOI] [PubMed] [Google Scholar]
- 5.MacKinnon HH, Fekete JF. Congenital afibrinogenemia. Vascular changes and multiple thromboses induced by fibrinogen infusions and contraceptive medication. Can Med Assoc J. 1971;104:597–9. [PMC free article] [PubMed] [Google Scholar]
- 6.de Moerloose P, Neerman-Arbez M. Treatment of congenital fibrinogen disorders. Expert Opin Biol Ther. 2008;8:979–92. doi: 10.1517/14712598.8.7.979. doi:10.1517/14712598.8.7.979. [DOI] [PubMed] [Google Scholar]
- 7.Grebe MT, Luu B, Sedding D, et al. Fibrinogen promotes early atherosclerotic changes of the carotid artery in young, healthy adults. J Atheroscler Thromb. 2010;17:1003–8. doi: 10.5551/jat.3715. doi:10.5551/jat.3715. [DOI] [PubMed] [Google Scholar]
- 8.Monaco M, Di Tommaso L, Stassano P, et al. Impact of blood coagulation and fibrinolytic system changes on early and mid term clinical outcome in patients undergoing stent endografting surgery. Interact Cardiovasc Thorac Surg. 2006;5:724–8. doi: 10.1510/icvts.2006.136507. doi:10.1510/icvts.2006.136507. [DOI] [PubMed] [Google Scholar]
- 9.Rahe-Meyer N, Solomon C, Hanke A, et al. Effects of fibrinogen concentrate as first-line therapy during major aortic replacement surgery—a randomized, placebo-controlled trial. Anesthesiology. 2012;118:40–50. doi: 10.1097/ALN.0b013e3182715d4d. [DOI] [PubMed] [Google Scholar]
- 10.Solomon C, Rahe-Meyer N, Sorensen B. Fibrin formation is more impaired than thrombin generation and platelets immediately following cardiac surgery. Thromb Res. 2011;128:277–82. doi: 10.1016/j.thromres.2011.02.022. doi:10.1016/j.thromres.2011.02.022. [DOI] [PubMed] [Google Scholar]
- 11.Solomon C, Traintinger S, Ziegler B, et al. Platelet function following trauma. A multiple electrode aggregometry study. Thromb Haemost. 2011;106:322–30. doi: 10.1160/TH11-03-0175. doi:10.1160/TH11-03-0175. [DOI] [PubMed] [Google Scholar]
- 12.Ozier Y, Hunt BJ. Against: Fibrinogen concentrate for management of bleeding: against indiscriminate use. J Thromb Haemost. 2011;9:6–8. doi: 10.1111/j.1538-7836.2010.04083.x. doi:10.1111/j.1538-7836.2010.04083.x. [DOI] [PubMed] [Google Scholar]
- 13.Stanworth SJ, Hunt BJ. The desperate need for good-quality clinical trials to evaluate the optimal source and dose of fibrinogen in managing bleeding. Crit Care. 2011;15:1006. doi: 10.1186/cc10510. doi:10.1186/cc10510. [DOI] [PMC free article] [PubMed] [Google Scholar]
- 14.Theusinger OM, Baulig W, Seifert B, et al. Relative concentrations of haemostatic factors and cytokines in solvent/detergent-treated and fresh-frozen plasma. Br J Anaesth. 2011;106:505–11. doi: 10.1093/bja/aer003. doi:10.1093/bja/aer003. [DOI] [PubMed] [Google Scholar]
- 15.Weiner AE, Reid DE, Roby CC, Diamond LK. Coagulation defects with intrauterine death from Rh isosensitization. Am J Obstet Gynecol. 1950;60:1015–22. doi: 10.1016/0002-9378(50)90507-2. [DOI] [PubMed] [Google Scholar]
- 16.Bove JR. Fibrinogen—is the benefit worth the risk? Transfusion. 1978;18:129–36. doi: 10.1046/j.1537-2995.1978.18278160573.x. doi:10.1046/j.1537-2995.1978.18278160573.x. [DOI] [PubMed] [Google Scholar]
- 17.Kozek-Langenecker S, Sorensen B, Hess J, Spahn DR. Emotional or evidence-based medicine: is there a moral tragedy in haemostatic therapy? Crit Care. 2011;15:462. doi: 10.1186/cc10583. doi:10.1186/cc10583. [DOI] [PMC free article] [PubMed] [Google Scholar]
- 18.Dickneite G, Pragst I, Joch C, Bergman GE. Animal model and clinical evidence indicating low thrombogenic potential of fibrinogen concentrate (Haemocomplettan P) Blood Coagul Fibrinolysis. 2009;20:535–40. doi: 10.1097/MBC.0b013e32832da1c5. doi:10.1097/MBC.0b013e32832da1c5. [DOI] [PubMed] [Google Scholar]
- 19.Blome M, Isgro F, Kiessling AH, et al. Relationship between factor XIII activity, fibrinogen, haemostasis screening tests and postoperative bleeding in cardiopulmonary bypass surgery. Thromb Haemost. 2005;93:1101–7. doi: 10.1160/TH04-12-0799. [DOI] [PubMed] [Google Scholar]
- 20.Solomon C, Pichlmaier U, Schoechl H, et al. Recovery of fibrinogen after administration of fibrinogen concentrate to patients with severe bleeding after cardiopulmonary bypass surgery. Br J Anaesth. 2010;104:555–62. doi: 10.1093/bja/aeq058. doi:10.1093/bja/aeq058. [DOI] [PMC free article] [PubMed] [Google Scholar]
- 21.Rahe-Meyer N, Solomon C, Tokuno ML, et al. Comparative assessment of coagulation changes induced by two different types of heart–lung machine. Artif Organs. 2010;34:3–12. doi: 10.1111/j.1525-1594.2009.00792.x. doi:10.1111/j.1525-1594.2009.00792.x. [DOI] [PubMed] [Google Scholar]
- 22.Raymond PD, Ray MJ, Callen SN, Marsh NA. Heparin monitoring during cardiac surgery. Part 1: Validation of whole-blood heparin concentration and activated clotting time. Perfusion. 2003;18:269–76. doi: 10.1191/0267659103pf672oa. doi:10.1191/0267659103pf672oa. [DOI] [PubMed] [Google Scholar]
- 23.Gertler R, Wiesner G, Tassani-Prell P, Braun SL, Martin K. Are the point-of-care diagnostics MULTIPLATE and ROTEM valid in the setting of high concentrations of heparin and its reversal with protamine? J Cardiothorac Vasc Anesth. 2011;25:981–6. doi: 10.1053/j.jvca.2010.11.020. doi:10.1053/j.jvca.2010.11.020. [DOI] [PubMed] [Google Scholar]
- 24.Lison S, Weiss G, Spannagl M, Heindl B. Postoperative changes in procoagulant factors after major surgery. Blood Coagul Fibrinolysis. 2011;22:190–6. doi: 10.1097/MBC.0b013e328343f7be. doi:10.1097/MBC.0b013e328343f7be. [DOI] [PubMed] [Google Scholar]
- 25.Lupi A, Secco GG, Rognoni A, et al. Plasma fibrinogen levels and restenosis after primary percutaneous coronary intervention. J Thromb Thrombolysis. 2012;33:308–17. doi: 10.1007/s11239-011-0628-z. [DOI] [PubMed] [Google Scholar]
- 26.Volzke H, Robinson DM, Kleine V, et al. Preoperative plasma fibrinogen levels predict mortality after coronary artery bypass grafting. Thromb Haemost. 2003;89:885–91. [PubMed] [Google Scholar]
- 27.Karlsson M, Ternstrom L, Hyllner M, et al. Prophylactic fibrinogen infusion reduces bleeding after coronary artery bypass surgery. A prospective randomised pilot study. Thromb Haemost. 2009;102:137–44. doi: 10.1160/TH08-09-0587. [DOI] [PubMed] [Google Scholar]
- 28.Birch HE, Schreiber G. Transcriptional regulation of plasma protein synthesis during inflammation. J Biol Chem. 1986;261:8077–80. [PubMed] [Google Scholar]
- 29.Fuller GM, Otto JM, Woloski BM, McGary CT, Adams MA. The effects of hepatocyte stimulating factor on fibrinogen biosynthesis in hepatocyte monolayers. J Cell Biol. 1985;101:1481–6. doi: 10.1083/jcb.101.4.1481. doi:10.1083/jcb.101.4.1481. [DOI] [PMC free article] [PubMed] [Google Scholar]
- 30.Otto JM, Grenett HE, Fuller GM. The coordinated regulation of fibrinogen gene transcription by hepatocyte-stimulating factor and dexamethasone. J Cell Biol. 1987;105:1067–72. doi: 10.1083/jcb.105.3.1067. doi:10.1083/jcb.105.3.1067. [DOI] [PMC free article] [PubMed] [Google Scholar]
- 31.Gitlin D, Borges WH. Studies on the metabolism of fibrinogen in two patients with congenital afibrinogenemia. Blood. 1953;8:679–86. [PubMed] [Google Scholar]
- 32.Blomback B, Carlson LA, Franzen S, Zetterqvist E. Turnover of 131-I-labelled fibrinogen in man. Studies in normal subjects, in congenital coagulation factor deficiency states, in liver cirrhosis, in polycythemia vera and in epidermolysis bullosa. Acta Med Scand. 1966;179:557–74. doi: 10.1111/j.0954-6820.1966.tb07973.x. doi:10.1111/j.0954-6820.1966.tb07973.x. [DOI] [PubMed] [Google Scholar]
- 33.Chooi CC, Gallus AS. Acute phase reaction, fibrinogen level and thrombus size. Thromb Res. 1989;53:493–501. doi: 10.1016/0049-3848(89)90204-1. doi:10.1016/0049-3848(89)90204-1. [DOI] [PubMed] [Google Scholar]
- 34.Martini WZ. Fibrinogen availability and coagulation function after hemorrhage and resuscitation in pigs. Mol Med. 2011;17:757–61. doi: 10.2119/molmed.2010.00093. doi:10.1007/s00894-010-0768-7. [DOI] [PMC free article] [PubMed] [Google Scholar]
- 35.Lang T, Johanning K, Metzler H, et al. The effects of fibrinogen levels on thromboelastometric variables in the presence of thrombocytopenia. Anesth Analg. 2009;108:751–8. doi: 10.1213/ane.0b013e3181966675. doi:10.1213/ane.0b013e3181966675. [DOI] [PubMed] [Google Scholar]
- 36.Velik-Salchner C, Haas T, Innerhofer P, et al. The effect of fibrinogen concentrate on thrombocytopenia. J Thromb Haemost. 2007;5:1019–25. doi: 10.1111/j.1538-7836.2007.02481.x. doi:10.1111/j.1538-7836.2007.02481.x. [DOI] [PubMed] [Google Scholar]