

Abstract
Objective
To explore the hypothesis that placing clinical variables of differing metrics on a common linear scale of all-cause postdischarge mortality provides risk functions that are directly correlated with in-hospital mortality risk.
Design
Modelling study.
Setting
An 805-bed community hospital in the southeastern USA.
Participants
42302 inpatients admitted for any reason, excluding obstetrics, paediatric and psychiatric patients.
Outcome measures
All-cause in-hospital and postdischarge mortalities, and associated correlations.
Results
Pearson correlation coefficients comparing in-hospital risks with postdischarge risks for creatinine, heart rate and a set of 12 nursing assessments are 0.920, 0.922 and 0.892, respectively. Correlation between postdischarge risk heart rate and the Modified Early Warning System (MEWS) component for heart rate is 0.855. The minimal excess risk values for creatinine and heart rate roughly correspond to the normal reference ranges. We also provide the risks for values outside that range, independent of expert opinion or a regression model. By summing risk functions, a first-approximation patient risk score is created, which correctly ranks 6 discharge categories by average mortality with p<0.001 for differences in category means, and Tukey's Honestly Significant Difference Test confirmed that the means were all different at the 95% confidence level.
Conclusions
Quantitative or categorical clinical variables can be transformed into risk functions that correlate well with in-hospital risk. This methodology provides an empirical way to assess inpatient risk from data available in the Electronic Health Record. With just the variables in this paper, we achieve a risk score that correlates with discharge disposition. This is the first step towards creation of a universal measure of patient condition that reflects a generally applicable set of health-related risks. More importantly, we believe that our approach opens the door to a way of exploring and resolving many issues in patient assessment.
Keywords: Biotechnology & Bioinformatics, Performance measures, Quality measurement
Article summary.
Article focus
This study develops an empirical measure of all-cause mortality risk, using as examples heart rate, creatinine and a set of 12 nursing assessments.
It describes risk functions that enable quantitative assessment of inpatient acuity, based on commonly available clinical measurements and 1-year mortality.
Key messages
Risk functions are easily computed with the data from an Electronic Health Record and the Social Security Administration Death file; these functions correlate well with in-hospital mortality, giving investigators a new tool to study the acuity of patients in the hospital.
Excess risk functions provide a new way to view results from pathology labs beyond just considering how a measurement compares to a reference range of population norms.
Strengths and limitations of this study
A large dataset (more than 40 000 hospital visits) was used to derive the risk functions; this is a new empirical method for evaluating univariate risk, independent of diagnosis or comorbidity, and without using population norms or expert opinion.
No multivariate analysis was performed on the example variables, making the associations found subject to possible unknown confounders; also, the work has been done at a single site with a population skewed older than the general population.
Introduction
Clinicians regularly utilise various systems designed to quantify some aspect of patient acuity.1 In most cases, these assess risk pertaining to: a specific event such as cardiopulmonary arrest or transfer to intensive care2–11; or to a specific disease or procedure12–16; or within a specific environment, such as the intensive care unit (ICU)15 17 18 or for after-the-fact risk adjustment, such as to compare the performance of medical units.19–22 However, there has been no previous system created to score the real-time overall condition of individual patients within a hospital's general ward, across the acuity spectrum, based upon empirical evidence from the Electronic Health Record (EHR).
In this study, we lay the foundation necessary for an overall measure of a patient's condition. We seek to create a contemporaneous longitudinal index, calculated by summing empirical estimates of incremental risk. Systems to measure risk in the hospital have been based on aggregated expert opinion,15 18 23–27 or regression models.17 28 And, for laboratory tests, risk as reported to physicians by pathology labs is usually based on the norm of a ‘healthy’ population29 with the notion that if a measurement is within the reference range (mean ± 2 SD), there is no risk. Unfortunately, this lab method has no direct link to risk; for example, serum cholesterol for the adult population would have placed the norm at 200 mg/dl,30 which in light of extensive medical evidence is now understood to be ‘borderline high’.31
We introduce a different method to estimate a patient's risk, which does not rely on or require expert opinion, or a regression model, or a population norm, but rather is completely empirical and evidence based. Our hypothesis is that placing clinical variables on a linear scale of all-cause postdischarge mortality produces risk functions that are directly correlated with in-hospital mortality. Adding together the risk functions of differing underlying metrics is a step towards creation of a general patient-condition score of empirically based risks. These functions are readily computed by combining clinical data available in a hospital's EHR with mortality data available from the Social Security Administration.
This is one of a series of studies whose objective was to demonstrate and validate the creation of such an index, derived empirically from regularly collected variables available in a hospital's EHR. In a previous study, we demonstrated that for nursing assessments, predischarge assessments are strongly correlated with 1-year postdischarge mortality, and nursing assessments at admission are correlated with in-hospital mortality.32
We extend this work in three ways: first, by computing risk functions for vital signs and for laboratory blood tests; second, showing the relevance of 1-year postdischarge risk functions to risk in the hospital, by computing the correlation between in-hospital risk and postdischarge risk and third, showing that the sum of risk functions correlates with patient acuity at the time of discharge, as represented by the patient's discharge disposition (eg, to home or rehab or a skilled nursing facility).
This common linear scale of a risk function reflects the health consequences of any value of the variable in terms of all-cause risk of mortality associated with that value, independent of diagnosis. One advantage of having various routinely available in-hospital clinical variables expressed in terms of per cent risk is that they then can be linearly added in some fashion to assign a total risk index for each patient at any moment in time, given the variable values for that patient. The current study illustrates our new methodology using several basic variables as an example, including quantitative, such as heart rate or creatinine level, and categorical, such as 12 pass/fail nursing assessments. We then demonstrate the utility of a first-approximation risk score based on this example, which we compute by simply adding the risks associated with these example variables.
The full details of construction and validation of a real-time, inpatient condition score are the subject of a forthcoming study. This new measure is currently being used and evaluated in several medical centres, and is called the Rothman Index in memory of Florence A. Rothman, whose death inspired this research. The various measures necessary to form an index in other areas of research can be determined by the methodology developed here, and we encourage application of our methods.
Methods
General approach and data
A methodology for assessment of hospital inpatient risk should have the following properties:
The variables must be readily accessible in the EHR;
The various risks must be empirically determined;
The scale must be linear, allowing risks to be additive;
The methodology must be statistically rigorous.
To be linear and additive, the calculated risks are expressed in per cent, as opposed to odds or ratios. Although in-hospital per cent mortality risks can be ascertained, inpatient deaths are usually at such low rates that it may be difficult to achieve adequate statistical significance. However, the period 1-year postdischarge can more easily achieve statistical significance, since there is time to accumulate a sufficient number of deaths. The problem then becomes one of establishing correspondence between postdischarge risks on the one hand, and in-hospital risks, on the other.32 33 In the following, we demonstrate that postdischarge mortalities associated with exit values of variables have a direct relationship to in-hospital mortalities associated with entry values of these variables.
To demonstrate the methodology that can be utilised for the various types of clinical variables available in the EHR, we analyse two quantitative variables and a set of 12 categorical variables. Specifically, we provide the details for a vital sign (heart rate), a laboratory test (creatinine) and nursing assessments (for definition of nursing assessments, see table 1).32 Clinical data, discharge dates and Social Security numbers for the periods January 2004–December 2004 and June 2005–June 2006 were extracted from the EHR at Sarasota Memorial Hospital (SMH), an 805-bed community hospital. Our cohort for this study was patients admitted for any reason during this period, excluding obstetrics, paediatric and psychiatric patients, which determined the study size of 42302 inpatient admissions. Demographic data and diagnostic data have not been collected for this population; however, our subject community hospital serves a population skewed older than the US average. Death records were acquired from the Social Security Administration Death Master File. Ethical considerations associated with this study have been reviewed by the SMH Institutional Review Board, which approved the study.
Table 1.
Nursing assessments: standards at Sarasota Memorial Hospital with fail-rate on admission and discharge
| Nursing standards | Upon admission |
Upon discharge |
||
|---|---|---|---|---|
| As defined at Sarasota Memorial Hospital | Number of cases | Per cent failed | Number of cases | Per cent failed |
| Cardiac: pulse regular, rate 60–100 bpm, skin warm and dry. Blood pressure less than 140/90 and no symptoms of hypotension | 41657 | 26.4 | 40597 | 18.9 |
| Food: no difficulty with chewing, swallowing or manual dexterity. Patient consuming >50% of daily diet ordered as observed or stated | 41645 | 23.4 | 40579 | 13.4 |
| Gastrointestinal: abdomen soft and non-tender. Bowel sounds present. No nausea or vomiting. Continent. Bowel pattern normal as observed or stated | 41657 | 27.2 | 40591 | 17.7 |
| Genitourinary: voids without difficulty. Continent. Urine clear, yellow to amber as observed or stated. Urinary catheter patent if present | 41649 | 19.1 | 40577 | 13.0 |
| Musculoskeletal: independently able to move all extremities and perform functional activities as observed or stated (includes assistive devices) | 41660 | 42.2 | 40591 | 40.0 |
| Pain: without pain or VAS<4 or experiencing chronic pain that is managed effectively | 41568 | 18.3 | 40501 | 12.1 |
| Neurological: alert, oriented to person, place, time and situation. Speech is coherent | 41661 | 15.0 | 40591 | 13.6 |
| Peripheral/vascular: extremities are normal or pink and warm. Peripheral pulses palpable. Capillary refill <3 s. No oedema, numbness or tingling | 41667 | 23.6 | 40596 | 27.1 |
| Psychosocial: behaviour appropriate to situation Expressed concerns and fears being addressed. Adequate support system | 41645 | 7.2 | 40579 | 7.1 |
| Respiratory: respiration 12–24/min at rest quiet and regular. Bilateral breath sounds clear. Nail beds and mucous membranes pink. Sputum clear if present | 41665 | 32.8 | 40594 | 33.5 |
| Safety/fall-risk: safety/fall risk factors not present. Patient is not a risk to self or others | 41667 | 18.2 | 40578 | 17.1 |
| Skin/tissue: skin clean, dry and intact with no reddened areas. Patient is alert, cooperative and able to reposition self independently. Braden >15 | 41631 | 21.3 | 40564 | 26.0 |
These assessments are generally performed at least once per shift. They consist of binary data, characterised either as having ‘passed’ or ‘failed’ the standard. Although standards vary, basically the same data are being collected at every hospital. It is generally possible to construct similar binary variables from any hospital's nursing data.
Calculation of ‘excess risk’ functions for each variable
For quantitative variables, we tabulated the numbers of living and dead patients associated with each value of the variable, and took a frequency-weighted moving average (calculated at the maximum granularity, eg, 0.1 mg/dl for creatinine and 1 bpm for heart rate) over all the values reported. The test samples for creatinine were collected routinely, analsed by the SMH laboratory utilising the Siemens Dimension Vista System and its prescribed procedures, and the results entered into the EHR. By subtracting the minimum mortality associated with a variable from that variable's mortality results, we found the absolute mortality increase or net ‘excess risk’ of mortality for the various values of the variable. This method was utilised to associate deaths within a period of 1-year postdischarge with variable values at discharge, and in-hospital mortality with variable values at admission.
For categorical variables (eg, nursing assessments where physiological systems are evaluated by nurses as ‘within normal limits’ or ‘not within normal limits’32), the mortalities associated with each category were calculated, producing simple functions of category versus mortality. The excess risk function is the difference between mortality for a category and that for the category at which mortality is a minimum.
For every variable, we calculated two excess risk functions and the Pearson correlation between them. The two excess risk functions were determined from (1) postdischarge mortality associated with the last values before discharge and (2) in-hospital mortality associated with the first values after admission. Data analysis was performed by Systat V.13 (Systat Corp., Chicago, Illinois, USA).
Finally, to investigate our methodology's utility for constructing an empirically based risk score of patients, we added together the risks associated with each patient's heart rate, creatinine level and the set of nursing assessments, as recorded in the hospital's EHR, to obtain an overall ‘risk score’ and then tested the scores by ranking of discharge dispositions. To test whether this score corresponds to the approximate condition of discharged patients, we calculated the average score among patients for each of six discharge categories, namely: home, home with healthcare, rehab centre, skilled nursing facility, hospice and death. Separation of means was tested by analysis of variance (ANOVA) and by Tukey's ‘honestly significant difference’ test. For comparison, we performed the same ranking for age versus discharge disposition. To check on possible confounding, we ran Pearson's correlation calculations on all pairs of variables.
Results
Table 2 gives the distribution statistics for the admission and discharge values of heart rate and creatinine, while table 1 summarises the distribution of nursing assessment pass/fail at entry and exit. The excess risk functions for heart rate and creatinine and nursing assessments are given in figures 1–3. The excess risk functions for creatinine and heart rate are U-shaped, with both low and high values associated with higher mortality risks, and minimal risks for intermediate values. For comparison, the Modified Early Warning System (MEWS) component for heart rate is also graphed.27 Pearson correlation coefficients for comparing point-by-point excess in-hospital risks with excess postdischarge risks are 0.920 and 0.922, respectively (p<0.001).
Table 2.
Distribution statistics of entry and exit values of creatinine and heart rate
| Entry creatinine | Exit creatinine | Entry heart | Exit heart | |
|---|---|---|---|---|
| Number of cases | 32232 | 31336 | 42202 | 41173 |
| Median | 1 | 0.9 | 79 | 77 |
| Arithmetic mean | 1.273 | 1.183 | 80.335 | 78.097 |
| Mode | 0.8 | 0.8 | 80 | 70 |
| SD | 1.225 | 1.115 | 17.189 | 15.073 |
Figure 1.
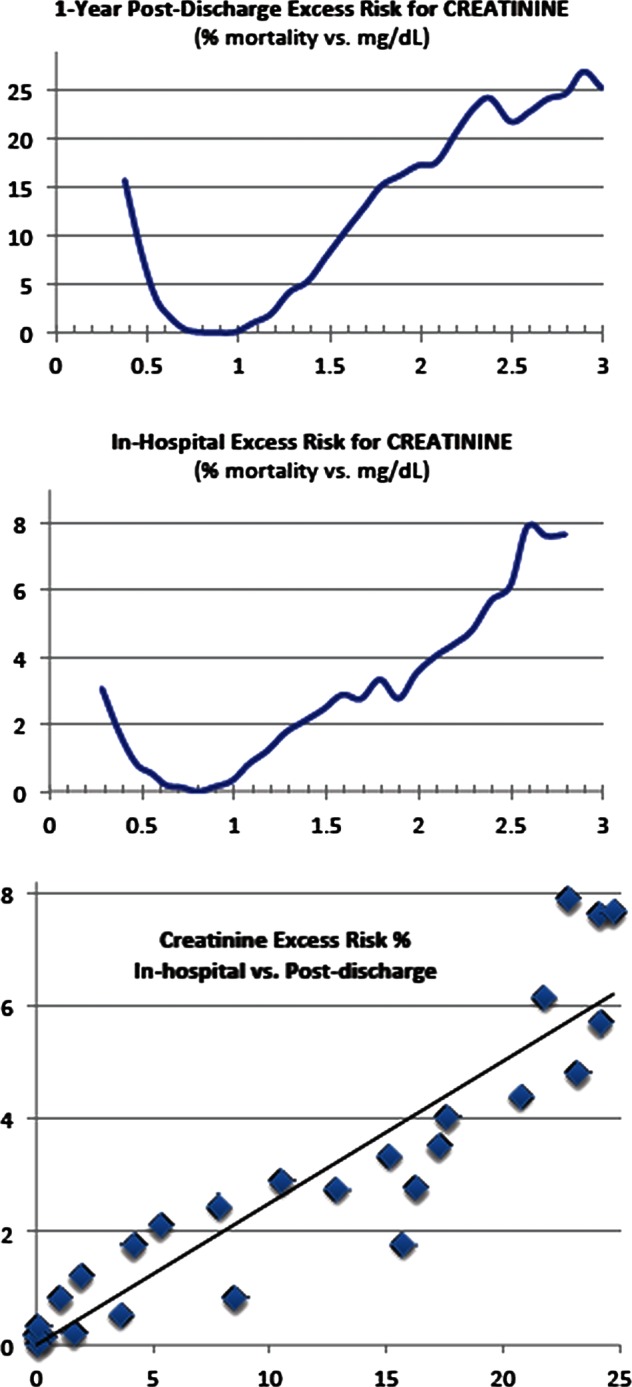
Creatinine level versus excess risk: (A) 1-Year postdischarge; (B) in-hospital; (C) correlation=0.920. The reference range for creatinine at Sarasota Memorial Hospital is 0.5–1.2 mg/dl.
Figure 2.
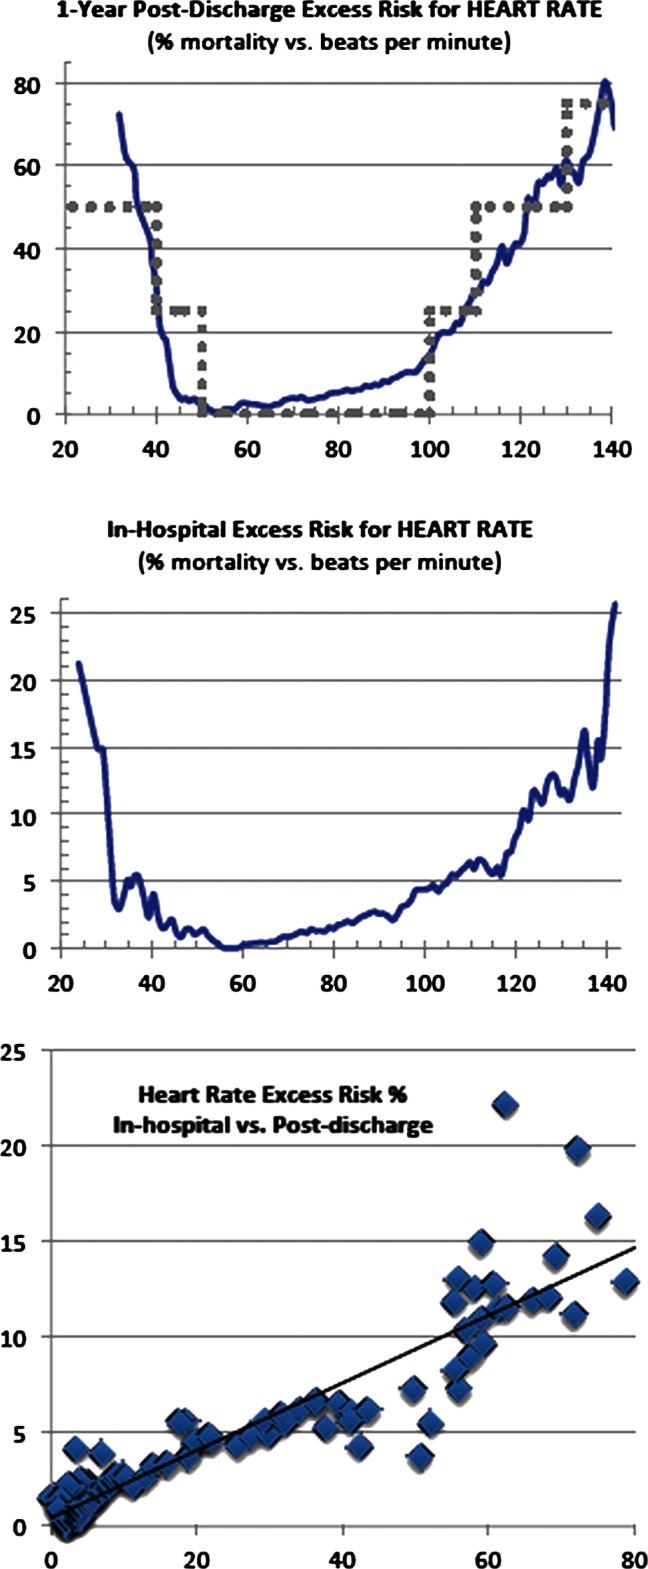
Heart rate versus excess risk: (A) 1-Year postdischarge; (B) in-hospital; (C) correlation=0.922. Displayed for comparison is the Modified Early Warning System (MEWS) heart risk score (in grey dots), scaled to correspond roughly with our results (MEWS correlation=0.855).
Figure 3.
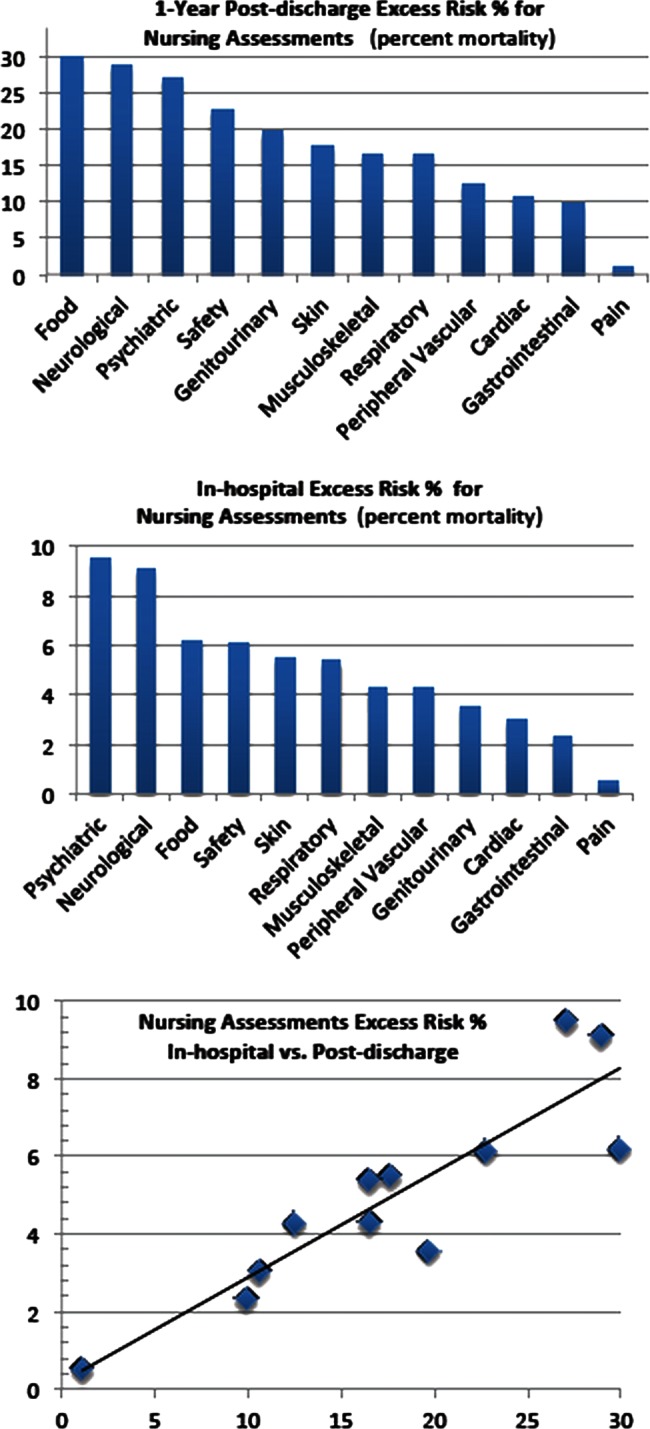
Nursing assessments versus excess risk: (A) 1-Year postdischarge; (B) in-hospital; (C) correlation=0.892 for the set of 12 nursing assessments—in-hospital versus postdischarge.
Passing a nursing assessment (‘within normal limits’) is found to be associated with fewer deaths than failing (‘not within normal limits’) in all cases. The correlation of excess risk in-hospital compared with postdischarge is 0.892. Note in figures 1–3 that the ‘excess risk’ curves are very similar for in-hospital and postdischarge (part ‘a’ versus part ‘b’), though the actual death rates are lower in-hospital as one would expect for the shorter period of a hospital stay. Demonstrating that these are highly correlated implies the possibility of model construction from any hospital's EHR (matched with a death record), since the average hospital stay of 3.5 days makes achieving data significance difficult.
With all of these example variables on a common linear scale of risk, the risks can be added together to form an overall score for patient condition (a rather crude score, limited to our example variables). To test whether this score approximately corresponds to patient condition at discharge, we calculated the average overall score among patients just before discharge, for six categories listed in Otable 3, and the 1-year mortality for each category. The average score properly ranked the discharge dispositions, and there was excellent separation between the averages for each of the categories. This is confirmed by an ANOVA calculation of means with F=2,657, and Tukey's Honestly Significant Difference Test in Systat, with p<0.001 for all pairwise differences in means at the 95% confidence level.
Table 3.
A sample overall risk score for patients in six discharge dispositions
| Discharge disposition | Average risk score | ±Error | Percentage of 1-year mortality | N |
|---|---|---|---|---|
| Home | 7.5 | 0.1 | 5.5 | 23791 |
| Home with healthcare | 12.2 | 0.1 | 9.4 | 6919 |
| Rehab centre | 16.7 | 0.2 | 11.2 | 2157 |
| Skilled nursing facility | 24.2 | 0.2 | 25.7 | 5977 |
| Hospice | 36.3 | 0.4 | 84.3 | 1341 |
| Death | 42.4 | 0.4 | 100 | 1254 |
All means are pairwise statistically significantly different with p<0.001.
It had been suggested that patients' age might be used to separate discharge disposition categories (we do not include age in our variables). However, none of the pairwise comparisons of average age by discharge disposition were different at the 95% confidence level, and the Pearson correlation between age and the discharge group has a coefficient of 0.078 (virtually no relationship). It is not age itself, but age-related illness that we capture in each patient's clinical variables, and it is each patient's combined risk score that correlates with the discharge disposition. Finally, we found very low correlation between any pair of variables; the 78 pairwise Pearson correlation coefficients are shown in Otable 4, indicating a lack of confounding and a lack of double counting and thus remarkably little information overlap.
Table 4.
Pearson Product-Moment Correlation Matrix: R, correlation coefficients among all component-pairs of the model
| Ag | Ca | Fo | Ga | Ge | Mu | Ne | Pa | Pe | Ps | Re | Sa | Sk | HR | CR | |
|---|---|---|---|---|---|---|---|---|---|---|---|---|---|---|---|
| Age | 1.0 | ||||||||||||||
| Cardiac | 0.2 | 1.0 | |||||||||||||
| Food | 0.1 | 0.1 | 1.0 | ||||||||||||
| Gastrointestinal | 0.0 | 0.1 | 0.2 | 1.0 | |||||||||||
| Genitourinary | 0.2 | 0.1 | 0.2 | 0.1 | 1.0 | ||||||||||
| Musculoskeletal | 0.3 | 0.1 | 0.3 | 0.1 | 0.2 | 1.0 | |||||||||
| Neurological | 0.3 | 0.1 | 0.4 | 0.1 | 0.3 | 0.4 | 1.0 | ||||||||
| Pain | −0.1 | 0.0 | 0.0 | 0.1 | 0.0 | 0.1 | 0.0 | 1.0 | |||||||
| Peripheral vasc | 0.2 | 0.1 | 0.1 | 0.1 | 0.1 | 0.3 | 0.1 | 0.0 | 1.0 | ||||||
| Psychosocial | 0.1 | 0.1 | 0.3 | 0.1 | 0.2 | 0.2 | 0.4 | 0.0 | 0.1 | 1.0 | |||||
| Respiratory | 0.3 | 0.1 | 0.2 | 0.1 | 0.1 | 0.2 | 0.2 | 0.0 | 0.2 | 0.1 | 1.0 | ||||
| Safety/fall risk | 0.3 | 0.1 | 0.3 | 0.1 | 0.2 | 0.4 | 0.5 | 0.0 | 0.1 | 0.3 | 0.2 | 1.0 | |||
| Skin/tissue | 0.2 | 0.1 | 0.3 | 0.1 | 0.2 | 0.4 | 0.3 | 0.0 | 0.3 | 0.2 | 0.2 | 0.3 | 1.0 | ||
| Heart rate | −0.1 | 0.1 | 0.1 | 0.1 | 0.1 | 0.1 | 0.1 | 0.1 | 0.1 | 0.1 | 0.1 | 0.1 | 0.1 | 1.0 | |
| Creatinine | 0.1 | 0.0 | 0.0 | 0.0 | 0.2 | 0.1 | 0.0 | 0.0 | 0.1 | 0.0 | 0.0 | 0.0 | 0.1 | 0.0 | 1.0 |
Abbreviations correspond to 12 nursing assessments of table 1, plus creatinine and heart rate. Also included is age as a possible confounding factor. All pairs have low R-squared coefficients of determination, indicating that every variable could contribute to the model's goodness of fit (for ranking the categories of discharge disposition).
Discussion
Characteristics of lab results (creatinine)
Our function for per cent absolute increase in risk of mortality, hereinafter referred to as ‘excess risk’, has minimal values (below 4%) between 0.5 and 1.3 mg/dl, roughly corresponding to the reference range for creatinine as 0.5–1.2 mg/dl, which is determined by samples from a healthy population (given by the SMH lab utilising the Siemens Vista system with an expected error of ±0.1 mg/dl).33 One major advantage of our methodology is to provide a function of risk for values outside that reference range, as determined by all-cause mortality statistics, unrelated to any specific disease and independent of any specific model. We compare our ‘excess risk’ function for creatinine to the usual laboratory test results of ‘higher than, ’ ‘lower than, ’ or ‘within’ the normal reference interval. To do this, we calculate death rates for members of the cohort with test results in a small interval about each value, using a standard statistical method for calculating the power associated with utilising samples to calculate a death rate for a population. We find p<0.01 except at the very extremes of the data range, where the data are sparse.
Characteristics of vital sign results (heart rate)
Our excess risk function is a relative minimum (below 4%) for the range 47–74 bpm, which is rather lower than the range some studies give as normal, 60–80 bpm.34 For comparison, we also graphed the heart rate component of MEWS, scaled to fit our results, with each MEWS point set equal to 25% excess risk. MEWS assigns zero relative risk from 50 to 100 bpm, which, according to our results, puts patients near the high end of the zero-risk MEWS range at a mortality risk of over 15%. It is worth noting that the overall results, while differing in details, are nonetheless quite similar, allowing for the rough granularity of MEWS. Of course, the methodology behind the two results is completely different, as ours is derived from readily accessible hospital and mortality data, as opposed to MEWS, which is based on a consensus of expert opinion. We have also calculated excess risk functions for other vital signs (eg, systolic and diastolic blood pressure, and pulse oximetry); those functions will be published elsewhere, as our primary purpose here was to illustrate the methodology.
Characteristics of categorical variable results (nursing assessments)
Excess risks for binary variables, such as nursing assessments that are categorized as either “within normal limits” or “not within normal limits”, are computed by taking the differences between the all-cause mortality rates of the two possibilities. The excess risk for the value associated with the lower rate is then identically zero, and the excess risk for the value with the higher rate is the difference in rates. For categorical variables that are not binary, an excess risk function would be computed as the difference between the category having the lowest mortality and the death rate for each of the other categories.
When comparing all nursing assessment in-hospital risks versus postdischarge risks, we found that the ‘food’ assessment (indicating a difficulty with chewing or swallowing or appetite) was an outlier, as are the ‘psychiatric’ and ‘genitourinary’ assessments, the post-discharge risk being proportionately much greater. For ‘food’, this may be because inpatients who are not able to eat can be given their nutrition intravenously or with feeding tubes, while for discharged patients, this is rarely available. This is not true for the ‘psychiatric’ and ‘genitourinary’ assessments which also have large residuals, and for which we can make no compelling argument not to count them in the correlation calculation. They stand with the other nursing assessments as similar in nature to a doctor's general ‘review of systems’35 (eg, gastrointestinal, musculoskeletal, genitourinary), while food stands alone (omitting the outlier increases the correlation from 0.892 to 0.934). Whether ‘food’ is excluded or not, the correlation is excellent.
Utility and meaning of the excess risk methodology
One must address the issue of the meaning and utility of the methodology developed here, if it is to be useful in the hospital setting. First, the postdischarge risks correlate well with the in-hospital risks, showing that the former can be used as a measure of the latter. Second, we find that the risk score created by simply adding the in-hospital risks associated with the last values of our example variables before discharge (nursing assessments, heart rate and creatinine) approximately corresponds to the patient's condition at discharge across the acuity spectrum of discharged patients. As shown in table 3, the average risk scores among patients within each of the six discharge categories correspond exactly with the progression that would be expected for an increasing risk of death: home, home with healthcare, rehab centre, skilled nursing facility, hospice and death. Thus, these risk functions are meaningful in terms of the patient's condition. This further suggests that a more sophisticated score could be developed to track each patient's condition within the hospital, or to predict readmission; these are subjects of our current research.
The correlation with acuity across the acuity spectrum suggests that these measurements may be applicable to those patients critically ill, possibly in the ICU and also to those patients in a general hospital ward. Additionally, it is clear that excess risk functions may be used in many different ways. We have shown an example where our function qualitatively reproduces a univariate risk function (MEWS for heart rate) supplied by experts while providing more quantitative detail, as well as examples where the minima of excess risk functions confirm population-derived reference intervals. These measures of patient risk could prove helpful in pharmaceutical or epidemiological research as an indication of outcomes.36 And since we use an institutional approach, which avoids collapsing data to specific categories—such as a disease—our methodology may have future use in the measurement of hospital performance.
The limitations of this study are that no multivariate analysis was performed on the example variables, making the associations found subject to possible unknown confounders. Also, the work has been carried out at a single site with a population skewed older than the general population.
A study of the all-cause death rates associated with clinical variables yields information on general risks associated with the variables. In forthcoming studies, we compare the risks associated with various lab tests to their standard reference intervals. This methodology provides direct estimates of the risks associated with values both within and outside the reference interval, which the usual demographic studies of healthy populations do not. This is an area that warrants further investigation, and may be a way that decision limits can be established for lab tests.
Finally, since any clinical variable can be associated with a function of excess risk by the methodology utilised in the current study, a researcher can choose any combination of disparate variables to describe some specific aspect of the condition of a patient in a hospital, and transform these into risk functions; this, in turn, allows the placing of values onto a common linear scale, and combining them to create an index for the specific purpose intended. This index would then be empirically based, without reference to models or to expert opinion, and dependent strictly and only on data from the EHR.
Conclusions
Any quantitative or categorical clinical variable in the EHR can be transformed into an excess risk function. This associates the absolute increased per cent risk of dying from any cause after hospital discharge with each value of the variable. We have shown this to be directly correlated with in-hospital patient risk. Moreover, the resultant risks can be added to obtain a measure of total risk that corresponds well with discharge disposition. In a forthcoming study, we demonstrate the building of a more complex index based on these principles, which is expected to satisfy additional and more stringent tests of construct validity.
We believe that our approach opens the door to a way of exploring and resolving many issues in patient assessment. Clearly, researchers with access to the database of a hospital's EHR can perform retrospective research to determine risks associated with clinical and physiological variables, stratified by age, gender, race or any administrative classification. This enables researchers to explore many new relationships using disparate variables, becoming a new and meaningful use of the EHR.
Supplementary Material
Acknowledgments
G Duncan Finlay, MD, is thanked for invaluable discussions. Without his support, our work would not have been possible. Joseph Beals IV, PhD, provided background on the state of the art and a summary of prior medical scores.
Footnotes
Contributors: MJR and SIR conceived this research issue, and performed the preliminary investigations. MJR performed the data extraction; SIR and ABS extended the scope of the investigation; ABS analysed the extended dataset, searched the literature and wrote the first draft of the manuscript. All authors contributed to the interpretation of the results and a critical revision of the manuscript for important intellectual content and approved the final version of the manuscript. SIR is the guarantor.
Funding: Research was funded by grants from the Sarasota Memorial Healthcare Foundation and the Goldsmith Fund of the Greenfield Foundation and PeraHealth, Inc.
Competing interests: None.
Provenance and peer review: Not commissioned; externally peer reviewed.
Data sharing statement: Qualified researchers may apply to the corresponding author for the study's data.
References
- 1.Liao L, Mark DB. Clinical prediction models: are we building better mousetraps? J Am Coll Cardiol 2003;42:851–3 [DOI] [PubMed] [Google Scholar]
- 2.Cuthbertson BH, Boroujerdi M, McKie L, et al. Can physiological variables and early warning scoring systems allow early recognition of the deteriorating surgical patient? Crit Care Med 2007;35:402–9 [DOI] [PubMed] [Google Scholar]
- 3.Cretikos M, Chen J, Hillman K, et al. The objective medical emergency team activation criteria: a case-control study. Resuscitation 2007;73:62–72 [DOI] [PubMed] [Google Scholar]
- 4.Edwards ED, Mason BW, Oliver A, et al. Cohort study to test the predictability of the Melbourne criteria for activation of the medical emergency team. Arch Dis Child 2011;96:174–9 [DOI] [PubMed] [Google Scholar]
- 5.Gao H, McDonnell A, Harrison DA, et al. Systematic review and evaluation of physiological track and trigger warning systems for identifying at-risk patients on the ward. Intensive Care Med 2007;33:667–79 [DOI] [PubMed] [Google Scholar]
- 6.Hillman K, Chen J, Cretikos M, et al. Introduction of the medical emergency team (MET) system: a cluster-randomised controlled trial. Lancet 2005;365:2091–7 [DOI] [PubMed] [Google Scholar]
- 7.Jansen JO, Cuthbertson BH. Detecting critical illness outside the ICU: the role of track and trigger systems. Curr Opin Crit Care 2010;16:184–90 [DOI] [PubMed] [Google Scholar]
- 8.Winters BD, Pham J, Pronovost PJ. Rapid response teams—walk, don't run. JAMA 2006;296:1645–7 [DOI] [PubMed] [Google Scholar]
- 9.Gordon CF, Beckett DJ. Significant deficiencies in the overnight use of a Standardised Early Warning Scoring system in a teaching hospital. Scott Med J 2011;56:15–18 [DOI] [PubMed] [Google Scholar]
- 10.Kirkland LL, Malinchoc M, O'Byrne M, et al. A Clinical deterioration prediction tool for internal medicine patients. Am J Med Qual. Published Online First: 19 July 2012 doi: 10.1177/1062860612450459 [DOI] [PubMed] [Google Scholar]
- 11.Escobar GJ, LaGuardia JC, Turk BJ, et al. Early detection of impending physiologic deterioration among patients who are not in intensive care: development of predictive models using data from an automated electronic medical record. J Hosp Med 2012;7:388–95 [DOI] [PubMed] [Google Scholar]
- 12.Xu Y, Nakazato R, Hayes S, et al. Prognostic value of automated vs visual analysis for adenosine stress myocardial perfusion SPECT in patients without prior coronary artery disease: a case-control study. J Nucl Cardiol 2011;18:1003–9 [DOI] [PMC free article] [PubMed] [Google Scholar]
- 13.Reese AC, Pierorazio PM, Han M, et al. Contemporary evaluation of the national comprehensive cancer network prostate cancer risk classification system. Urology 2012. pii: S0090-4295(12)00862-X. doi: 10.1016/j.urology.2012.07.040. [Epub ahead of print] PMID:22995570 [DOI] [PubMed] [Google Scholar]
- 14.Chalmers J, Pullan M, Fabri B, et al. Validation of EuroSCORE II in a modern cohort of patients undergoing cardiac surgery. Eur J Cardiothorac Surg 2013;43:688–94. [DOI] [PubMed] [Google Scholar]
- 15.Bilan N, Galehgolab BA, Emadaddin A, et al. Risk of mortality in pediatric intensive care unit, assessed by PRISM-III. Pak J Biol Sci 2009;12:480–5 [DOI] [PubMed] [Google Scholar]
- 16.Rexius H, Brandrup-Wognsen G, Nilsson J, et al. A simple score to assess mortality risk in patients waiting for coronary artery bypass grafting. Ann Thorac Surg 2006;81:577–82 [DOI] [PubMed] [Google Scholar]
- 17.Fikatas P, Ulrich F, Lee JE, et al. The APACHE III score as preoperative indicator of patient outcome in liver transplantation after fulminant hepatic failure. Ann Transplant 2011;16:18–25 [PubMed] [Google Scholar]
- 18.Minne L, Abu-Hanna A, De Jonge E. Evaluation of SOFA-based models for predicting mortality in the ICU: a systematic review. Crit Care 2008;12:R161. [DOI] [PMC free article] [PubMed] [Google Scholar]
- 19.Escobar G, Greene J, Scheirer P, et al. Risk adjusting hospital inpatient mortality using automated inpatient, outpatient, and laboratory databases. Med Care 2008;46:232–9 [DOI] [PubMed] [Google Scholar]
- 20.Goodacre S, Wilson R, Shephard N, et al. Derivation and validation of a risk adjustment model for predicting seven day mortality in emergency medical admissions: mixed prospective and retrospective cohort study. BMJ 2012;344:e2904. [DOI] [PMC free article] [PubMed] [Google Scholar]
- 21.Pine M, Jordan HS, Elixhauser A, et al. Enhancement of claims data to improve risk adjustment of hospital mortality. JAMA 2007;297:71–6 [DOI] [PubMed] [Google Scholar]
- 22.Tabak YP, Johannes RS, Silber JH. Using automated clinical data for risk adjustment: development and validation of six disease-specific mortality predictive models for pay-for performance. Med Care 2007;45:789–805 [DOI] [PubMed] [Google Scholar]
- 23.McLellan MC, Connor JA. The cardiac children's hospital early warning score (C-CHEWS). J Pediatr Nurs 2013;28:171–8 [DOI] [PubMed] [Google Scholar]
- 24.Parshuram CS, Hutchison J, Middaugh K. Development and initial validation of the Bedside Paediatric Early Warning System score. Crit Care 2009;13:R135. [DOI] [PMC free article] [PubMed] [Google Scholar]
- 25.Prytherch DR, Smith GB, Schmidt PE, et al. ViEWS—towards a national early warning score for detecting adult inpatient deterioration. Resuscitation 2010;81:932–7 [DOI] [PubMed] [Google Scholar]
- 26.Fraser DD, Singh RN, Frewen T. The PEWS score: potential calling criteria for critical care response teams in children's hospitals. J Crit Care 2006;21:278–9 [DOI] [PubMed] [Google Scholar]
- 27.Subbe CP, Kruger M, Rutherford P, et al. Validation of a Modified Early Warning Score in medical admissions. QJM 2001;94:521–6 [DOI] [PubMed] [Google Scholar]
- 28.Walter LC, Brand RJ, Counsell SR, et al. Development and validation of a prognostic index for 1-year mortality in older adults after hospitalization. JAMA 2001;285:2987–94 [DOI] [PubMed] [Google Scholar]
- 29.Marshall WJ, Bangert SK. Clinical biochemistry: metabolic and clinical aspects. Philadelphia: Churchill Livingstone/Elsevier, 2008:19 [Google Scholar]
- 30.Roger VL, Go AS, Lloyd-Jones DM, et al. Heart disease and stroke statistics—2012 update: a report from the American Heart Association. Circulation 2012;125:188–97 [DOI] [PubMed] [Google Scholar]
- 31.Schwartz LM, Woloshin S. Changing disease definitions: implications for disease prevalence. Analysis of the Third National Health and Nutrition Examination Survey, 1988–1994. Eff Clin Pract 1999;2:76–85 [PubMed] [Google Scholar]
- 32.Rothman MJ, Solinger AB, Rothman SI, et al. Clinical implications and validity of nursing assessments: a longitudinal measure of patient condition from analysis of the Electronic Health Record. BMJ Open 2012;2:e000849. doi: 10.1136/bmjopen-2012-000849 [DOI] [PMC free article] [PubMed] [Google Scholar]
- 33.Siemens Technical Report: CREA Flex® reagent cartridge insert sheet PN 717033.002 Issue Date 2010-01-21 Rev. J
- 34.Reunanen A, Karjalainen J, Ristola P, et al. Heart rate and mortality. J Intern Med 2000;247:231–9 [DOI] [PubMed] [Google Scholar]
- 35.Moore KJ. Documenting history in compliance with Medicare's guidelines. Fam Pract Manag 2010;17:22–7 [PubMed] [Google Scholar]
- 36.Powell J, Buchan I. Electronic health records should support clinical research. J Med Internet Res 2005;7:e4. [DOI] [PMC free article] [PubMed] [Google Scholar]
Associated Data
This section collects any data citations, data availability statements, or supplementary materials included in this article.