Abstract
The formation of hydroperoxides postulated in all the kinetic models for the low temperature oxidation of alkanes have been experimentally proved thanks to a new type of apparatus associating a quartz jet-stirred reactor through a molecular-beam sampling system to a reflectron time-of-flight mass spectrometer combined with tunable synchrotron vacuum ultraviolet photoionization. This apparatus has been used to investigate the low-temperature oxidation of n-butane and has allowed demonstrating the formation of different types of alkylhydroperoxides, namely methylhydroperoxide, ethylhydroperoxide and butylhydroperoxide, and of C4 alkylhydroperoxides including a carbonyl function (ketohydroperoxides). In addition, the formation of products deriving from these ketohydroperoxides, such as C4 molecules including either two carbonyl groups or one carbonyl and one alcohol functions, has been observed. Simulations using a detailed kinetic model have been performed to support some of the assumptions made in this work.
Keywords: Jet-stirred reactor, molecular beam-mass spectrometry, low-temperature oxidation, n-butane, hydroperoxides
I. INTRODUCTION
Tunable synchrotron vacuum ultraviolet (SVUV) photoionization mass spectrometry combined with molecular-beam sampling has been proved to be a successful method to probe in many types of laboratory combustion systems [1]. While this system has been often coupled to laminar premixed (e.g. to demonstrate the presence of enols in flames [2]) and co-flow flames, flow reactors used to study pyrolysis, plasmas discharge and low-pressure catalytic oxidation apparatuses [1], it has never been used to investigate the low-temperature oxidation of organic compounds. As jet-stirred reactors (JSR) have already been used with success to study the formation of a wide range of products during the low-temperature oxidation of organic compounds (e.g. [3][4]), the purpose of this paper is to investigate if interesting new results on the low-temperature oxidation of n-butane can arise from the coupling of a JSR through a molecular-beam sampling system to a reflectron time-of-flight (RTOF) mass spectrometer combined with SVUV photoionization. n-butane has been chosen because it is the smallest alkane which has a low-temperature oxidation chemistry representative of that of the larger ones present in gasoline and diesel fuels. Apart from work performed in static reactors in the 70’s [5] and in a rapid compression machine [6] to follow ignition and cool flame delay times, the low-temperature oxidation of n-butane has not been much investigated.
II. EXPERIMENTAL FACILITY
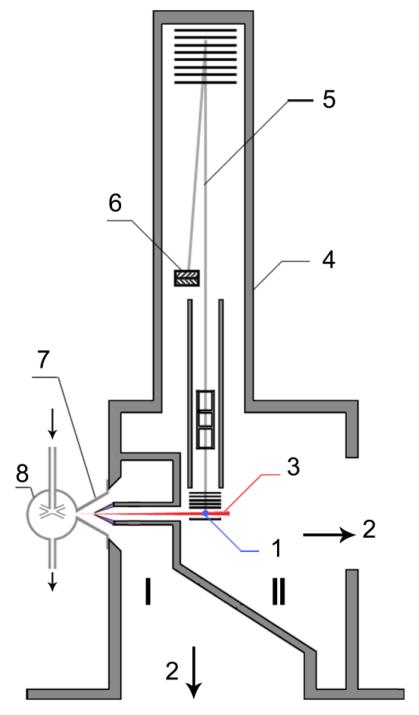
As shown in Fig. 1, the apparatus associated a JSR through a molecular-beam sampling system to a RTOF mass spectrometer combined with SVUV photoionization. The experiments were performed at the National Synchrotron Radiation Laboratory (NSRL) in Hefei, China. This part describes in more detail the jet-stirred reactor, the molecular-beam sampling and photoionization mass spectrometry. The gases used in this study were provided by Dalian Guangming Special Gas Products (purity of +99%). Gas flows were controlled by MKS mass flow controllers.
Figure 1.
Schematic diagram of the instrument including the jet-stirred reactor, the differential pumped chamber with molecular-beam sampling system (I), and the photoionization chamber with the mass spectrometer (II): 1, VUV light; 2, to turbo molecular pumps; 3, molecular beam; 4, RTOF mass spectrometer; 5, ion trajectory; 6, microchannel plate detector; 7, quartz cone-like nozzle; 8, heated quartz jet-stirred reactor.
II.1. The jet-stirred reactor
The reactor, which was described previously [4][7], consists of a quartz sphere (diameter ≈ 56 mm, volume ≈ 90 cm3, made in France) in which diluted reactant enters through an injection cross located in its center. It is operated at constant temperature and pressure and preceded by a quartz annular preheating zone in which the temperature of the gases is increased up to the reactor temperature before entering inside. Gas mixture residence time inside the annular preheater is very short compared to its residence time inside the reactor (about a few percents). Both spherical reactor and annular preheating zone are heated by the mean of resistances rolled up around their wall. Reaction temperature was measured with a thermocouple located inside the intra-annular space of the preheating zone; its extremity is on the level of the injection cross.
II.2 The molecular-beam sampling and photoionization mass spectrometer
The jet-stirred reactor is connected to a differentially pumped chamber with a molecular-beam sampling system, and a photoionization chamber with a homemade RTOF mass spectrometer for ion detection. The coupling with the reactor has been made through a quartz cone-like nozzle with a height of 50 mm and an open angle of 60°. The tip of the cone was pierced with a 75 μm orifice made using sandstone paper before the tip of the nozzle was inserted inside the spherical reactor by a glass blower. During the experiments, the reactor and the nozzle were completely covered by quartz wool.
A nickel skimmer with a 1.25 mm diameter aperture was located 15 mm downstream from the sampling nozzle. The sampled gases formed a molecular beam, which was passed horizontally through the 10 mm gap between the repeller and extractor plates of the RTOF mass spectrometer. The molecular beam intersected perpendicularly with synchrotron VUV light beam. The beamline from a undulator provides the photon energy ranging from 7.8 to 24 eV with the energy resolving power (E/ΔE) of around 1,000 and the average photon flux of ~1013 photons/sec [8]. The pressures in the reactor, the differentially pumped chamber and the ionization chamber were 1.064×10⁵, 6.7×10⁻², and 8.3×10⁻⁴ Pa, respectively.
II.3 The ion detection and data acquisition
The ion signal was detected with a RTOF mass-spectrometer, which was vertically installed in the photoionization chamber (Fig. 1). A pulsed voltage of 346 V was used to propel ions into the flight tube, and finally to a multichannel plate (MCP) detector. The total length of the ion flight is 1.8 m. The ion signals were amplified by a pre-amplifier (VT120C, EG&G ORTEC). The mass resolution (m/Δm) was measured to be ~2000. A digital delay generator (DG535, Stanford Research System) was used to trigger the pulse power supply and to feed as the start of a multiscaler with repetition ratio of 18,000 Hz. A multiscaler (FAST Comtec P7888) was used to record signals of mass spectrum with 2 ns bin width. A small bias voltage (1.0 V) was added to improve signal intensity, reduce the background ions, and enhance the mass resolution [9].
III. EXPERIMENTAL AND SIMULATION RESULTS
This apparatus described above was used to study of the oxidation of n-butane between 580 and 720 K, under quasi-atmospheric pressure (1.05 atm), at a mean residence time of 6s and for a stoichiometric n-butane/oxygen/argon mixture (composition = 4/26/70 in mol %). The ratio of inert gas was set slightly below the ratio in air to obtain the largest amounts of products without the occurrence of strong thermal phenomena.
Simulations have been made using a mechanism for the low-temperature oxidation of n-butane generated by the version of EXGAS-ALKANES described by Biet el al. [7]. Only a very few changes have been made to this initial mechanism in order to improve the agreement for the consumption of n-butane and the formation of major products:
the activation energy of the reaction of butyl radicals with oxygen to give 1- or 2-butene and HO2 radicals have been decreased from 5 [10] to 3 kcal/mol,
disproportionation reactions of two butylperoxy radicals to give oxygen, butanol, butanal or butanone have been considered; these reactions usually neglected are more sensitive in the present high concentration conditions.
Reactions of species detected in this work, and not considered in the initial mechanism, are described further in the text. The mechanism is provided as a supplementary material. Simulations were performed using CHEMKIN software [11].
III.1 Consumption of n-butane and formation of major products
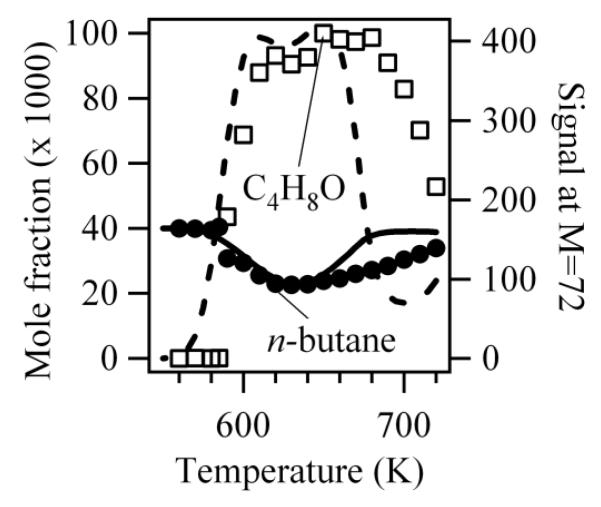
Figure 2 presents the evolution of the experimental mole fraction of n-butane with temperature. The mole fraction of n-butane was directly derived from the normalized ion signal at mass 58 (obtained with a photon energy of 11.0 eV considering that no reaction occurred below 590 K). Raw signals of every compound were normalized by the ion signal obtained for argon (mass = 40, obtained for photon energy of 16.2 eV) which acted as an internal standard. The normalized ion signal of a given species is proportional to its concentration with a factor depending mainly on its photoionization cross section [12], which is unknown for the species of interest in this paper. The agreement between simulations and experiments is satisfactory showing a marked negative temperature (NTC) zone. The simulated NTC behavior is stronger than the experimental one leading to an underprediction of the reactivity above 650 K.
Figure 2.
Evolution with temperature of the experimental (black circles) and simulated (full line) mole fraction of n-butane, the signal at mass 72 (white squares, in arbitrary units) and the computed mole fraction of C4H8O products multiplied by a factor 120 (broken line).
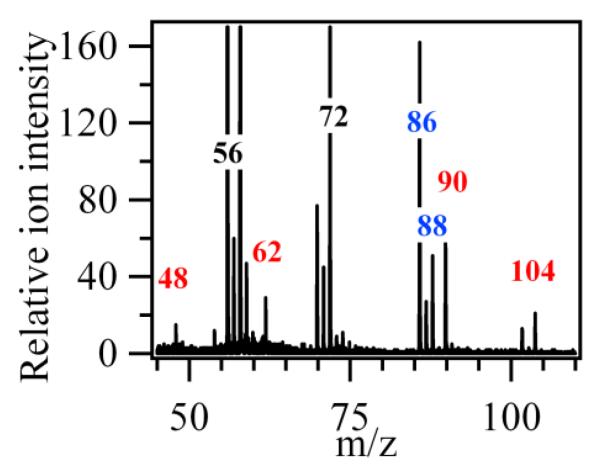
Figure 3 presents a typical experimental mass spectrum obtained at photon energy of 10.0 eV to avoid ion fragmentation. It shows that the two highest peaks, apart from that at mass 58, are at masses 56 and 72 which correspond to the major reaction products, butenes and C4H8O products, respectively.
Figure 3.
Typical mass spectrum obtained for the oxidation of n-butane. The temperature in the reactor was 590 K and the photon energy was 10.0 eV.
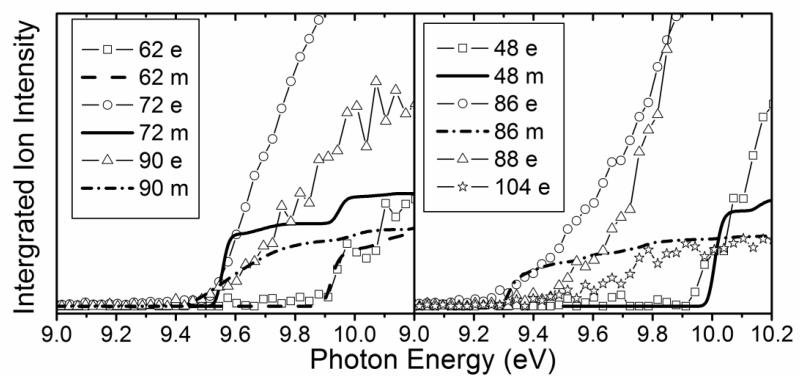
To identify the structure of the compounds detected in this study, experimental sweeping of photon energies from 8.5 to 11.5 eV has been made (e.g. Fig. 4). The obtained experimental ionization energy (IE) was 9.5 eV for mass 72, which can correspond to butanone (IE = 9.52 eV), tetrahydrofuran (IE = 9.40 eV) and 2-methyl-oxetane (IE = 9.57 eV (theoretical calculations)). The IEs of other possible compounds are larger: 9.82 eV for butanal, 10.15 eV for 2-ethyl-oxirane and 9.98 eV for 2,3-dimethyl-oxirane. When IE values were not available in the literature [13], zero-point energy corrected adiabatic ionization energies have been calculated from the composite CBS-QB3 method [14] using Gaussian03 [15]. The mean absolute error of CBS-QB3 for the G2 test is less than 0.05 eV. For compounds which can involve hydrogen bonds, several conformations have been investigated by ab initio calculations in order to find the lowest energy conformer.
Figure 4.
Photoionization efficiency spectra (arbitrary units) of mass 48, 62, 72, 86, 89, 90 and 104 sampled from the reactor (photoionization step size of 0.025eV). The temperature in the reactor was 630 K. Symbols are experimental data, and lines are the simulated photoionization Frank-Condon envelopes.
Figure 2 also displays the evolution with temperature of the signal at mass 72 and of the computed mole fraction of the sum of C4H8O products. As the absolute experimental value of the mole fractions of these products are unknown, only a qualitative agreement with simulation can be sought. The shapes of the experimental and computed profiles are similar with a “plateau” above 620 K. Note, however, that due to the too low simulated reactivity above 650 K, the length of this plateau is shorter for simulations. In agreement with experimental IE for mass 72, simulations show that the major C4H8O products formed are butanone, tetrahydrofuran and 2-methyl-oxetane.
III.2 Speciation of hydroperoxides
The mass spectrum in Fig. 3 includes also peaks the masses of which correspond to alkylhydroperoxides: 48 (methylhydroperoxide, CH3OOH), 62 (ethylhydroperoxide, C2H5OOH), 90 (butylhydroperoxide, C4H9OOH), and 104 (ketohydroperoxide, C4H8O3). In a system containing only carbon, hydrogen and oxygen atoms, mass 48 can only be related to methylhydroperoxide. For masses 62, 90 and 104, several possibilities exist.
Figure 4 displays photoionization efficiency spectra of masses 48, 62, 90 and 104 with simulated Franck-Condon factor envelopes, which were calculated by a program developed by Ramos et al. [16] basing on the optimization and frequency calculations at B3LYP/CBSB7 level [17]. Note that simulated Franck-Condon envelops can only predict the initial stage of photoionization efficiency spectra. The obtained experimental IEs were 9.91, 9.69, 9.37 and 9.29±0.05 eV for mass 48, 62, 90 and 104, respectively. The calculated values were 9.83 eV for methylhydroperoxide and 9.61 eV for ethylhydroperoxide. Table 1 presents the IEs for the different C4 isomers of alkylhydroperoxides and ketohydroperoxides deriving from n-butane and shows that the values are between 9.33 and 9.36 eV for the two possible alkylhydroperoxides and between 9.20 and 9.39 eV for the three ketohydroperoxides, the formation of which is the most probable. The largest difference between vertical and adiabatic IEs of the alkylhydroperoxides and ketohydroperoxides of Table 1 is of 1.1 eV. Note that the formation of cyclic ethers with a hydroperoxide function was also considered in the model. Their mass is also 104. As shown in Table 1, their IEs are in the reasonable range. The model has been generated so that the reactions and products deriving from the isomerizations of peroxyhydroperoxyalkyl radicals are considered in detail. However simulations show that the formation of ketohydroperoxides is larger by a factor of ten than that of cyclic hydroperoxides.
Table 1.
Adiabatic (IEa) and vertical (IEv) ionization energies (in eV) of most expected isomers of masses 90, 104, 86 and 88 deriving from n-butane.
| Mass | Formula | IEa | IEv |
|---|---|---|---|
| 90 |

|
9.33* | 10.06* |
|
|
9.36** | ||
| 104 |

|
9.34* | 9.91* |

|
9.39* | 10.40* | |

|
9.20* | 9.87* | |
|
|
9.37* | ||

|
9.25* | 10.35* | |
| 86 |

|
9.23- 9.30** |
|
|
|
9.54* | ||
| 88 |

|
9.46* | 9.95* |
|
|
9.71* | 10.28* | |

|
9.37* | 10.17* | |

|
9.43 | ||
|
|
9.17 |
Theoretical calculations,
From [12].
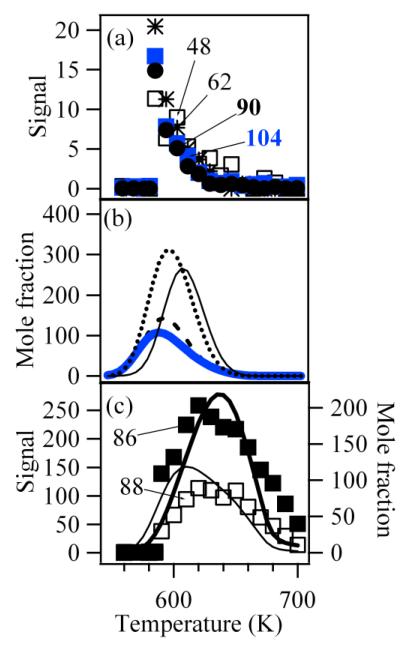
Figure 5a displays the experimental evolution of the signal at masses 48, 62, 90 and 104 as a function of temperature. Note the very particular shape of these profiles with a sharp peak around 590 K. Masses 48, 62, 90 and 104 are the only masses detected in this study presenting such a profile characteristic of compounds rapidly decomposing when the temperature increases.
Figure 5.
Evolution with temperature of (a) the experimental signals (arbitrary units) at mass 48, 62, 90 (the signal is divided by 4) and 104, of (b) the computed mole fractions (ppm) of hydroperoxides (thin full line for the mole fraction of CH3OOH which is divided by 5, dotted line for the mole fraction of C2H5OOH, broken line for the mole fraction of C4H9OOH and thick full line for that of ketohydroperoxides) and of the signals (arbitrary units) at mass 86 and 88 and the sum of the computed mole fractions (ppm) of C4 compounds including two carbonyl groups (thick line, divided by 3) and of the sum of those of hydroxybutanal and hydroxybutanone (thin line).
Figure 5b displays simulated mole fractions of the hydroperoxides identified in this study. Simulations reproduce well the experimental observation of the peak shape of the mole fraction profiles of these four products. In experiments and simulations, all hydroperoxides are completely consumed above 660 K. Simulations also reproduce well the consumption of C1 and C2 hydroperoxides, which occurs at a slightly higher temperature than that of C4 compounds.
This study presents for the first time a detailed speciation of the hydroperoxides formed by the oxidation of an organic compounds under conditions very close to those observed during the reaction period prior to auto-ignition. The importance of hydroperoxides, especially ketohydroperoxides, as the species responsible of degenerate branched chain reactions during the low-temperature oxidation of organic compounds, is well accepted since a long time [18]. However very few direct experimental evidences are available. The identification of ketohydroperoxides made by Sahetchian et al. [19] was mostly obtained under conditions for which the observed chemistry was not really that occurring when auto-ignition or cool flames are observed. These authors have worked under optimal conditions to maximize the formation of hydroperoxides, i.e. at very low temperatures (498-518 K) and with very large excess of oxygen (an equivalence ratio of 0.016). Consequently they have not observed the formation of the derived conjugated alkenes and of cyclic ethers, which are the main products of low-temperature oxidation of organic compounds under more classical conditions.
Photoionization cross sections of hydroperoxides are unknown, it is thus difficult to give more quantitative results. However since IEs of the C4 hydroperoxides are close of those of the main C4H8O compounds, close values of photoionization cross sections could be assumed for all these C4 oxygenated species: the experimental maximum mole fraction of butylhydroperoxides would then be only about 6 times lower than that of C4H8O compounds, which is well reproduced by simulation. A more surprising experimental observation, which is not reproduced by simulation, is that the signal of butylhydroperoxides would be 4 times larger than that attributed to ketohydroperoxides. Butylhydroperoxides are mainly obtained by disproportionations of butylperoxy radicals and HO2. At 600 K, less than 10% of butylhydroperoxides are obtained from H-abstractions by butylperoxy radicals and important uncertainties exist on the rate constants of these last reactions.
III.3 Formation of products deriving from ketohydroperoxides
The mass spectrum of Fig. 3 includes peaks at masses 86 and 88. Table 1 also presents IEs for the different compounds which can be proposed for those at masses 86 and 88. Fig. 5c displays the experimental evolution of the signal at masses 86 and 88 with temperature.
The peak at mass 86 could include two products with an IE equal to 9.25 and to 9.55 eV (see Fig. 4), respectively. That can correspond to the two isomers including two carbonyl groups as shown in Table 1. These compounds can easily derive from reactions of the ketohydroperoxides described above. Ketohydroperoxides react by decomposition of the O-OH bond to give alkoxy radicals, the decomposition of which by breaking a C-H bond can lead to the formation a second carbonyl group. The peak at mass 88 could also include two products with an IE equal to 9.45 and to 9.75 eV (see Fig. 4), respectively. The mass 88 could also correspond to two compounds which were not considered: butanoic acid, because its IE is equal to 10.17 eV [13], and dioxane, because this cyclic molecule could not easily be formed from n-butane by gas-phase reactions. As shown in Table 1, the IE of the first product corresponds to that of 1-butenylhydroperoxide. However, this compound contributes certainly only to a minor part of the peak at mass 88, because the shape of the related evolution with temperature of the signal does not indicate a product rapidly decomposing when temperature increases, as it should be the case for a hydroperoxide. The IE of the first product can also correspond to hydroxybutanone and that of the second one to hydroxybutanal. These compounds can also derive from ketohydroperoxides: the alkoxy radicals obtained by decomposition of the O-OH bond can react either by disproportionation with HO2 radicals or by H-abstractions with the reactant.
The fact that the maximum of the signal at masses 86 and 88 occurs at a temperature about 30 K higher than that of the maximum of the signal at mass 104 supports the hypothesis that these masses correspond to products deriving from ketohydroperoxides.
The reactions of formation of alkoxy radicals from the decomposition of ketohydroperoxides and the reactions of consumption of these radicals by β-scission of a C-H or a C-C bond (rate constant taken from [20]), by disproportionation with HO2 radicals (analogy with RO2 radicals) and by H-abstractions from n-butane (analogy with OH radicals) have been added to the mechanism. The shape of the simulated evolution with temperature of the sum of the computed mole fractions of C4 compounds including two carbonyl groups and of the sum of those of hydroxybutanal and hydroxybutanone (see Fig. 5c) corresponds mostly to the shape of the experimental signal at masses 86 and 88, respectively. The computed formation of compounds including an alcohol function occurs at slightly lower temperatures than in experiments. Note that the relative photoionization cross sections of these species are unknown and probably different for the two compounds since their EIs are different.
CONCLUSION
Using a new system coupling a jet-stirred reactor to molecular beam mass spectrometry combined with tunable synchrotron vacuum ultraviolet photoionization, the hydroperoxides responsible for the auto-ignition of n-butane have been identified:
Methylhydroperoxide,
Ethylhydroperoxide,
Butylhydroperoxides,
Butylhydroperoxides including a carbonyl group (ketohydroperoxides).
Supporting the identification of ketohydroperoxides, the formation of deriving species, C4 molecules including either two carbonyl groups or one carbonyl and one alcohol functions, has also been observed. The formation of these species will have to be considered if an increased accuracy of the models is sought.
Supplementary Material
ACKNOWLEDGEMENT
This work was supported by European Commission (“Clean ICE” ERC Advanced Research Grant), Région Lorraine, Chinese Academy of Sciences, Natural Science Foundation of China (50925623), and Ministry of Science and Technology of China (Grant no. 2007DFA61310 and 2007CB815204). The authors gratefully acknowledge Dr. Paul Winter, Prof. Timothy Zwier, and Mr. Jaime Stearns in Purdue University for supplying the computer program used to evaluate the Franck–Condon factors. We thank Prof. J. F. Pauwels and D. Leray for their help in designing the coupling with the quartz reactor, S. Bax, H. Legall and P. Aury for technical assistance in France, and Dr. Lidong Zhang and Tao Yuan for help in calculations of the Franck–Condon factors.
Footnotes
SUPPLEMENTARY MATERIAL: Mechanism for the low-temperature oxidation of n-butane: mechanism-Battin-Leclerc et al.
REFERENCES
- [1].Li Y, Qi F. Acc. Chem. Research. 2010;43:68–78. doi: 10.1021/ar900130b. [DOI] [PubMed] [Google Scholar]
- [2].Taatjes CA, Hansen N, McIlroy A, Miller JA, Senosiain JP, Klippenstein SJ, Qi F, Sheng L, Zhang Y, Cool TA, Wang J, Westmoreland PR, Law ME, Kasper T, Kohse-Hoïnghaus K. Science. 2005;308:1887–1989. doi: 10.1126/science.1112532. [DOI] [PubMed] [Google Scholar]
- [3].Dagaut P, Reuillon M, Cathonnet M. Combust. Flame. 1995;101:132–140. [Google Scholar]
- [4].Hakka MH, Glaude PA, Herbinet O, Battin-Leclerc F. Combust. Flame. 2009;156:2129–2144. doi: 10.1016/j.combustflame.2009.12.008. [DOI] [PMC free article] [PubMed] [Google Scholar]
- [5].Pollard RT. Hydrocarbons. In: Bamford CH, Tipper CFH, editors. Comprehensive chemical kinetics: gas-phase combustion. Vol. 17. Elsevier; Amsterdam: 1977. [Google Scholar]
- [6].Carlier M, Fittschen C, Minetti R, Ribaucour M, Sochet LR. Combust. Flame. 1994;96:201–211. [Google Scholar]
- [7].Biet J, Hakka MH, Warth V, Glaude PA, Battin-Leclerc F. Energy & Fuel. 2008;22:2258–2269. [Google Scholar]
- [8].Qi F, Yang R, Yang B, Huang CQ, Wei LX, Wang J, Sheng LS, Zhang YW. Rev. Sci. Instrum. 2006;77:084101. [Google Scholar]
- [9].Huang C, Yang B, Yang R, Wang J, Wei L, Shan X, Sheng L, Zhang Y, Qi. F. Rev. Scien. Inst. 2005;76:126108. [Google Scholar]
- [10].Buda F, Bounaceur R, Warth V, Glaude PA, Fournet R, Battin-Leclerc F. Combust. Flame. 2005;142:170–186. [Google Scholar]
- [11].Kee RJ, Rupley FM, Miller JA. SAND89-8009B. Sandia Laboratories; 1993. [Google Scholar]
- [12].Li Y, Zhang L, Tian Z, Yuan T, Yang B, Yang J, Qi F. Energy & Fuels. 2009;23:1743–1485. [Google Scholar]
- [13].NIST Chemistry Webbook . NIST Standard Reference Database 69. NIST; Gaithersburg, MD: 2005. http://webbook.nist.gov/chemistry/ [Google Scholar]
- [14].Montgomery JA, Frisch MJ, Ochterski JW, Petersson GA. J. Chem. Phys. 1999;110:2822–2827. [Google Scholar]
- [15].Frisch MJ, et al. Gaussian03. revision B05 Gaussian, Inc.; Wallingford, CT: 2004. [Google Scholar]
- [16].Ramos C, Winter PR, Zwier TS, Pratt ST. J. Chem. Phys. 2002;116:4011. [Google Scholar]
- [17].Yang B, Huang C, Wei L, Wang J, Sheng L, Zhang Y, Qi. F. Chem. Phys. Lett. 2006;423:321–326. [Google Scholar]
- [18].Walker RW, Morley C. Basic chemistry of combustion. In: Pilling MJ, editor. Comprehensive Chemical Kinetics: low-temperature combustion and autoignition. Vol. 35. Elsevier; Amsterdam: 1997. [Google Scholar]
- [19].Sahetchian K, Rigny R, Circan S. Combust. Flame. 1991;85:511–514. [Google Scholar]
- [20].Blin-Simiand N, Jorand F, Brun M, Kerhoas L, Malosse C, Einhorn J. Combust. Flame. 2001;126:1524–1532. [Google Scholar]
- [21].Rauk A, Boyd RJ, Boyd SL, Henry DJ, Radom L. Can. J. Chem. 2003;81:431–442. [Google Scholar]
Associated Data
This section collects any data citations, data availability statements, or supplementary materials included in this article.


