Abstract
Leptin is a powerful inhibitor of bone formation in vivo. This antiosteogenic function involves leptin binding to its receptors on ventromedial hypothalamic neurons, the autonomous nervous system and β-adrenergic receptors on osteoblasts. However, the mechanisms whereby leptin controls the function of ventromedial hypothalamic antiosteogenic neurons remain unclear. In this study, we compared the ability of leptin to regulate body weight and bone mass and show that leptin antiosteogenic and anorexigenic functions are affected by similar amounts of leptin. Using a knock-in of LacZ in the leptin locus, we failed to detect any leptin synthesis in the central nervous system. However, increasing serum leptin level, even dramatically, reduced bone mass. Conversely, reducing serum-free leptin level by overexpressing a soluble receptor for leptin increased bone mass. Congruent with these results, the high bone mass of lipodystrophic mice could be corrected by restoring serum leptin level, suggesting that leptin is an adipocyte product both necessary and sufficient to control bone mass. Consistent with the high bone mass phenotype of lipodystrophic mice, we observed an advanced bone age, an indirect reflection of premature bone formation, in lipodystrophic patients. Taken together, these results indicate that adipocyte-derived circulating leptin is a determinant of bone formation and suggests that leptin antiosteogenic function is conserved in vertebrates.
A growing body of work has established the central role of the hypothalamus in the regulation of bone formation by osteoblasts (1-4). The thrust of this influence is exerted by neurons located in the ventromedial hypothalamus. These neurons are themselves the target of leptin, which was demonstrated to be a powerful antiosteogenic hormone (1). Based on chemical lesioning, genetic manipulations, and pharmacological experiments, hypothalamic neurons mediating leptin antiosteogenic and anorexigenic functions could be distinguished. Moreover, genetic evidence indicates that, peripherally, the sympathetic nervous system mediates preferentially leptin antiosteogenic function (2). Thus leptin uses distinct pathways to regulate bone mass and body weight.
The discovery of leptin antiosteogenic function was a surprise for at least two reasons. First, it was not the function for which leptin was molecularly cloned, and this implied a more pleiotropic role for this hormone than originally anticipated. Second, and more important physiologically, the high bone mass of leptin signaling-deficient mice existed despite the presence of an increase in bone resorption caused by the hypogonadism of these mice. This coexistence of hypogonadism and high bone mass is pivotal to appreciate the physiological importance of leptin antiosteogenic function. Indeed, it established genetically that leptin signaling plays a dominant role over gonadal function in the regulation of bone mass and thereby implied that this is a major function of leptin.
In the present study we addressed several questions raised by the identification of leptin as an antiosteogenic hormone. Specifically, can we assess in vivo the relative importance of leptin antiosteogenic and anorexigenic functions, can we determine whether the blood circulation is the main, if not the only, mean whereby leptin regulates bone mass, and, lastly, can we provide evidence suggesting a conservation of this function during evolution?
Materials and Methods
Animals. Ob/+ mice were obtained from The Jackson Laboratory. Generation of A-ZIP/F-1 and SAP-Leptin transgenic mice has been reported (5-7). ApoE-leptin transgenic mice were generated by cloning the mouse Leptin cDNA 3′ of the liver specific Apolipoprotein E promoter and 5′ of the liver-specific enhancer sequence contained in the pLiv7 construct. ApoE-ObRe mice were generated by inserting the ObRe cDNA of the ObR gene into pLiv7. ApoE-leptin and ApoE-ObRe mice were generated on a FVB and C57BL6J background, respectively, and two independent strains were analyzed for each strain. The knock-in of nuclear LacZ gene into the Leptin locus was generated by replacing exon 3 of the leptin coding sequence by the nuclear lacZ gene fused to the neomycin-resistant gene. Electroporation of embryonic stem (ES) cells, subsequent selection, injection of positive clones into blastocysts, and implantation into pseudopregnant females were done according to standard protocols (8).
Intracerebroventricular (ICV) Infusions. A 28-gauge cannula (Brain infusion kit II, Alza) infusing human leptin (Sigma) for 28 days was implanted into the third ventricle of 2-month-old C57BL6J female mice, as described (1). The cannula was connected to an osmotic pump (Alza) placed in the dorsal s.c. space of the animal.
5-Bromo-4-chloro-3-indolyl β-d-Galactoside (X-Gal) Staining. Animals were killed at 2 months of age, and the tissues were dissected in cold PBS. X-Gal staining was done according to standard protocols (9). Specimens were postfixed in phosphate buffered formalin for 5 h, dehydrated, cleared, and embedded in paraffin. Specimens were cut at 7 μm, and nuclei were stained with Hoechst reagent.
Leptin-Induced STAT3-luc Reporter Analysis. Recombinant histidine-tagged rObRe was produced in vitro in 293EBNA cells and purified on a nickel-nitrilotriacetic affinity column (Qiagen, Valencia, CA) according to the manufacturer's recommendations (a detailed procedure is available in Supporting Text, which is published as supporting information on the PNAS web site). HEK293 cells stably expressing ObRb were transfected by Fugene reagent (Roche Diagnostics) with a STAT3-Luc leptin-responsive construct (kindly provided by C. Li, University of Texas Southwestern, Dallas) and a β-galactosidase reporter construct for normalization. Recombinant human leptin (0.5 nM, Sigma) and rObRe (5 and 50 nM) were preincubated for 30 min at room temperature before addition to the cells for 3 h. Luciferase and β-galactosidase activities were measured according to standard protocols (8).
Gel Chromatography. 125I-leptin was used to trace bound and free leptin from serum after fractionation by FPLC (Amersham Pharmacia FPLC system) on a High load Superdex 200-16/60 column (Amersham Pharmacia) calibrated by using Bio-Rad gel filtration standards. A detailed procedure is available in Supporting Text.
Histology. Histological analyses were performed on undecalcified specimen as described (1). Static and dynamic histomorphometric analyses were performed according to standard protocols (10) using the Osteomeasure Analysis System (Osteometrics, Atlanta). Four to 10 animals were analyzed for each group. Controls for each group were WT littermates of the same sex, age, and genetic background. Statistical significance was assessed by Student's t test. Results are expressed as mean ± SE.
Serum Chemistry. Total leptin serum levels were measured by using an immunoassay kit from Linco Diagnostics, following the manufacturer's instructions.
Osseous Age Measurements. Osseous age was rated by a single radiologist unaware of the patient's chronological ages on radiographs of left hands and wrists, using the method of Greulich and Pyle (11).
Results
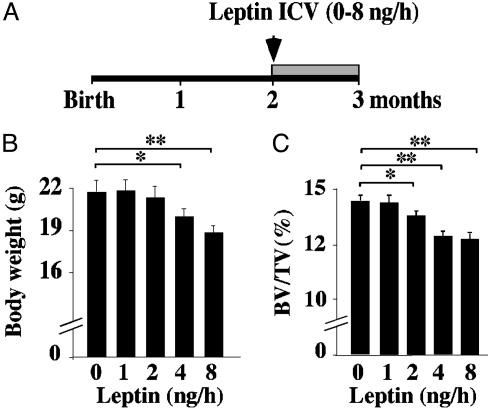
Comparison of Antiosteogenic and Anorexigenic Functions of Leptin. The existence of a high bone mass phenotype in the face of an increase in bone resorption in leptin signaling-deficient mice suggests that leptin antiosteogenic activity is a major function of this hormone. To test this contention in vivo we used ICV infusion of leptin in WT mice as a bioassay. We infused different amounts of this hormone for 1 month and used body weight and bone volume as indicators of leptin bioactivity (Fig. 1A). As reported (12), ICV infusion of leptin at 8 and, to a lesser extent, 4 ng/h significantly decreased body weight, whereas lower leptin doses failed to affect it significantly (Fig. 1B). ICV infusion of leptin at 8, 4, and even 2 ng/h significantly reduced bone mass of WT mice (Fig. 1C). The fact that similar amounts of leptin were needed to affect body weight and bone mass suggests that leptin anorexigenic and antiosteogenic functions are of equal importance in vivo. This is consistent with the fact that the antiosteogenic function of leptin was uncovered in a situation strongly favoring bone loss, not bone gain.
Fig. 1.
Comparison of leptin antiosteogenic and anorexigenic functions. (A) Two-month-old C57BL6J females were infused ICV for 28 days with the indicated amount of leptin. (B) The lowest leptin amount that significantly decreased body weight was 4 ng/h. (C) The lowest leptin amount that significantly decreased bone volume over tissue volume (BV/TV, %) was 2 ng/h (n = 8; *, P < 0.05; **, P < 0.005).
Absence of Leptin Production in the Brain. Different observations raised the formal hypothesis that serum leptin may not regulate bone mass. For instance, it has been difficult to date to correlate bone density, an indirect assessment of bone mass, and serum leptin level in humans (13-15). Moreover, leptin antiosteogenic action was more easily achieved by ICV infusion than by peripheral injection, and lastly, leptin expression has been detected by RT-PCR and immunocytochemistry in the mouse hypothalamus (16), where leptin antiosteogenic neurons reside (2). Together, these observations suggested the possibility that leptin was produced locally in the brain and that this local production was important in understanding leptin antiosteogenic function.
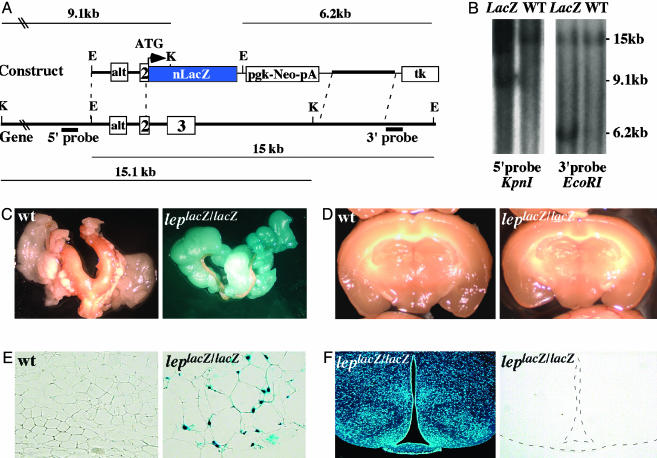
To test this hypothesis we first assessed leptin expression in various parts of the brain and in fat tissue by in situ hybridization (ISH). Despite several attempts, we failed to detect expression of Leptin in any brain area investigated at different developmental stages or postnatally, whereas fat tissues constitutively gave a strong signal (G. Eichele, personal communication). To rule out the possibility that a low level of Leptin transcripts, undetectable by ISH, was present in the brain as reported for other genes (9), we knocked-in the LacZ gene in the Leptin locus through homologous recombination in ES cells (Fig. 2A). LepLacZ/LacZ mice were obese and had a high bone mass phenotype (data not shown). LepLacZ/LacZ and WT littermates were analyzed for the presence of β-galactosidase activity in brain and adipose tissues. Strong X-Gal staining was observed in adipose tissue of homozygote animals (Fig. 2 C and E), whereas no staining could be detected in any brain area analyzed macroscopically and histologically (Fig. 2 D and F). Taken together, these results indicate that leptin is not produced locally in the brain, and thereby imply that circulating leptin must account for its antiosteogenic function.
Fig. 2.
Adipose tissue as the only detectable source of leptin. (A) Genomic organization of the Leptin locus and structure of the targeting vector. Probes used for Southern blots and restriction fragments are indicated. (B) Southern blots. The WT and lacZ knock-in loci gave, respectively, 15.0- and 6.2-kb bands with the 3′ probe, and 15.1- and 9.1 kb bands with the 5′ probe. E, EcoRI; K, KpnI. (C and D) X-Gal-stained gonadal adipose tissue and brain. Staining was detected exclusively in adipose tissue in LepLacZ/LacZ mice. No staining was detected in brain. (E and F) Histological examination of adipose and brain tissues after X-Gal staining. Nuclear staining was readily detectable in adipocyte nuclei, but no staining was observed in any brain section. A representative brain section containing arcuate and ventromedial hypothalamus neurons counterstained with Hoescht (Left) and stained with X-Gal (Right) are shown.
Raising Serum Leptin Level Decreases Bone Mass. If circulating leptin affects bone mass, then transgenic mouse models with high serum leptin level should have a low bone mass. To determine whether this is the case, we studied two transgenic mouse strains with different serum leptin levels.
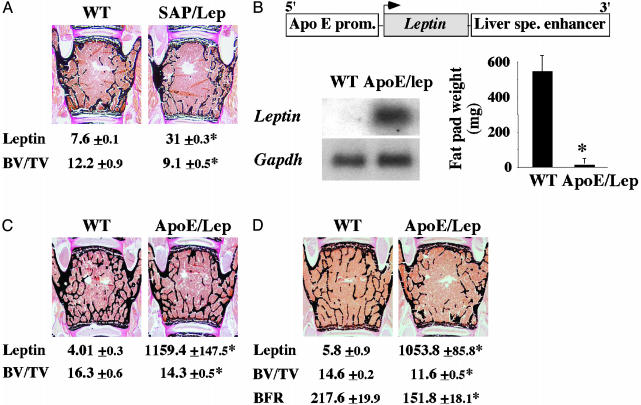
The first strain of mice was generated by using the liver-specific human serum amyloid P component (SAP) promoter to drive Leptin cDNA expression in liver (6). As reported, SAP-leptin transgenic mice had a moderate, i.e., 4-fold, increase in their serum leptin level compared to WT littermates (Fig. 3A). This resulted in a lower body weight and a complete absence of fat pads (6). Histological examination revealed that SAP-leptin transgenic mice also displayed a significant decrease in bone mass when compared to WT littermates, thus suggesting that serum leptin controls bone mass (Fig. 3A). The second leptin overexpressing mouse model was generated by using the Apolipoprotein E (ApoE) promoter and liver-specific enhancer (Fig. 3B). Northern blot analysis verified that the transgene was strongly expressed in liver (Fig. 3B). Accordingly, serum leptin level in ApoE-leptin transgenic mice was 200- to 300-fold higher than what was seen in WT littermates, at all time points analyzed (Fig. 3 C and D). This marked elevation of serum leptin level in ApoE-leptin transgenic mice resulted in a complete disappearance of fat pads (Fig. 3B) and in a decrease in food intake (data not shown), demonstrating that leptin signaling was increased in these animals. Likewise, we observed a significant decrease in bone mass in 3- and 6-month-old ApoE-leptin mice, regardless of the sex of the animals (Fig. 3 C and D). The low bone mass phenotype observed in ApoE-leptin mice was accompanied by a reduction in the bone formation rate (Fig. 3D). Taken together, these results demonstrate that increasing serum leptin level, even to very high levels, results in a reduction of osteoblastic activity and a subsequent low bone mass.
Fig. 3.
Increasing serum leptin reduces bone mass. (A) Six-month-old SAP-Leptin mice are mildly hyperleptinemic (leptin, ng/ml) and display a low bone volume over tissue volume (BV/TV, %) compared to controls (n = 4; *, P < 0.05). (B) Schematic representation of the ApoE/Lep transgene. Northern blot analysis confirmed the expression of the transgene in liver. ApoE/Lep mice have no fat pads (n = 8; *, P < 0.01). (C and D) Compared to controls, ApoE/lep mice at 3 (C) and 6 (D) months of age displayed a reduced bone volume and a decreased BFR/BS (μm3/μm2 per yr) despite a 200- to 300-fold increase in serum leptin level (ng/ml) (n = 8; *, P < 0.05).
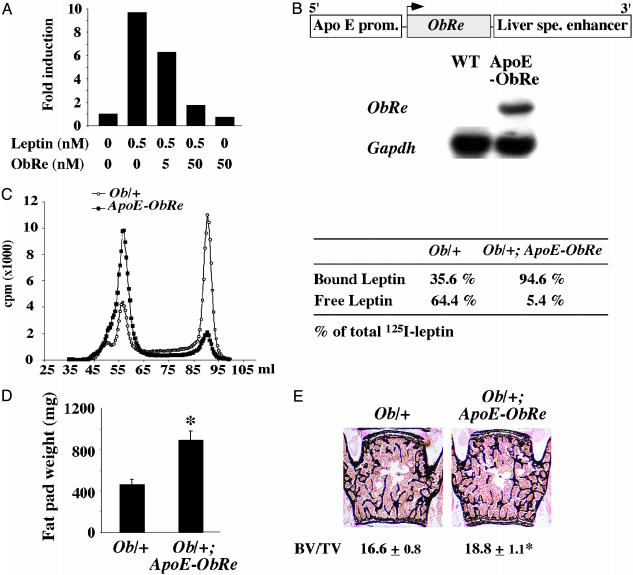
Reducing Serum-Free Leptin Level Increases Bone Mass. To further address the role of circulating leptin and to determine whether free, i.e., unbound, serum leptin is a determinant of bone mass, we attempted to decrease the level of circulating free leptin by transgenesis. ObR, the leptin receptor gene, encodes five different forms of the leptin receptor through alternative splicing. One of these forms, ObRe, lacks the transmembrane domain found in all other isoforms, and therefore behaves as a soluble receptor for leptin (17). By analogy with other physiological regulatory loops in bone, we reasoned that ObRe could serve as a decoy receptor for leptin. This would be reminiscent of the role that osteoprotegerin plays as a decoy receptor for RANK-L, a critical regulator of bone resorption (18). The potency of ObRe to inhibit leptin signaling was first established in vitro by showing that recombinant ObRe inhibits the activity of a STAT3-dependent luciferase reporter construct, induced by leptin treatment of 293 cells expressing the ObRb receptor (Fig. 4A). We then used ApoE regulatory elements to overexpress ObRe in liver and systemically (Fig. 4B). ApoE-ObRe transgenic mice had a moderate but nonsignificant increase in body weight, fat pad weight, and bone mass (data not shown). We reasoned that this relative lack of efficacy of the ObRe transgene could be explained by a serum leptin level still too high relative to the level of ObRe expression in ApoE-ObRe transgenic mice. If this was the case, then transferring the ObRe transgene to mice with a lower leptin level should uncover any phenotypic abnormalities secondary to the decrease in circulating free leptin. Serum leptin level is lower in Ob/+ mice than in WT mice (4.01 ± 0.3 ng/ml in Ob/+ mice vs. 5.7 ± 0.1 ng/ml in WT mice, P < 0.05, n = 12 per group). We therefore crossed them with ApoE-ObRe mice to generate ApoE-ObRe;Ob/+ mice.
Fig. 4.
Decreasing serum free leptin level increases bone mass. (A) Leptin-induced STAT3 reporter activity is decreased by ObRe treatment. (B) Schematic representation of the ApoE-ObRe transgene. Northern blot analysis confirmed the expression of the transgene in liver. (C) Size fractionation chromatogram. Marked reduction in serum free leptin level in Ob/+; ApoE-ObRe mice compared to Ob/+ mice (a representative chromatogram is shown, n = 4). (D and E) Three-month-old Ob/+; ApoE-ObRe mice had a significant increase in gonadal fat pad weight (D) and in bone volume over tissue volume (BV/TV, %) (E) compared to controls (n = 8; *, P < 0.05).
Protein size fractionation through gel filtration indicated that serum-free leptin level was reduced in ApoE-ObRe;Ob/+ compared to Ob/+ mice. As shown in Fig. 4C, free leptin (fraction 90, 16-17 kDa) was efficiently separated from the bound form of leptin (fraction 58, 310 kDa). The size of the bound form of leptin is consistent with leptin binding to dimers of ObRe (19). Free leptin fraction represented ≈65% of total leptin in the Ob/+ mouse serum and only 5.4% in ApoE-ObRe;Ob/+ mouse serum. This decrease in circulating free leptin led to a significant increase in the fat pad weight of these mice (Fig. 4D) and, as hypothesized, to a significant increase in bone mass compared to Ob/+ mice (Fig. 4E). These results establish that circulating free leptin is a determinant of bone mass.
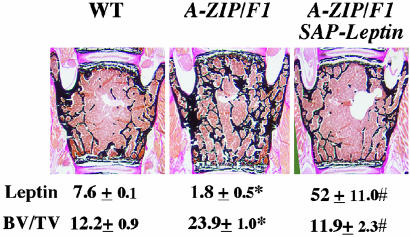
Leptin, Lipodystrophy, and Bone Mass. We have previously shown that A-ZIP/F1 lipodystrophic mice have a high bone mass phenotype, indicating that adipocytes are necessary for the control of bone mass (1). To test whether leptin is the adipocyte-derived gene product responsible of this phenotype, we crossed the A-ZIP/F1 mice with the SAP-Leptin overexpressing mice and compared the bone volume of the double transgenic mice to the one of A-ZIP/F1 and WT mice. In contrast to A-ZIP/F1 mice, A-ZIP/F1;SAP-Leptin mice had a normal bone mass (Fig. 5), indicating that leptin is an adipocyte gene product that is both necessary and sufficient to control bone formation.
Fig. 5.
Leptin and bone mass in lipodystrophic mice. Expression of the SAP-leptin transgene in the A-ZIP/F1 genetic background increased serum leptin levels (ng/ml) and corrected the high bone mass of A-ZIP/F1 mice (n = 4; *, controls versus A-ZIP/F1, P < 0.05; #, A-ZIP/F1 versus A-ZIP/F1;SAP-leptin, P < 0.05).
The critical role of leptin in the control of bone mass in mice raised the question of its role in humans. The high bone mass phenotype observed in lipodystrophic mice suggested that, if leptin antiosteogenic function was conserved, lipodystrophic patients should have evidence of an increased bone formation. This is obviously a difficult question to address for several reasons. First, ethical considerations prevent the collection of bone biopsies from these patients. Second, there are no weight- and age-matched controls that can be used in indirect methods to measure bone density. Because of these limitations, we used as an indirect but suggestive indicator of bone formation the osseous age of prepubertal patients affected by congenital generalized lipodystrophy. All lipodystrophic patients displayed low to undetectable circulating levels of leptin (Table 1) and had, regardless of their sex, a marked advance in bone age. The same advance in bone age was also observed in a single leptin-deficient child to whom we had access to (J. Licino, personal communication). These correlative data are in agreement with what was observed in lipodystrophic mice, and suggest that serum leptin in humans also controls bone homeostasis.
Table 1. Lipodystrophic patients have low to undetectable serum leptin levels and an advanced bone age.
| Patient
|
||||||||
|---|---|---|---|---|---|---|---|---|
| 1 | 2 | 3 | 4 | 5 | 6 | 7 | 8 | |
| Sex | M | M | M | F | F | F | F | F |
| Leptin, ng/ml | 0.23 | ND | ND | 0.68 | 1.4 | 0.22 | 0.37 | 0.25 |
| Chronological age | 6.0 w | 5.0 m | 1.7 y | 1.9 y | 3.0 y | 4.0 y | 8.0 y | 13.0 y |
| Bone age | 4.5 m | 1.0 y | 2.3 y | 2.6 y | 7.5 y | 5.0 y | 11.0 y | 15.0 y |
M, male; F, female; ND, not determined; w, weeks; m, months; y, years.
Discussion
Our studies show that leptin is equipotent in the control of body weight and bone mass and that circulating leptin, at low or high concentrations, regulates bone mass. Furthermore, available evidence suggests that this function of leptin is, like its other functions, conserved between mouse and human.
The fact that leptin antiosteogenic function was uncovered in animals that have an increased bone resorption was already a suggestive indication that it should be a major function of this hormone. That leptin antiosteogenic function could be achieved with a dose similar to the one needed to affect body weight in WT mice confirms experimentally this contention. This observation, and others previously reported, suggest that leptin is a general neuroendocrine regulator of body weight, reproduction and bone mass (1). A parallel exists between the pleiotropic functions of leptin and for example the multiple functions of insulin. Indeed, besides its crucial role in the regulation of blood glucose level that led to its identification, it is now evident that insulin has other important functions, such as regulating life span in invertebrates and vertebrates (20-22).
Several lines of evidence establish that neuronal antiosteogenic pathways are controlled by serum leptin level. First, we failed to detect Leptin transcripts in the hypothalamus or elsewhere in the brain. Second, increasing serum leptin level decreased bone mass. This was true even with an extreme elevation of serum leptin level, indicating that hypothalamic neurons remain sensitive even when serum leptin level is increased >200-fold. However, the sensitivity of ventromedial hypothalamus neurons to leptin must be partially abrogated because ApoE-leptin mice did not have a lower bone mass than SAP-leptin mice. In that respect, it should be noted that Ay/a mice, which are resistant to leptin administration, have a decreased expression of neuropeptide Y (NPY) and Agouti-related peptide mRNA compared to leptin signaling-deficient mice, indicating that, despite the absence of effect on body weight, the leptin signal is still sensed to a certain extent by hypothalamic neurons in these mice (23, 24). Third, decreasing serum-free leptin level by overexpressing the leptin-soluble receptor ObRe led to an increase in bone mass. Finally this role played by circulating leptin is important to interpret other data present in the literature. For instance, although NPY-deficient mice have no bone phenotype (25), mice lacking the Y2 or both Y2 and Y4 receptors have a high bone mass phenotype and a marked decrease in serum leptin level (3, 4).
Interestingly, in terms of bone biology, a parallel can be made between ObRe, which modulates the function of leptin, the major hormonal regulator of bone formation, and osteoprotegerin, another decoy receptor regulating the activity of RANK-L, the major regulator of bone resorption (26). These results suggest that bone formation and bone resorption are controlled, at least in part, by the interplay of circulating factors and decoy receptors.
Several observations suggest that leptin antiosteogenic function, like its other functions, is conserved during evolution. First, lipodystrophic mice have a high bone mass phenotype and, as shown here, lipodystrophic patients have an advanced bone age, an indirect evidence of premature bone formation. Second, beta-blockers increase bone formation and bone mass in mice and, in humans, beta-blockers have recently been shown to reduce the incidence of fracture in osteoporotic patients (27). Taken together, these observations suggest that leptin antiosteogenic function has been conserved during evolution.
Supplementary Material
Acknowledgments
We thank Drs. Li, Eichele, Ducy, Fauré, Maachi, and Mégarbané for reagents, patients, expertise, and critical reading of the manuscript. This work was supported by National Institutes of Health Grant DK 5883 and National Space Biomedical Research Institute Grant NCC9-58 (to G.K.), the Children's Nutrition Research Center (G.K. and F.E.), and the Arthritis Foundation (S.T.).
Abbreviations: ICV, intracerebroventricular; X-Gal, 5-bromo-4-chloro-3-indolyl β-d-galactoside.
References
- 1.Ducy, P., Amling, M., Takeda, S., Priemel, M., Schilling, A. F., Beil, T., Shen, J., Vinson, C., Rueger, J. M. & Karsenty, G. (2000) Cell 100, 197-207. [DOI] [PubMed] [Google Scholar]
- 2.Takeda, S., Elefteriou, F., Levasseur, R., Liu, X., Zhao, L., Parker, K. L., Armstrong, D., Ducy, P. & Karsenty, G. (2002) Cell 111, 305-317. [DOI] [PubMed] [Google Scholar]
- 3.Baldock, P. A., Sainsbury, A., Couzens, M., Enriquez, R. F., Thomas, G. P., Gardiner, E. M. & Herzog, H. (2002) J. Clin. Invest. 109, 915-921. [DOI] [PMC free article] [PubMed] [Google Scholar]
- 4.Sainsbury, A., Baldock, P. A., Schwarzer, C., Ueno, N., Enriquez, R. F., Couzens, M., Inui, A., Herzog, H. & Gardiner, E. M. (2003) Mol. Cell. Biol. 23, 5225-5233. [DOI] [PMC free article] [PubMed] [Google Scholar]
- 5.Moitra, J., Mason, M. M., Olive, M., Krylov, D., Gavrilova, O., Marcus-Samuels, B., Feigenbaum, L., Lee, E., Aoyama, T., Eckhaus, M., et al.(1998) Genes Dev. 12, 3168-3181. [DOI] [PMC free article] [PubMed] [Google Scholar]
- 6.Ebihara, K., Ogawa, Y., Masuzaki, H., Shintani, M., Miyanaga, F., Aizawa-Abe, M., Hayashi, T., Hosoda, K., Inoue, G., Yoshimasa, Y., et al. (2001) Diabetes 50, 1440-1448. [DOI] [PubMed] [Google Scholar]
- 7.Ogawa, Y., Masuzaki, H., Hosoda, K., Aizawa-Abe, M., Suga, J., Suda, M., Ebihara, K., Iwai, H., Matsuoka, N., Satoh, N., et al. (1999) Diabetes 48, 1822-1829. [DOI] [PubMed] [Google Scholar]
- 8.Ausubel, F. M. (1995) Current Protocols in Molecular Biology (Wiley Interscience, New York).
- 9.Wang, V. Y., Hassan, B. A., Bellen, H. J. & Zoghbi, H. Y. (2002) Curr. Biol. 12, 1611-1616. [DOI] [PubMed] [Google Scholar]
- 10.Parfitt, A. M., Drezner, M. K., Glorieux, F. H., Kanis, H. A., Malluche, H., Meunier, P. J., Ott, S. M. & Recker, R. R. (1987) J. Bone Miner. Res. 6, 595-610. [DOI] [PubMed] [Google Scholar]
- 11.Greulich, W. & Pyle, S. (1959) Radiographic Atlas of Skeletal Development of the Hand and Wrist (Stanford Univ. Press, Stanford, CA).
- 12.Halaas, J. L., Boozer, C., Blair-West, J., Fidahusein, N., Denton, D. A. & Friedman, J. M. (1997) Proc. Natl. Acad. Sci. USA 94, 8878-8883. [DOI] [PMC free article] [PubMed] [Google Scholar]
- 13.Goulding, A. & Taylor, R. W. (1998) Calcif. Tissue Int. 63, 456-458. [DOI] [PubMed] [Google Scholar]
- 14.Odabasi, E., Ozata, M., Turan, M., Bingol, N., Yonem, A., Cakir, B., Kutlu, M. & Ozdemir, I. C. (2000) Eur. J. Endocrinol. 142, 170-173. [DOI] [PubMed] [Google Scholar]
- 15.Rauch, F., Blum, W. F., Klein, K., Allolio, B. & Schonau, E. (1998) Calcif. Tissue Int. 63, 453-455. [DOI] [PubMed] [Google Scholar]
- 16.Ur, E., Wilkinson, D. A., Morash, B. A. & Wilkinson, M. (2002) Neuroendocrinology 75, 264-272. [DOI] [PubMed] [Google Scholar]
- 17.Tartaglia, L. A., Dembski, M., Weng, X., Deng, N., Culpepper, J., Devos, R., Richards, G. J., Campfield, L. A., Clark, F. T., Deeds, J., et al. (1995) Cell 83, 1263-1271. [DOI] [PubMed] [Google Scholar]
- 18.Simonet, S., Lacey, D. L., Dunstan, C. R., Kelley, M., Chang, M. S., Luthy, R., Nguyen, H., Wooden, S., Bennett, T. & Boone, T. (1997) Cell 89, 309-319. [DOI] [PubMed] [Google Scholar]
- 19.Devos, R., Guisez, Y., Van der Heyden, J., White, D. W., Kalai, M., Fountoulakis, M. & Plaetinck, G. (1997) J. Biol. Chem. 272, 18304-18310. [DOI] [PubMed] [Google Scholar]
- 20.Lee, S. S., Kennedy, S., Tolonen, A. C. & Ruvkun, G. (2003) Science 300, 644-647. [DOI] [PubMed] [Google Scholar]
- 21.Murphy, C. T., McCarroll, S. A., Bargmann, C. I., Fraser, A., Kamath, R. S., Ahringer, J., Li, H. & Kenyon, C. (2003) Nature 424, 277-283. [DOI] [PubMed] [Google Scholar]
- 22.Bluher, M., Kahn, B. B. & Kahn, C. R. (2003) Science 299, 572-574. [DOI] [PubMed] [Google Scholar]
- 23.Ollmann, M. M., Wilson, B. D., Yang, Y. K., Kerns, J. A., Chen, Y., Gantz, I. & Barsh, G. S. (1997) Science 278, 135-138. [DOI] [PubMed] [Google Scholar]
- 24.Kesterson, R. A., Huszar, D., Lynch, C. A., Simerly, R. B. & Cone, R. D. (1997) Mol. Endocrinol. 11, 630-637. [DOI] [PubMed] [Google Scholar]
- 25.Elefteriou, F., Takeda, S., Liu, X., Armstrong, D. & Karsenty, G. (2003) Endocrinology 144, 3842-3847. [DOI] [PubMed] [Google Scholar]
- 26.Boyle, W. J., Simonet, W. S. & Lacey, D. L. (2003) Nature 423, 337-342. [DOI] [PubMed] [Google Scholar]
- 27.Pasco, J., Henry, M., Sanders, K., Kotowicz, M., Seeman, E. & Nicholson, G. (2004) J. Bone Miner. Res. 19, 19-24. [DOI] [PubMed] [Google Scholar]
Associated Data
This section collects any data citations, data availability statements, or supplementary materials included in this article.


