Abstract
Background:
Stability Indicating Method (SIM) is a quantitative analytical procedure used to detect a decrease in the amount of the active pharmaceutical ingredient (API) present due to degradation. According to Food and Drug Administration (FDA) guidelines, an SIM is defined as a validated analytical procedure that accurately and precisely measures active ingredients (drug substance or drug product) free from potential interferences, such as degradation products, process impurities, excipients, or other potential impurities, and the FDA recommends that all assay procedures for stability studies be stability indicating. Here in this study we developed simple precise and accurate stability indicating reverse-phase high-performance liquid chromatographic (RP-HPLC) assay to analyze capsaicin (CAP) at concentrations from 70 to 130 μg/mL.
Materials and Methods:
HPLC equipped with Photo diode Array (PDA) detector, Pump model 600E of Waters and Empower software. Column used for the separation is ODS (250 × 4.6 mm) with particle size 5 μm and all the reagents and water were of HPLC grade.
Results:
The chromatographic separation was carried out using mobile phase Acetonitrile (ACN):water:buffer::75:10:15 with a flow rate of 1 mL/min on a C18 column. The concentration of the eluting compounds was monitored by a UV detector at 280 nm. No interferences were observed when stress conditions were applied and analyzed. Linearity was established using visual method, residuals plot, Dixon, and lack of fitness test. Limit of detection and limit of quantification was found to be 52.9 and 160 ng/mL, respectively. Recovery studies prove this method as useful in recovering the analytes. Relative Standard Deviation (RSD) of inter- and intraday precision within the acceptable limit of 2% proves that this method is precise. No degradation was found with alkaline conditions, thermal and photodegradation.
Conclusions:
This study can be used for successful separation of CAP and its potential degradants in bulk and formulations. UV spectra of one of the degradants are also presented here and can be the basis to generate chemistry of potential degradants when CAP is kept under environmental conditions.
Keywords: Capsaicin, stability indicating method, stress conditions, method validation
INTRODUCTION
Capsaicin (CAP) is the main alkaloid responsible for pungency in chillies and is used as a counterirritant balm for external application and it is also used in creamy to provide external pain relief for arthritis patients.[1] To date, research has shown that capsaicinoids, and CAP in particular, have a wide variety of biological and physiological activities which provide them functions, such as antioxidants, anticarcinogenics, promotion of energy metabolism and suppression of fat accumulation, and inflammations. However, the potential applications of these molecules are limited by the irritation caused by their pungency.[2]
Capsaicin (trans-8-methyl-N-vanillyl-6-nonenamide) is a crystalline, lipophilic, colorless, and odorless alkaloid with the molecular formula C18H27NO3 [Figure 1]. Its molecular weight is 305.40 g/mol, and it is fat-, alcohol- and oil-soluble. CAP displays cis/trans isomerism because the double bond prevents internal rotation. CAP is always found as the trans isomer because in the cis form, the –CH(CH3)2 and the longer chain on the other side of the double bond will be close together, causing them to repel each other slightly. This additional strain imposed causes the cis isomer to be a less stable arrangement than the trans isomer.[2]
Figure 1.
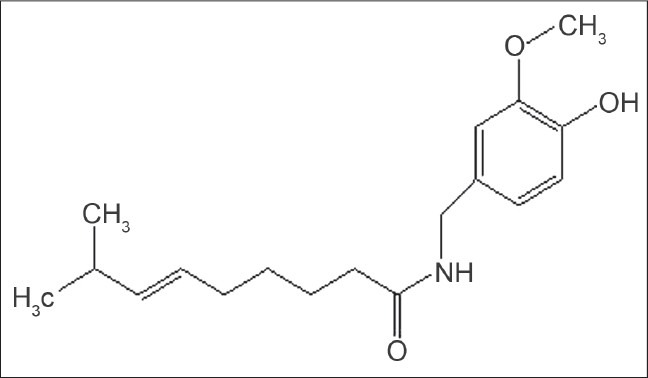
Chemical structure of capsaicin
CAP is known to be effectively absorbed topically from the skin. In a study of 12 subjects topically administered, a 3% CAP solution in three different vehicles (70% isopropyl alcohol; mineral oil; and propylene glycol in 20% alcohol), CAP was shown to be rapidly absorbed and to quickly reach maximum concentration when CAP is applied topically. The half-life of CAP was approximately 24 h.[3].
In an extensive study of CAP distribution in tissues, elimination and other active principles in animals with oral administration, nearly 94% of orally administered CAP was absorbed and maximum concentration in the blood was reached 1 h after administration. In addition, a maximum distribution of 24.4% of administered CAP in blood, liver, kidney, and intestine was seen in 1 h and then diminished notably until being undetected after 4 days.[4]
CAP metabolism is apparently similar in human, rat, and dog microsome. Three major metabolites have been identified for capsaicin: 16-hydroxycapsaicin, 17-hydroxycapsaicin, and 16,17-dihydrocapsaicin.[5] In vitro studies in human skin, CAP biotransformation was found to be slow and most CAP remained unchanged, whereas a small fraction was metabolized to vanillylamine and vanillyl acid. This suggests that cytochrome P450 enzymes participate minimally in CAP transformation in skin in comparison to their role in hepatic metabolism. CAP is mainly eliminated by the kidneys with a small untransformed proportion excreted in the feces and urine.[4,6]
There are many methods for estimation of CAP, including estimation by colorimetry,[7] capillary gas chromatography,[8] HPLC–fluorescence detector in human serum,[9] Ultra Performance Liquid Chromatography (UPLC),[10] liquid chromatography with electrochemical detection,[11] HPLC–MS–TOF,[12] High Performance Thin Layer Chromatography (HPTLC) method coupled with Gas Chromatography and Mass Spectroscopy (GC–MS) detection.[13] CAP is now utilized in various formulations as drug because of its proven biological activity. Forced degradation studies to know about the interaction of this drug with different environmental conditions are proposed and can be utilized as one of the quality control methods for pharmaceutical industries. Hence the aim of the present work is to develop and validate a reverse-phase high-performance liquid chromatography (RP–HPLC) method for determination of CAP in bulk, including its forced degradation studies.
MATERIALS AND METHODS
Waters HPLC equipped with PDA detector, Pump model 600E and Empower software. Column used for the separation is ODS (250 × 4.6 mm) with particle size 5 μm. CAP pure was purchased from Ozone International, Mumbai, India. All solvents were of HPLC grade and procured from Merck Limited, Mumbai.
Preparation of 0.05 % v/v Orthophosphoric acid (buffer)
Ortho Phosphoric Acid (OPA) (0.5 mL) was transferred into a 10 mL volumetric flask, volume was made up with HPLC grade water to obtain a solution of 5% v/v and 1 ml of this was further diluted up to 100 mL volume with HPLC grade water to obtain a solution of 0.05 % v/v. The solution was filtered with 0.45 μm filter.
Preparation of standard stock solution
Pure CAP (50 mg) was weighed and dissolved in ACN up to 25 mL to get the stock solution of 2000 μg/mL. The solution was then filtered with 0. 45 μm syringe filter.
Preparation of 0.1 N HCl
HCl (0.85 mL) was diluted up to 100 mL to obtain a solution of 0.1 normality. The solution was filtered with 0.45 μm filter.
Preparation of 0.1 N NaOH
NaOH (400 mg) was weighed and dissolved in a 100 mL volumetric flask and diluted up to the mark to obtain the desired concentration. The solution was filtered with 0.4 μm filter.
Selection for wavelength of detection
CAP (50 mg) was weighed and dissolved in methanol in 25 mL volumetric flask volume was made up to the mark with methanol to get stock solution of concentration 2000 μg/mL. From stock 0.25 mL was taken into a 10 mL volumetric flask and diluted up to the mark to obtain a solution of strength 50 μg/mL. This dilution was scanned in the UV spectrophotometer and λmax of CAP 280 nm was selected as wavelength of detection. Figure 2 represents the graph of CAP using UV spectrophotometer.
Figure 2.
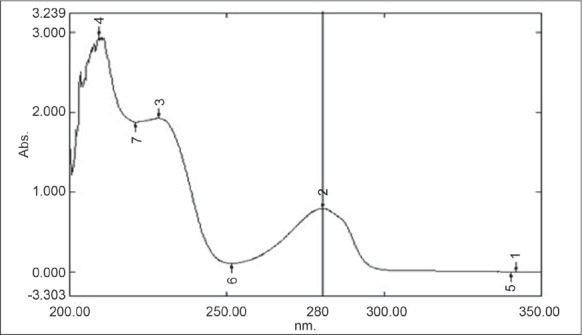
UV spectra of capsaicin showing peak at 280 nm
By analyzing UV spectra of CAP 280 nm (λmax > 254 nm of CAP) was selected as wavelength for detection.
Optimization of chromatographic conditions
Various combinations of methanol, ACN, and water were used to get symmetrical peak and system suitability parameters, such as capacity factor, tailing factor, and number of theoretical plates. Conditions were best optimized using mobile phase ACN:water:buffer::75:10:15 with a flow rate of 1 mL/min. Retention Time (RT) of peak was 6.14, plate count was 2180 (desirable is >2000), Tailing Factor (TF), was 1.25 (desirable is <1.5), and capacity factor was 5.15 (desirable is from 2 to 10). Figure 3 is the optimized chromatographic condition of CAP.
Figure 3.
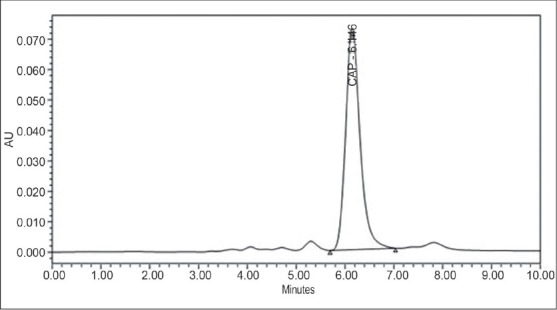
Optimized chromatographic condition by proposed method
Preparation of calibration curve
Suitable aliquots of standard stock (2000 μg / mL) 0.35, 0.4, 0.45, 0.5, 0.55, 0.6, and 0.65 mL were transferred into 10 ml volumetric flask and finally diluted to the mark with ACN to obtain a series of solutions of 70, 80, 90, 100, 110, 120, and 130 μg/mL, respectively. The prepared solutions were filtered with 0.45 μm filter and 20 μL was injected for each dilution. Same procedure was repeated three times.
The regression equation and regression coefficient from the mean of three determinations of the calibration curve was found to be y = 16442x – 91815 and 0.999, respectively. Overlay chromatogram and calibration curve are presented in Figures 4 and 5, respectively.
Figure 4.
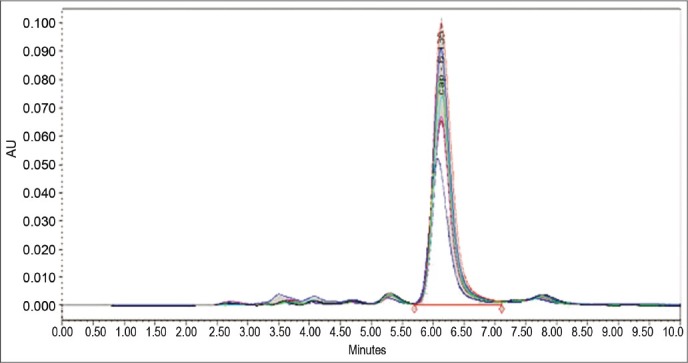
Overlay of calibration curve
Figure 5.
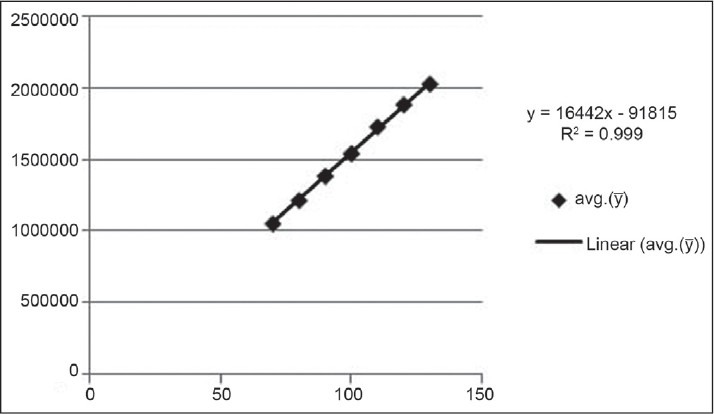
Calibration curve of capsaicin by the proposed method
Validation of the proposed method
Specificity
Specificity of the stability indicating method was established by separation of the principal peak with degradants during forced degradation. The stress conditions utilized were acid hydrolysis, alkaline hydrolysis, oxidation by peroxide, heat including both wet heat and dry heat, and photo degradation by UV light. Overall these studies were aimed to degrade 10%–30% of the drug. Overall summary of degradation studies are presented under Table 1
Table 1.
Overall summary of degradation studies

Acidic hydrolysis
Stock solution (0.5 mL) of CAP was transferred to a 10 mL volumetric flask; 1 mL 0.5 N HCl was added and kept for 4 h in dark, then the volume was made up to 10 mL. The solution was then filtered and three replicates of 20 μL were injected in the HPLC system.
Figures 6 and 7 represent chromatogram after acidic hydrolysis and UV spectra of degradant appearing in the chromatogram, respectively.
Figure 6.
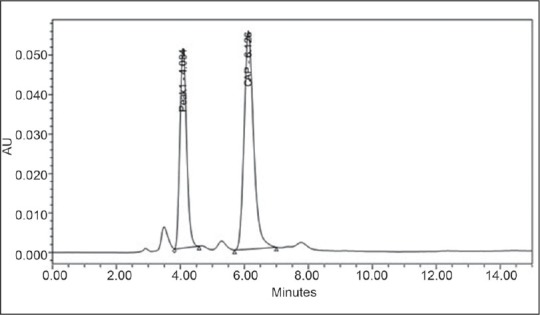
Chromatogram obtained by degradation of capsaicin with HCl
Figure 7.
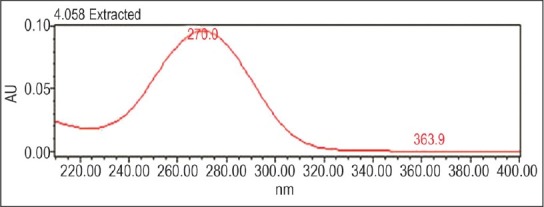
UV spectra of degradant obtained by acidic hydrolysis
RESULTS
The RT of main peak and degradant was 6.1 and 4.08, respectively. The resolution in the peak of CAP and degradant was 4.4 (desirable > 2). The plate count, TF, and capacity factor of both the peaks were also in limits. The percentage recovery of CAP was 75.07%.
Alkaline hydrolysis
Stock solution (0.5 mL of 2000 μg/mL) of CAP was transferred into a 10 mL volumetric flask, to this 1 mL 0.1 N NaOH was added and diluted to about 8 mL. The pH was adjusted to 6.8 with OPA and volume was made up to 10 mL with ACN. The solution was filtered and 20 μL was injected in three replicates.
Results: No degradation was found with 0.1 N NaOH.
Oxidative degradation by peroxide
0.5 ml of standard stock solution was transferred in 10 mL volumetric flask, then 1 mL H2O2 (6%) was added and kept for 2 h in dark. Final volume was made up to the mark with ACN. The solution was filtered and 20 μL was injected in HPLC system.
Result: The RT of CAP and degradant peak was at 6.14 and 3.49, respectively, and the resolution between the peaks is 5.65, plate count, TF, and capacity factor were also within desirable limits. The percentage recovery is 69.7%. The respective chromatogram is presented in Figure 8.
Figure 8.
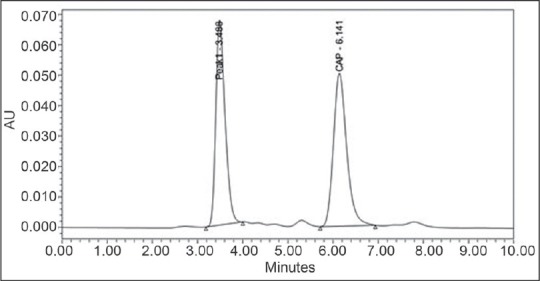
Chromatogram obtained by degradation of capsaicin with H2O2
Degradation by UV light
Standard stock solution (0.5 mL) was transferred into a 10 mL volumetric flask, 4–5 mL of ACN was added and kept in UV chamber for 12 h. The final volume was made up to the mark, filtered and 20 μL was injected into the HPLC system.
Result: No degradation was found by UV light.
Degradation by dry heat
CAP (10 mg) was weighed and transferred into a 10 mL volumetric flask and kept in hot air oven at 100°C for 2 h. Then, volume was made up to 10 mL with ACN and 1 mL of this solution was further diluted up to 10 mL to obtain 100 μg/mL solution, this was filtered and 20 μL was injected in HPLC system.
Result: No degradation was found by dry heat.
Degradation by wet heat
Stock (0.5 mL) was transferred into a 10 mL volumetric flask, about 5 mL ACN was added and kept in water bath maintained at 100°C for 2 h. Then, final volume was made up to the mark, the solution was filtered and 20 μL was injected in HPLC system.
Result: No degradation was found by wet heat.
The degradation studies shows that the drug is degraded under stressed acidic and oxidative conditions. The RT of degradant formed and the resolution between main and degradant peak by acidic hydrolysis and oxidation was 4.08 and 3.49, and 4.4 and 5.65, respectively [Table 1].
Linearity is accessed by four methods:
Visualizing method
Out of seven, location of three points below, three above and one on the trend line in the calibration curve shows the linearity.
Residual curve
Result is mentioned in Figure 9.
Figure 9.
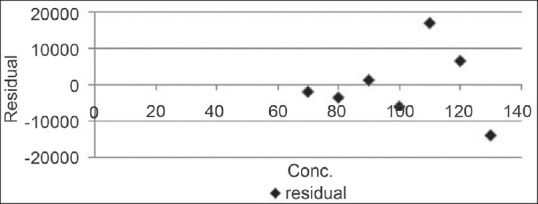
Residual curve for capsaicin
Dixon test for outliers: Data from Dixon test are presented in Tables 2 and 3.
Table 2.
Ascending series of data of calibration curve
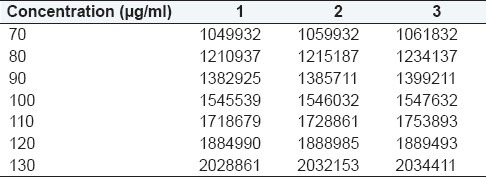
Table 3.
Data from Dixon test for outliers
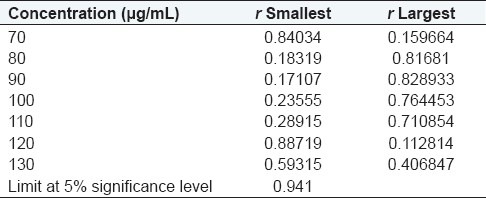
Result: There are no outliers in the data of calibration curve according to Dixon test.
Lack-of-fitness test
Linear function analysis or lack-of-fitness test is applied by calculation of SSr, SSє, SSlof, and their respective variances. The applicability of the method was analyzed by comparing the tabulated and calculated F ratio. Data for lack-of-fitness test is presented in Table 4.
Table 4.
Data for lack-of-fitness test for capsaicin

Calculation of Error Sum Squares:
Residual error sum squares

Lack-of-fit error sum squares
![]()
Calculation of Degrees of freedom:
DFr = (IJ – 2) = 19
DFє = (IJ – I) = 14
DFlof = (I – 2) = 5
Calculation of associated variance
σr2 = SSr/DFr=1.47E+08
σє2 = SSr/DFє = 8.76E+06
σlof2 = SSlof/DFlof = 3.14E+0
Acceptability of linearity data
F ratio = σlof2/σє2 = 3.59
Result: F tabulated at 95% confidence level is 4.56 and F calculated is 3.59, thus F (tabulated) > F(calculated), therefore the method is linear.
Range
Linearity range: 70–130 μg/mL.
Target range: 80–-120 μg/mL.
Working range: –0.66–130 μg/mL.
Target concentration: 100 μg/mL.
Precision
Repeatability: Repeatability was accessed by six replicates of test concentration, that is, 100 μg/mL; 20 μL was injected into the HPLC system.
Intraday precision: 0.4, 0.5, and 0.6 mL were taken from the standard stock solution and diluted to 10 mL to obtain the dilution of 80, 100, and 120 μg/mL solutions, respectively. Three replicates were injected three times a day.
Interday precision: Same procedure was followed to obtain 80%, 100%, and 120% of test concentration.
Results: The RSD of repeatability was 0.298 (desirable < 1%) and RSD of intraday and interday precision was 0.517 and 0.810, respectively (desirable < 2%). Hence, the method is precise.
Accuracy
A sample of 70 μg/mL was prepared by diluting 0.35 mL standard stock to 10 mL with ACN. In three 10 mL volumetric flasks 0.35 mL of standard stock was transferred and to them 0.05, 0.15, and 0.25 mL standard stock was spiked, respectively. Each of them diluted up to the mark and filtered with 0.45 μm syringe filter. Three replicates of 20 μL of each sample were injected [Table 5].
Table 5.
Recovery study of capsaicin

Result: The method recovered 98.9%–100.9% (desirable 98%–102%) of the analyte. Hence, the method is accurate.
Limit of detection and limit of quantification
Limit of detection (LOD) and limit of quantification (LOQ) were calculated through standard deviation of the response of calibration curve and were found to be 52.9 and 160 ng/mL, respectively.
LOD =3Sa/b
LOQ = 10Sa/b
where Sa is the standard deviation of the response and b is the slope of the calibration curve.[14]
System suitability testing
System suitability testing was performed by using six replicates of test concentrations. Variations in Tailing factor, asymmetry factor RT, and theoretical plates (N) were calculated as average of six replicates [Table 6].
Table 6.
Summary of system suitability parameters

Result: The RT, number of theoretical plates, capacity factor, tailing factor, and symmetry factor were found to be 6.14, 2179 (desirable > 2000), 5.26 (desirable 2–10), 1.25 (desirable < 1.5), and 1.25 (desirable < 2), respectively, from the mean of six determinations of test concentration.
CONCLUSIONS
In the present work, stability-indicating assay of CAP in bulk has been developed and validated. The method is capable of discriminating between the major active pharmaceutical ingredient from its degradation product formed by stressed conditions of acidic hydrolysis and oxidative degradation by peroxide. The developed method was validated in terms of specificity, linearity, precision, and accuracy. The method is specific as by forced degradation with acidic and oxidative conditions, the API peak was discriminating from the degradant peak with proper resolution. No degradation was found with alkaline conditions, thermal degradation, including both wet heat and dry heat and also with photostability. Linearity was proved by Dixon test of outliers and lack-of-fitness test. Limit of detection and limit of quantification was found to be 52.9 and 160 ng/mL, respectively; and recovery studies show that through this method, it is possible to recover the analyte. RSD of interday and intraday precision being within the acceptable limit of 2% proves that this method is precise. Results of degradation studies, summary of validation parameters, and optimized chromatographic condition; summary of validation parameters; and summary of system suitability parameters are presented in Tables 1, 7, and 8, respectively.
Table 7.
The final optimized chromatographic conditions for the method

Table 8.
Summary of validation parameters

Footnotes
Source of Support: Nil
Conflict of Interest: None declared.
REFERENCES
- 1.Umamaheshwari A, Lalitha V. In vitro effect of various growth hormones in Capsicum annuum L. on the callus induction and production of Capscaicin. J Plant Sci. 2007;2:545–51. [Google Scholar]
- 2.Reyes-Escogido ML, Gonzalez-Mondragon EG, Vazquez- Tzompantzi E. Chemical and pharmacological aspects of capsaicin. Molecules. 2011;16:1253–70. doi: 10.3390/molecules16021253. [DOI] [PMC free article] [PubMed] [Google Scholar]
- 3.Pershing LK, Reilly CA, Corlett JL, Crouch DJ. Effects of vehicle on the uptake and elimination kinetics of capsaicinoids in human skin in vivo. Toxicol Appl Pharmacol. 2004;200:73–81. doi: 10.1016/j.taap.2004.03.019. [DOI] [PubMed] [Google Scholar]
- 4.Suresh D, Srinivasan K. Tissue distribution and elimination of capsaicin, piperine and curcumin following oral intake in rats. Indian J Med Res. 2010;131:682–91. [PubMed] [Google Scholar]
- 5.Chanda S, Bashir M, Babbar S, Koganti A, Bley K. In vitro hepatic and skin metabolism of capsaicin. Drug Metab Dispos. 2008;36:670–5. doi: 10.1124/dmd.107.019240. [DOI] [PubMed] [Google Scholar]
- 6.Kawada T, Iwai K. In vivo and in vitro metabolism of dihydrocapsaicin, a pungent principle of hot pepper, in rats. Agric Biol Chem. 1985;49:441–8. [Google Scholar]
- 7.Bayonee NJ. Colorimetric determination of capsaicin in oleoresin of capsicum. Analy Chem. 1949;21:934–6. [Google Scholar]
- 8.Wooderck SH, Jaeho H, Jinbong H, Youngjung N. Effective separation and quantitative analysis of major heat principles in red pepper by capillary gas chromatography. Food Chem. 1994;49:99–103. [Google Scholar]
- 9.Lu J, Cwik M. Determination of capsaicin and zucapsaicin in human serum by high-performance liquid chromatography with fluorescence detection. J Chromatograph B: Biomed Sci Appl. 1997;701:135–9. doi: 10.1016/s0378-4347(97)00347-2. [DOI] [PubMed] [Google Scholar]
- 10.Jaeho Ha, Hye-Young Seo, You-Shin Shim, Dong-Won Seo, Homoon Seog, Masahito Ito, et al. Determination of capsaicinoids in foods using ultra high performance liquid chromatography. Food Sci Biotech. 2010;19:1005–9. [Google Scholar]
- 11.Chiang GH. HPLC Analysis of Capsaicins and Simultaneous Determination of Capsaicins and Piperine by HPLC-ECD and UV. J Food Sci. 2006;51:499–503. [Google Scholar]
- 12.Garcés-Claver A, Arnedo-Andrés MS, Abadía J, Gil-Ortega R, Alvarez-Fernandez A. Determination of capsaicin and dihydrocapsaicin in capsicum fruits by liquid chromatographyelectrospray/ time-of-flight mass spectrometry. J Agric Food Chem. 2006;54:9303–11. doi: 10.1021/jf0620261. [DOI] [PubMed] [Google Scholar]
- 13.Moise MI, Marutoiu C, Badea DN, Gavrila CA, Patroescu C. Application of TLC and GC-MS to the detection of capsaicin from hot peppers (Capsicum annuum) J Planar Chromatograph. 2004;17:147–8. [Google Scholar]
- 14.Shrivastava A, Gupta VB. Methods for the determination of limit of detection and limit of quantitation of the analytical methods. Chron Young Sci. 2011;2:21–5. [Google Scholar]


