Abstract
Introduction:
The present work aimed to develop and validate spectrophotometric methods for simultaneous estimation of rabeprazole sodium and aceclofenac in a pure and capsule dosage form.
Materials and Methods:
Method 1 is based on solving a simultaneous equation. Absorbances of rabeprazole sodium and aceclofenac were measured at their respective absorbance maximas (λmax) of 283 and 276 nm. Method 2 is the Q-analysis or absorption ratio method. Absorbances were measured at 256 nm (isosbestic point) and 276 nm (λmax of aceclofenac). Methods are validated according to ICH guidelines.
Results:
A linearity range for rabeprazole sodium and aceclofenac is 10–60 μg/ml at respective selected wavelengths. The coefficient of correlation for rabeprazole at 283 nm and for aceclofenac at 276 nm is 0.9981 and 0.9997, respectively. A percentage estimation of rabeprazole sodium and aceclofenac from the capsule dosage form by method 1 is 100.22 and 99.96 and by method 2 is 99.99 and 100.05, respectively, with a standard deviation less than 2.
Conclusion:
The proposed methods are simple, rapid, and validated and can be used successfully for routine simultaneous estimation of rabeprazole sodium and aceclofenac in a pure and capsule dosage form.
Keywords: Aceclofenac, absorbance ratio method, rabeprazole sodium, simultaneous equation method, spectrometric estimation
INTRODUCTION
Rabeprazole sodium, chemically known as 2-[[[4-(3-methoxypropoxy)-3-methyl-2-pyridil]-methyl]sulfinyl]-1H-benzimidazole, is an anti-ulcerative drug. It belongs to the class of antisecretory compounds that neither exhibit anticholinergic nor histamine H-2 receptor antagonistic properties, but suppress gastric acid secretion by inhibiting gastric H+ K+ ATPase at the secretory surface of the gastric parietal cell.
Aceclofenac, chemically known as [({2-[(2,6-dichlorophenyl) amino]phenyl}acetyl) oxy]acetic acid, is a non-steroidal anti-inflammatory drug. It inhibits prostaglandin (PG) synthesis by inhibiting cyclooxygenase enzyme.
Aceclofenac is official in IP, BP, and USP whereas rabeprazole sodium is not. Literature survey reveals that UV spectrophotometric methods are reported for determination of aceclofenac[1,2] and rabeprazole sodium[3,4] individually in different pharmaceutical dosage forms. There are also various UV spectrophotometric methods available for estimation of aceclofenac or rabeprazole in combination with other drugs,[5–8] but the UV spectrophotometric method for simultaneous estimation of rabeprazole sodium and aceclofenac is not yet reported. In this work, we propose two simple and validated UV spectrophotometric methods for simultaneous estimation of rabeprazole sodium and aceclofenac in pure and capsule dosage forms.
MATERIALS AND METHODS
Instruments
A double beam UV-visible spectrophotometer, model-Jasco-V 630, with a spectral band width of 1.5 nm and automatic wavelength corrections with a pair of 10 mm quartz cell was used for experimental work.
Reagents and chemicals
All reagents and chemicals used were of AR grade. The reference standard rabeprazole sodium and aceclofenac were obtained from Shreya Life Sciences Ltd., Aurangabad, as a gift sample. The commercially available capsule with brand name Altraday (Ranbaxy) containing rabeprazole-20 mg and aceclofenac-200 mg was purchased from a local market.
Procedures
Preparation of standard stock solution and calibration curve
The standard stock solutions of rabeprazole sodium [Figure 1] and aceclofenac [Figure 2] were prepared by dissolving 0.01 g of each drug in methanol, and the final volume was adjusted with the same solvent in 100 ml of a volumetric flask to get a solution containing 100 μg/ml of each drug. Working standard solutions of 10 μg/ml were scanned in the entire UV range of 400–200 nm to determine the λmax. The λmax of rabeprazole sodium and aceclofenac is 283 nm and 276 nm, respectively, and from overlain spectra [Figure 3] it is evident that the isosbestic point is at 256 nm. Six working standard solutions with a concentration of 10, 20, 30, 40, 50, and 60 μg/ml were prepared in methanol from stock solution. The absorbances of resulting solutions were measured at their respective λmax and the isosbestic point and plotted a calibration curve to get the linearity and regression equation [Figure 4 and 5].
Figure 1.
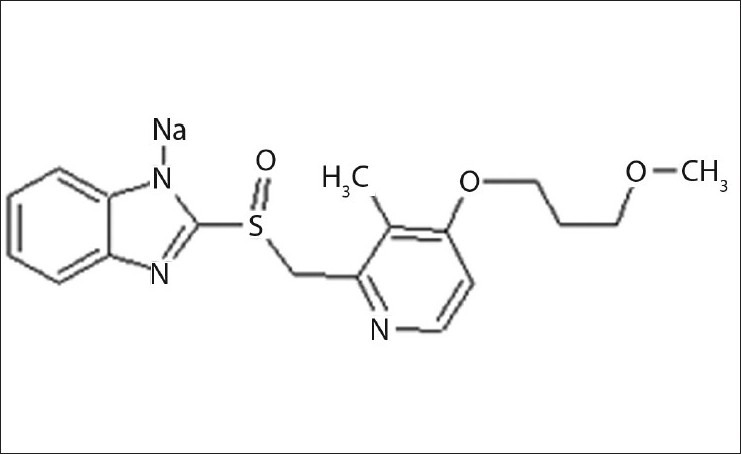
Structure of rabeprazole sodium
Figure 2.
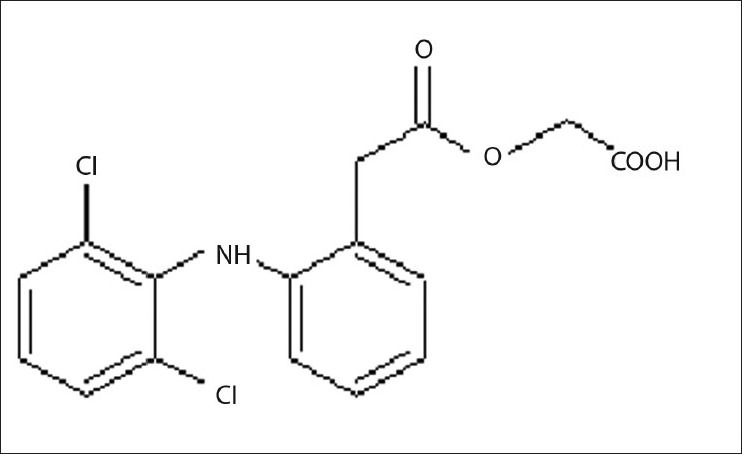
Structure of aceclofenac
Figure 3.
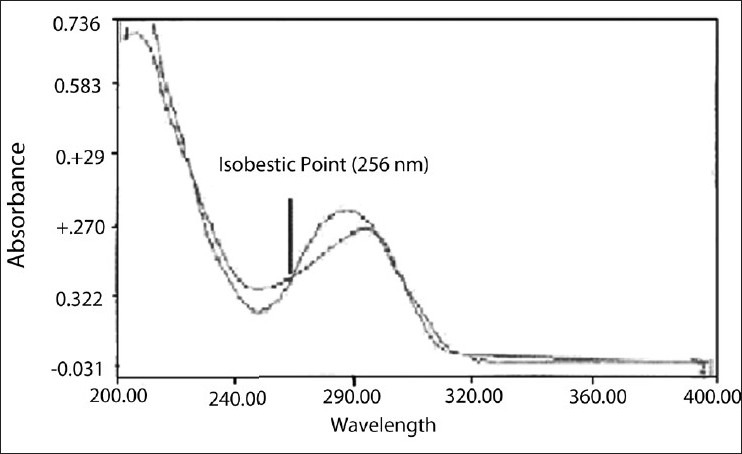
Overlain spectra of rabeprazole sodium and aceclofenac
Figure 4.
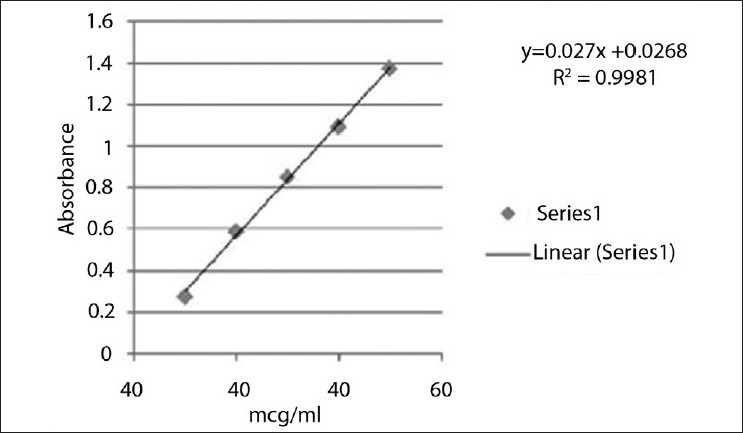
Calibration curve of rabeprazole
Figure 5.
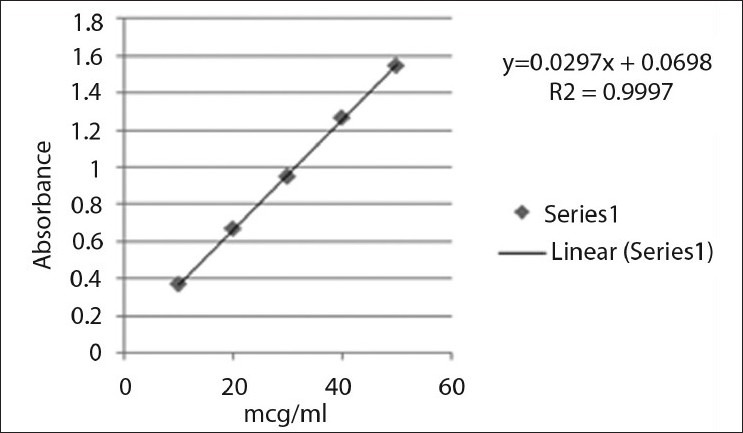
Calibration curve of aceclofenac
Method I: Simultaneous equations
The simultaneous equation method of analysis is based on the absorption of the drugs rabeprazole sodium and aceclofenac at their wavelength maxims. Two wavelengths selected for the development of the simultaneous equations are 283 nm and 276 nm. The absorptivity values determined are for rabeprazole sodium are 0.02803 (ax1), 0.02631 (ax2) and for aceclofenac 0.03022 (ay1), 0.03289 (ay2) at 283 nm and 276 nm, respectively. These values are average of six estimations. The absorbances and absorptivity at these wavelengths were substituted in equations (1) and (2) to obtain the concentration of drugs.
Cx = A2 (0.03022) – A1 (0.03289)/0.00013 (1)
Cy = A1 (0.02631) – A2 (0.02803)/0.00013 (2)
where A1 and A2 are the absorbance of sample solutions at 283 nm and 276 nm, respectively. Cx and Cy are concentrations of rabeprazole sodium and aceclofenac in μg/ml in sample solution. By substituting the values of A1 and A2,, the Cx and Cy can be calculated by solving equations (1) and (2).[9]
Method II: Absorption ratio method
The absorbance ratio method of analysis is based on the absorbance at two selected wavelengths, one is an isosbestic point and the other being the wavelength of maximum absorption of one of the two components. From overlain spectra [Figure 1], wavelength 256 nm (isosbestic point) and 276 nm (λmax of aceclofenac) are selected for the formation of Q absorbance equation (equations 3 and 4). The absorptivity values determined for rabeprazole sodium are 0.01711 (ax1), 0.02632 (ax2) and for aceclofenac are 0.01876 (ay1), 0.03289 (ay2) at 283 nm and 256 nm, respectively. These values are average of six estimations. The absorbances and absorptivity at these wavelengths were substituted in equations (3) and (4) to obtain the concentration of drugs.
Cx = (Qm 1.7531)/(–0.215286) × A1 /0.01711 (3)
Cy = (Qm 1.5378)/(0.215286) × A1/0.01876 (4)
QM, QX, and QY were obtained as below:
Qm = A2/A1; Qx = ax2/ax1; Qy = ay2/ay1 = 1.7531
where Cx and Cy are concentrations of rabeprazole sodium and aceclofenac, respectively, in mcg/ml. A1 and A2 were the absorbance of the sample at 283 nm and 256 nm, respectively.[9]
Procedure for capsule formulation
Twenty capsules were accurately weighed, and contents were removed. Average weight of the content per capsule was calculated. The contents of a capsule were reduced to fine powder and mixed thoroughly. A quantity of capsule powder equivalent to 10 mg of aceclofenac was transferred to a 100 ml volumetric flask and dissolved in methanol with vigorous shaking and the volume was made to 100 ml with the same solvent. The solution was filtered through the Whatmann filter paper no. 41. The aliquot portion of filtrate was further diluted to get a final concentration of about 1 μg/ml rabeprazole sodium and 10 μg/ml aceclofenac.
The absorbance of sample solution was measured at 283 nm and 276 nm in 1 cm cell against the blank. The content of rabeprazole sodium and aceclofenac in a capsule was calculated by the simultaneous equation method as well as absorbance ratio method.
Validation of the developed methods
The following parameters are considered under the ICH guidelines for the validation of the method.[10]
Linearity
For each drug, appropriate dilutions of standard stock solutions were assayed as per the developed methods. The Beer–Lambert's concentration range was found to be 10–60 μg/ml. The linearity data for both methods are presented in Table 1.
Table 1.
Optical characteristics

Precision
Intermediate precision (inter-day and intra-day precision)
The inter-day and intra-day precision was determined by the assay of the sample solution on the same day and on different days at different time intervals, respectively. The results of the same are presented in Table 1.
Limit of detection and limit of quantitation
The limit of detection (LOD) and limit of quantitation (LOQ) of rabeprazole sodium and aceclofenac by proposed methods were determined using calibration standards [Figures 2 and 3]. LOD and LOQ were calculated as 3.3s/S and 10s/S, respectively, where S is the slope of the calibration curve and s is the standard deviation of response. The results of the same are shown in Table 1.
Accuracy
To check the accuracy of the proposed methods, recovery studies were carried out at 80%, 100%, and 120% of the test concentration as per ICH guidelines. The recovery study was performed three times at each level. The results of the recovery studies are quoted in Table 2.
Table 2.
Results of the recovery study

RESULTS AND DISCUSSION
The linearity range for rabeprazole sodium and aceclofenac is 10–60 μg/ml and 10–60 μg/ml at respective selected wavelengths. The coefficient of correlation for rabeprazole at 283 nm and for aceclofenac at 276 nm is 0.9981 and 0.9997, respectively. Both drugs showed good regression values at their respective wavelengths, and the results of a recovery study revealed that any small change in the drug concentration in the solution could be accurately determined by the proposed methods. Percentage estimation of rabeprazole sodium and aceclofenac from the capsule dosage form by method 1 is 100.22 and 99.96 and by method 2 is 99.99 and 100.05, respectively, with standard deviation less than 2 [Table 3].
Table 3.
Results of analysis of capsule

The validity and reliability of proposed methods were assessed by recovery studies. Sample recovery for both the methods is in good agreement with their respective label claims, which suggest noninterference of formulation additives in estimation [Table 2].
Precision was determined by studying the repeatability and intermediate precision. Repeatability indicates the precision under the same operating conditions over a short interval of time and inter-assay precision. The % RSD was calculated for rabeprazole sodium and aceclofenac. The results are mentioned in Table 1. An intermediate precision study expresses within a laboratory variation in different days. In intra- and inter-day precision studies for both the methods % RSD are not more than 2.0% indicates good repeatability and intermediate precision [Table 1].
The LOD and LOQ values for rabeprazole sodium and aceclofenac are 0.194, 0.352 μg/ml, and 0.832, 2.386 μg/ml by method 1 while the same by method 2 are 0.742, 0.486 μg/ml and 1.48, 3.27 μg/ml, respectively. Low values of LOD and LOQ indicates good sensitivity of proposed methods shown in Table 1.
CONCLUSION
The proposed methods are simple, rapid and validated in terms of linearity, accuracy, precision, specificity and reproducibility, and can be used successfully for routine simultaneous estimation of rabeprazole sodium and aceclofenac in pure and capsule dosage forms.
Footnotes
Source of Support: Nil
Conflict of Interest: None declared.
REFERENCES
- 1.Rohit S, Chandrakant M, Shital KP, Dhanya K, Nilofar N. Validated spectroscopic method for estimation of aceclofenac from tablet. Res J Pharm Tech. 2008;1:430–2. [Google Scholar]
- 2.Maheshwari RK, Chaturvedi SC, Jain NK. Analysis of aceclofenac in tablets using hydrotropic solublisation technique. Indian Drugs. 2006;43:516–8. [Google Scholar]
- 3.Mallikarjuna GM, Somashekar S, Putta RK, Shanta SM. Physico-chemical characterization, UV spectrophotometric analytical method development and validation studies of rabeprazole sodium. J Chem Pharm Res. 2010;2:187–92. [Google Scholar]
- 4.Nafisur RZ, Syed NH. Quantitative analysis of rabeprazole sodium in commercial dosage forms by spectrophotometry. Chem Pharm Bull. 2008;56:995–1001. doi: 10.1248/cpb.56.995. [DOI] [PubMed] [Google Scholar]
- 5.Lohe RW, Suruse PB, Kale MK, Barethiya PR, Kasture AV, Lohe SW. Spectrophotometric methods for simultaneous estimation of rabeprazole and diclofenac from combined tablet dosage form. Asian J Res Chem. 2008;1:26–8. [Google Scholar]
- 6.Shaik HR, Arieaf M, Sandhya VP, Silpa RG, Venkateswarlu G. Simultaneous estimation of rabeprazole sodium and Itopride hydrochloride in capsule dosage form by uv spectrophotometry. Res J Pharm Tech. 2011;4:558–56. [Google Scholar]
- 7.Sujata JG, Mrunalini MD, Mahajan MP. Simultaneous estimation of tizanidine and aceclofenac in bulk drug and tablet formulation by q-analysis and area under curve. Int J Pharm Sci Rev Res. 2011;8:58–61. [Google Scholar]
- 8.Bhure MV, Hemke AT, Gupta KR. UV-Spectrophotometric methods for determination of aceclofenac and diacerein in pharmaceutical formulation. J Pharm Sci Res. 2010;2:426–32. [Google Scholar]
- 9.Beckett AK, Stanlake JB. Practical Pharmaceutical Chemistry. 4th ed. New Delhi: CBS Publishers; 1997. pp. 286–8. Part II. [Google Scholar]
- 10.ICH, Q2A Text on validation of analytical procedures: Methodology International Conference on Harmonization of technical requirements for registration of pharmaceutical for human use. Geneva, Switzerland: 1996. [Google Scholar]


