Abstract
Aim:
To develop and validate a rapid and sensitive reverse phase high performance liquid chromatography (RP-HPLC) method with UV detection for quantification of meta-cresol (m-cresol) in pharmaceutical preparation of parathyroid hormone (1–34) (PTH).
Materials and Methods:
Chromatography was performed on a Jupiter RP C-18 (4.6 mm ID × 250 mm L, porosity 300 Å, particle size 5 μm) with a guard column (reversed-phase C18 column of 4.6 mm ID × 12.5 mm L, porosity 300 Å, particle size 5 μm) using a mobile phase containing 0.1% TFA in 60% methanol with isocratic program at 1.0 mL/min flow rate. Detection was carried out at 217 nm. The method was validated as per ICH guidelines for linearity (correlation coefficient = 0.99), range, accuracy, precision, and robustness (n = 9 during accuracy parameter whereas n =15 during linearity and range parameter and n = 6 during repeatability). Robustness was confirmed by considering two factors; age effect of the mobile phase and test sample and with different columns during method development.
Results:
The method was linear over the concentration range of 75–120 μg/mL. The precision of the method in terms of relative standard deviation was evaluated from intra- and inter-day replicate injections of system suitability standards of m-cresol using different equipment and different columns. Components of within- and between-batch variances were found to be below 2% (n = 30) and 3%, respectively, which constituted an acceptable level of variation. Retention time was found to be about 5.2 min and 10.9 min for m-cresol and PTH, respectively.
Conclusion:
The developed method thus has the potential of being useful for routine quality control of m-cresol.
Keywords: Meta-cresol, parathyroid hormone, reverse phase HPLC, validation
INTRODUCTION
Meta-cresol (m-cresol) is used as bactericide in the biotechnological processing of pharmaceuticals; preservative in pharmaceutical formulations [injection solutions of insulin, somatropin, and parathyroid hormone (PTH)]; pesticide for the treatment of the stems of fruit trees and plants. Exposure of humans is possible through the use of m-cresol as a preservative in pharmaceutical injection solutions.
Meta-cresol, para-cresol, and m/p-cresol mixtures are absorbed across the respiratory and gastrointestinal tracts and through the skin, and are distributed throughout the body. The primary metabolic pathway for all cresol isomers is conjugation with glucuronic acid and inorganic sulfates. All isomers are mainly eliminated by renal excretion in the form of above-mentioned conjugates. The oral LD50 of undiluted m-cresol in rats was 242 mg/kg bw. Clinical sign includes hypoactivity, salivation, tremors, and convulsions. Neither mortality nor clinical signs of toxicity were seen following exposure to saturated vapor concentration of either m-cresol or p-cresol. Inhalation of aerosols may, however, cause death, and mean lethal concentrations in rats were reported to be 29 mg/m3 for p-cresol and 58 mg/m3 for m-cresol.[1] Reaction to m-cresol in commercial preparations of insulin to humans was reported by Dennis et al[2].
The analysis of cresol-like chemicals in use for a long period of time has evolved from a number of nonspecific colorimetric methods to more selective separation techniques using gas chromatography (GC) or high performance liquid chromatography (HPLC).[3–5]
The objective of our work was hence to develop a rapid and simple RP-HPLC method with UV detection, useful for routine quality control of m-cresol in PTH formulations. Human PTH, a peptide of 84 amino acid residues[6] secreted from parathyroid gland, is the principle homeostatic regulator of the level of blood calcium through its actions on kidney and bone.[7] Teriparatide (recombinant DNA origin) injection [recombinant human PTH (1–34)] is a bone-forming agent used for the treatment of osteoporosis. The structure of Meta-cresol and PTH are given in Figure 1 (a) and (b), respectively.
Figure 1.
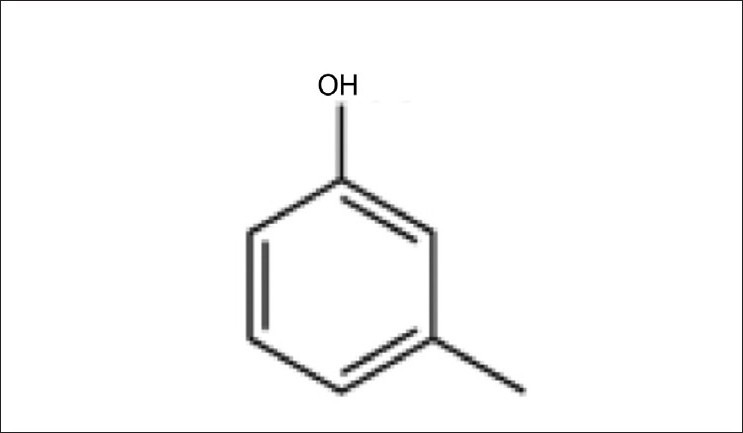
Structure of m—cresol
The method developed was validated for parameters such as linearity, accuracy, and precision. So far, to the best of our knowledge, no RP-HPLC method has been reported for determination of m-cresol in PTH formulations.
MATERIALS AND METHODS
Material, reagent, and chemicals
HPLC-grade acetonitrile and methanol were purchased from Merck; tri-fluoro-acetic acid was purchased from Sigma Aldrich. Ultra pure water was obtained using Milli-Q® UF-Plus (Millipore) system; m-cresol was obtained from J.T. Baxter/Hedinger and was used for preparation of different dilutions; PTH API (Active Pharmaceutical Ingredient) having concentration of 400 μg/mL was used for different dilutions of a PTH working standard. PTH formulation containing 250 μg/mL PTH as active pharmaceutical ingredient was used as a test sample. All chemicals, i.e. mannitol, sodium acetate, and glacial acetic, were of the highest purity available.
Preparation of standard, mobile phase, and dilution buffer
Formulation buffer
Buffer containing 3 mg/mL m—cresol, 45.4 mg/mL mannitol, 0.1 mg/mL sodium acetate and 0.41 mg/mL glacial acetic acid in Milli Q water was prepared. It is similar as excipients used for PTH formulation.
PTH working standard
PTH (400 μg/mL) was used for preparation of different diluted samples.
m-cresol standard
An aliquot of 3 mg/mL was used for preparation of different dilutions.
Mobile phase consisted of 0.1% v/v TFA in 60% methanol
All dilutions were made using calibrated digital micro-pipettes.
Chromatographic conditions
LC system equipped with an injection valve (quaternary), 217 UV detector, and Chemstation software was used. A reversed-phase Jupiter C18 column (4.6 mm ID × 250 mm L, porosity 300 Å, particle size 5 μm) with a guard column (reversed-phase C18 column of 4.6 mm ID × 12.5 mm L, porosity 300 Å, particle size 5 μm) was used for separation. To get the optimum results, the mobile phase with a flow rate of 1.0 mL/min was used and the column temperature was maintained at 30°C. The isocratic programme for the mobile phase was optimized for 12 min.
Validation of chromatographic methods
During validation, an analytical method is confirmed for reliability, accuracy, and precision of the intended purpose of that method.[8] The International Conference on Harmonisation (ICH) of Technical Requirements for Registration of Pharmaceuticals for Human Use[9] recognizes accuracy, precision, repeatability, intermediate precision, specificity, limit of quantitation and detection, linearity, and the range of a method as important validation parameters. The guidance for the methodology and statistical tests and associated limits for the validation procedure is provided in the ICH Q2B.[10]
The optimized chromatographic methods were validated according to the procedures described in ICH guidelines Q2 (R1).[11] The USP[12] states that the validation of an analytical method is a process that establishes the performance characteristics of a developed analytical method and ensures that it meets its intended purpose and analytical application. Method validation includes an assessment of the adequacy of the analytical procedure by means of statistical testing, including linear regression analysis, and relative standard deviation (RSD) determination in order to demonstrate the validity of the method.[13]
RESULTS AND DISCUSSION
Method development
To obtain the best chromatographic conditions, the mobile phase composition, column temperature, and flow rate were adequately selected. The flow rate was varied from 0.8 mL/min to 1.2 mL/min. The column temperature was varied between 22°C and 30°C, and the analysis at 30°C was preferred to improve the peak symmetry and resolution. The % of the mobile phase was varied from 58% to 62%. Isocratic chromatographic conditions were optimized for determination of m-cresol in a PTH pharmaceutical product. The chromatographic separation was achieved by applying chromatographic conditions described in “Chromatographic condition” section.
The applied chromatographic conditions permitted a good separation of m-cresol and PTH at different concentrations of m-cresol. No interference of other excipients was observed as shown in Figure 2 a and b.
Figure 2.
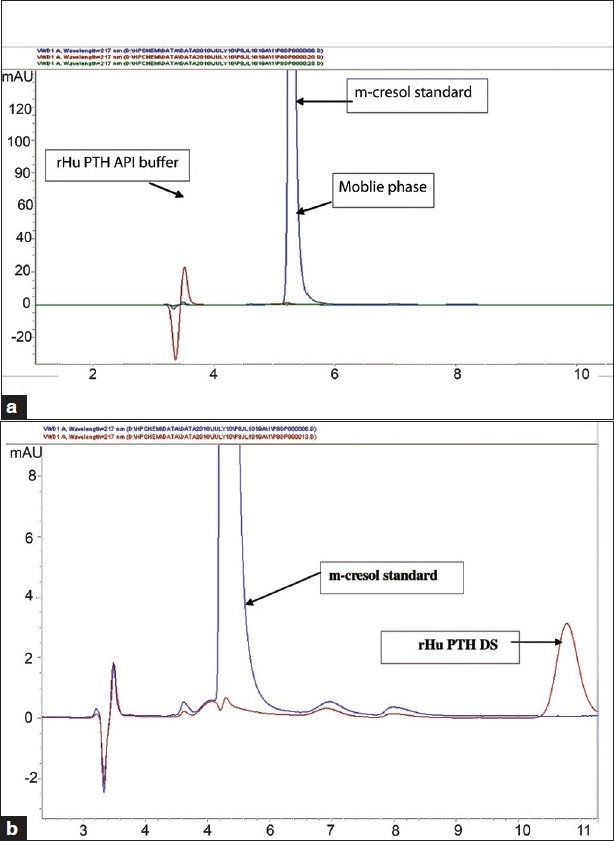
(a) Sample chromatogram of the principal peak of PTH API buffer, m-cresol standard and mobile phase. (b) sample chromatogram (overlap) of the principal peak of PTH API and m-cresol standard
The capacity factor (k′) of the first peak (m-cresol) and second peak (PTH) was 3.24 and 5.24, respectively; while the resolution factor was 6.88. The asymmetry of the peak for m-cresol and PTH were found to be 1.29 and 5.29, respectively; while the tailing factor parameter for m-cresol and PTH was found to be 1.29 and 1.14, respectively. For replicate injections of m-cresol standard; the % RSD of the main peak area was found to be below 0.7%, and there was no significant variation in the retention time (<0.1 min).
The PTH and m-cresol peaks were thus found to be well resolved, and the tailing factor was within the limits. Available PTH formulation in the market contains 100 μg/mL of m-cresol and the range was selected as 75–120 μg/mL. Detection limit (LOD) and quantification limit (LOQ) are not required for the study.
Different brands of reverse phase C18 columns were used (Jupiter column and Grace Vydac column) and compared in terms of percentage variation of principal peak area of m-cresol standard. Experiments were conducted using a system suitability standard. Percentage variation between principal peak of m-cresol was not more than 5% in all samples when compare to the area of principal peak of m-cresol from specificity samples. Retention time of the principal peak of m-cresol was found to be around 5.3 min and 3.9 min whereas the principal peak of PTH was found to be around 10.9 and 4.7 min on Jupiter and Grace Vydac columns, respectively. Relative retention rime with Grace Vydac and Jupiter columns of PTH with respect to m-cresol was found to be 1.2 and 2.1, respectively. The principal peak in both samples was separated by base-to-base while overlapping their chromatograms. On the basis of relative retention time, a Jupiter column was selected for method validation.
Method validation
Specificity
Specificity of the method for m-cresol in the presence of PTH, and excipients such as mannitol, sodium acetate, and glacial acetic acid was studied in terms of resolution of peaks observed and peak area of m-cresol. To verify this, PTH, formulation buffer, mobile phase, and m-cresol standard were injected onto HPLC separately. Three different concentrations of m-cresol (75, 100, and 120 μg/mL) were prepared in the mobile phase as well as in the formulation buffer and were injected in triplicate onto HPLC. From Figures 2(a and b) it is evident that there is no interference and the method developed is specific for m-cresol.
Linearity and range
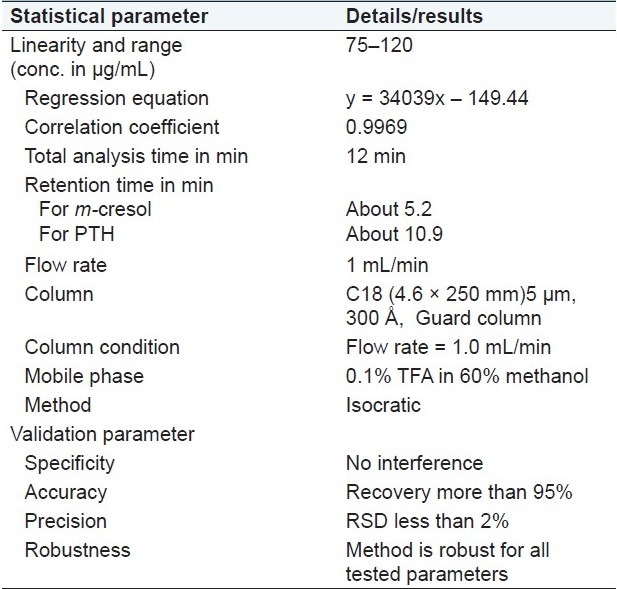
The ICH guidelines for an assay method recommend that 80–120% of stated value can be considered as a range of a method. We decided to study linearity in the concentration range from 75 to 120 μg/mL as the concentration of m-cresol in the drug product is 100 μg/mL. m-Cresol standard (3 mg/mL) was used for preparation of different concentrations ranging from 75 to 120 μg/mL, by considering 100 μg/mL as 100%. Five different concentrations were considered with three replicates of each concentration (n = 15). A linearity curve was plotted for peak area responses versus concentration of m-cresol as shown in Figure 3, and the results are shown in Table 1. The correlation coefficient, slopes, Y-intercepts, and the regression equation of the calibration curve were determined and shown in Table 2. The % RSD was found to be <2.0% while the % recovery was found to be in the range of 97–103%.
Figure 3.
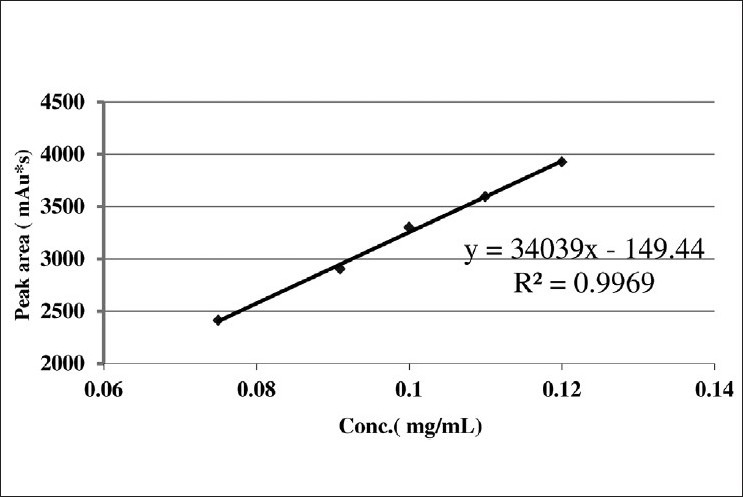
Linearity
Table 1.
Linearity and range results

Table 2.
Results of different test parameters
Accuracy
Accuracy was studied using two different sets of three different solutions, containing 90, 100, and 120 μg/mL of m-cresol. Each solution was spiked in the mobile phase and injected onto HPLC (n = 9). The % recovery was found to be between 98% and 102% and the % RSD was found to be <1.0% as shown in Table 3.
Table 3.
Accuracy results

Precision
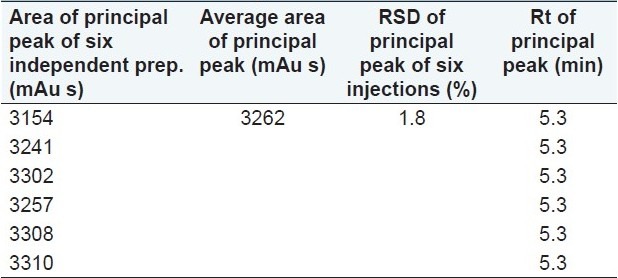
Precision was evaluated based on intra-day (repeatability) and inter-day (intermediate precision) variation and on different columns. The repeatability was assessed with six independent samples of 100 μg/mL of m-cresol. Single injection from each preparation was injected and the results are shown in Table 4. The % RSD of the main peak area was found to be <2.0 %.
Table 4.
Repeatability results
Using the experimental design and matrix as shown in Table 5, intermediate precision was evaluated on different days with different equipment and with different columns. Three replicate injections of system suitability standards (100 μg/mL of m-cresol) prepared independently were considered for the study. Intra-day precision was determined for 100 μg/mL of m-cresol by performing five different conditions as mentioned in Table 5 (n = 15) and RSD were calculated.
Table 5.
Experimental design for intermediate precision

The % RSD for the main peak area of m-cresol standard within each set and between different sets was found to be <2.0%. The % recovery of m-cresol standard was found to be between 95.0% and 105.0% within each set, and the maximum variation between sets was found to be 3.0%. The results are shown in Tables 1, 3, and 4.
Robustness
Robustness is a measure of its capacity to remain unaffected by small, but deliberate variations in method parameters and provides an indication of its robustness during normal usage. Robustness was tested using two variables: age effect of the mobile phase and test samples.
Freshly prepared samples (100 μg/mL of m-cresol) and those stored for 7 days were analyzed using both the freshly prepared mobile phase and mobile phase stored for 7 days. No variation in retention time was observed with percent variation from the initial day to 7 days. However, percentage variation of the principal peak area of m-cresol was found to be higher than 5% when compared to the principal peak area of m-cresol in specificity samples. Due to variation in the peak area, it was decided to use freshly prepared sample as well as mobile phase before analysis.
CONCLUSION
The RP-HPLC method was demonstrated to be validated for quantifying m-cresol in the presence of other excipients. Validation studies showed that the developed HPLC method was selective, linear, precise, and accurate. The chromatographic method described here was found to be reliable for quantifying m-cresol in PTH formulation. Since the method is simple and rapid, it may be successfully applied to quality control analysis of m-cresol in PTH formulations.
Footnotes
Source of Support: NMPB, Government of India (Project No. GO/MH-04/2009)
Conflict of Interest: None declared.
REFERENCES
- 1.m/p Cresol category, UNEP Publication. [Last accessed on 2011 Aug 10]. Available from: http://www.inchem.org/documents/sids/sids/m-p-cresols.pdf .
- 2.Dennis K, Baraniuk J. Delayed-type hypersensitivity reaction to the m-cresol component of insulin. Ann Allergy Asthma Immunol. 2007;99:194–5. doi: 10.1016/S1081-1206(10)60645-X. [DOI] [PubMed] [Google Scholar]
- 3.McNeil D. Kirk-Othmer Encyclopedia of Chemical Technology”. 2nd ed. Vol. 6. New York: John Wiley and Sons; 1965. pp. 434–44. [Google Scholar]
- 4.Husain S, Kunzelmann P, Schildknecht H. Separation of isomeric alkyl phenols by high-performance liquid chromatographic and gas-liquid chromatographic techniques. J Chromatogr. 1977;13:753–60. [Google Scholar]
- 5.“NIOSH Manual of Analytical Methods”. USDHEW, PHS, CDC, NIOSH, DHEW (NIOSH) Publication No. 77 - 157C. (2nd ed) 1977 Apr;3 [Google Scholar]
- 6.Hendy GN, Kronenberg HM, Potts JT, Jr, Rich A. Nucleotide sequence of cloned cDNAs encoding human preproparathyroid hormone’. Proc Natl Acad Sci USA. 1981;78:7365–9. doi: 10.1073/pnas.78.12.7365. [DOI] [PMC free article] [PubMed] [Google Scholar]
- 7.Potts JT, Jr, Kronenberg HM, Rosenblatt M. Rosenblatt, Parathyroid hormone: chemistry, biosynthesis, and mode of action. Adv Protein Chem. 1982;35:323–96. doi: 10.1016/s0065-3233(08)60471-4. [DOI] [PubMed] [Google Scholar]
- 8.US Food and Drug Administration, Center for Drug Evaluation and Research, Reviewer Guidance, Validation of Chromatographic Methods, Rockville, MD. 1994. [Last accessed on 2005 Apr 05]. http://www.fda.gov/CDER/GUIDANCE/cmc3.pdf .
- 9.Code Q2A - Text on Validation of Analytical Procedures International Conference on Harmonization (ICH) of Technical Requirements for the registration of Pharmaceuticals for Human Use, Guideline for Industry. 1995. [Last accessed on 2005 Apr 05]. Available from: http://www.fda.gov/cder/Guidance/ichq2a.pdf .
- 10.Code Q2B - Validation of Analytical Procedures: Methodology, International Conference on Harmonization (ICH) of Technical Requirements for the registration of Pharmaceuticals for Human Use, Guidance for Industry. 1996. [Last accessed on 2005 Apr 05]. Available from: http://www.fda.gov/cder/Guidance/1320fnl.pdf .
- 11.Code Q2-R1 - Validation of analytical procedures: Text and methodology, ICH harmonized tripartite guideline. 2005 [Google Scholar]
- 12.United States Pharmacopeia. 29th ed. Twin brook Parkway, Rockville, MD, USA: United States Pharmacopeial Convention, Inc; 2006. p. 1623. (2675-93, 3050-3, 3392-4). [Google Scholar]
- 13.US Food and Drug Administration, Center for Drug Evaluation and Research, Guidance for Industry: Analytical Procedures and Methods Validation. Chemistry, Manufacturing, and Controls Documentation DRAFT GUIDANCE, Rockville, MD. 2000. [Last accessed on 2005 Apr 05]. Available from: http://www.fda.gov/CDER/GUIDANCE/2396dft.pdf .


