Abstract
Background:
Repaglinide is a miglitinide class of antidiabetic drug used for the treatment of type 2 diabetes mellitus. A fast and reliable method for the determination of repaglinide was highly desirable to support formulation screening and quality control.
Objective:
UV spectrophotometric and reversed-phase high performance liquid chromatography (RP-HPLC) methods were developed for determination of repaglinide in the tablet dosage form.
Materials and Methods:
The UV spectrum recorded between 200 400 nm using methanol as solvent and the wavelength 241 nm was selected for the determination of repaglinide. RP-HPLC analysis was carried out using Agilent TC-C18 (2) column and mobile phase composed of methanol and water (80:20 v/v, pH adjusted to 3.5 with orthophosphoric acid) at a flow rate of 1.0 ml/min. Parameters such as linearity, precision, accuracy, recovery, specificity and ruggedness are studied as reported in the International Conference on Harmonization (ICH) guidelines.
Results:
The developed methods illustrated excellent linearity (r2 > 0.999) in the concentration range of 5-30 μg/ml and 5-50 μg/ml for UV spectrophotometric and HPLC methods, respectively. Precision (%R.S.D < 1.50) and mean recoveries were found in the range of 99.63-100.45% for UV spectrophotometric method and 99.71-100.25% for HPLC method which shows accuracy of the methods.
Conclusion:
The developed methods were found to be reliable, simple, fast, accurate and successfully used for the quality control of repaglinide as a bulk drug and in pharmaceutical formulations.
Keywords: Method validation, quantitative analysis, repaglinide, RP-HPLC
INTRODUCTION
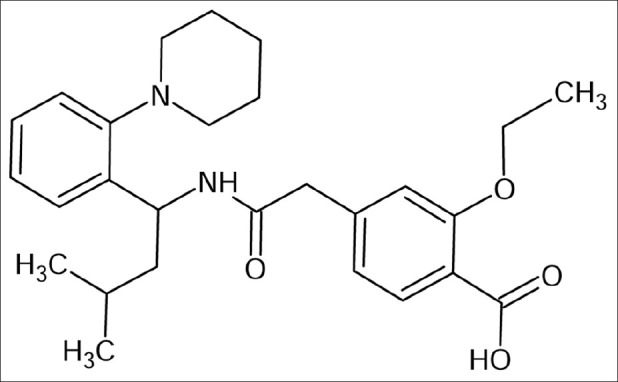
Type 2 diabetes is a long-term metabolic disorder wherein the body becomes resistant to the effects of insulin, a hormone that regulates sugar absorption. Treatment of type-2 diabetes (noninsulin-dependent) is now possible with orally administered hypoglycemic agents that help to reduce blood sugar levels.[1] Repaglinide is a carbomoxylmethyl benzoic acid derivative, also known as 2-ethoxy-4-[2-[[3-methyl-1-[2-Cl-piperidinyl)phenyl]butyl]amino]-2-oxyethyl]. The chemical structure of repaglinide is shown in Figure 1. Repaglinide is a meglitinide antidiabetic drug used for the treatment of type-2 diabetes mellitus and it lowers blood glucose by stimulating the release of insulin from the pancreas. It achieves this by closing ATP-dependent potassium channels in the membrane of the β-cells.[2,3]
Figure 1.

Repaglinide
Technology and scientific progress has led to the development of numerous synthetic drugs. The increase utilization of these antidiabetic drugs demands the development of new and alternative methods to successfully determine these drugs in raw material, pharmaceutical dosage form and in the biological fluids.
Extensive literature survey reveals that previous studies have reported the determination of repaglinide employing UV and visible spectrophotomeric,[4–6] spectrofluorimetric methods,[7] HPLC,[8,9] LCMS/MS focusing mainly in its quantitation in plasma.[10] These reported methods were mainly focused on the analysis of the drug by colorimetry and uses of buffer in mobile phase for HPLC method. The purpose of this study was to develop simple, fast, economical and validated analytical methods to quantify repaglinide in tablets using HPLC and UV spectrophotometry. Validation of the developed methods was done as per International Conference on Harmonization (ICH) guidelines.[11] The results obtained by these methods were statistically compared using analysis of variance. In addition the reliability and feasibility of these methods were evaluated, focusing on rountine quality control analysis.
MATERIALS AND METHODS
Materials
Repaglinide, reference standard was obtained as a generous gift sample from USV Lab. Pvt. Ltd., Mumbai, India. Eurepa tablets labelled to contain repaglinide 2 mg, manufactured by M/S Torrent Pharmaceutical Ltd., Baddi (H.P.), India, were purchased from local market. All the chemicals used were of AR and HPLC grade, obtained from E. Merck, India.
Instrumentation and optimization conditions
UV spectrophotometric analyses were carried out on a Shimadzu 1700 Double beam UV-Vis spectrophotometer, with 1.0-cm quartz cells. The wavelength of 241 nm was selected for the quantitation of repaglinide and the measurements were obtained against methanol as a blank.
The HPLC analysis were carried out on Agilent 1120 Compact LC system composed of binary pump, manual injector, UV detector and Ezchrome EliteCompact software. The column used was Agilent TC-C18 (250 mm × 4.6 mm i.d., 5 μm particle size) and the mobile phase consisted of methanol and water (80:20 v/v, pH adjusted to 3.5 with orthophosphoric acid) at a flow rate of 1.0 ml/min. Detection was performed on at 241 nm.
Preparation of standard solution
The standard stock solution of repaglinide 1000 μg/ ml was prepared in methanol. For spectrophotometric method, further dilutions of aliquots of standard stock solution were carried out with methanol to reach the concentration range 5-30 μg/ml for repaglinide. The absorbance of series of solutions was measured at 241 nm and found to be proportional to the corresponding concentrations of repaglinide.
For HPLC method, the standard solutions were prepared by dilution of aliquots of the standard stock solution with mobile phase to reach the linearity range of 5-50 μg/ml of repaglinide. Twenty microlitre of the each standard solution was injected to HPLC system. The peak areas were plotted against the corresponding concentrations to obtain the calibration graph.
Preparation of sample solution
To determine the content of repaglinide in conventional tablets (label claim: 2 mg repaglinide per tablet), 20 tablets were weighed, their mean weight determined and finely powdered. A portion of tablet powder equivalent to 10 mg of repaglinide was accurately weighed and dissolved in 30 ml methanol in 100 ml volumetric flask. The contents of the flask were sonicated for 15 min to dissolve repaglinide, volume was made up to the mark with same diluent and the resulting mixture was filtered. An aliquot portion of obtained filtrate was diluted to 10 ml with methanol for UV spectrophotometric and with mobile phase for chromatographic analysis to get final concentration within the linearity range.
Method validation
The optimized spectrophotometric and chromatographic methods were completely validated according to the procedure described in ICH guidelines Q2 (R1) for validation of analytical methods.
Linearity
Linearity was studied by analyzing six standard solutions (n = 3) covering the range of 5-30 μg/ml and 5-50 μg/ml for UV spectrophotometric and HPLC, respectively. Standard solutions containing 100 μg /ml of repaglinide in solvent were prepared in triplicate. Aliquots of these solutions were diluted to six different concentrations, corresponding to of 5-30 μg/ml and 5-50 μg/ml of repaglinide for UV spectrophotometric and HPLC, respectively. Calibration curves with concentration verses absorbance or peak was plotted for each method and the obtained data were subjected to regression analysis using the least squares method.
Precision
Repeatability was obtained by analyzing sample solution six times, at 100% of test concentration within the same day using both methods. Similary, the intra and inter day precision was evaluated by analyzing tablet sample on the same day and on different days at different time interval, respectively. Repaglinide contents and the relative standard deviation (R.S.D.) value were calculated.
Accuracy
To check the accuracy of the developed methods and to study interference of formulation additives, analytical recovery experiments was carried out by the standard addition method. Repaglinide reference standard solution was added to tablet samples at three different concentrations level. At each level, samples were prepared in triplicate and the mean percentage recovery and R.S.D. value were determined for both methods.
Detection and quantitation limits
Series of diluted standard solutions were prepared and analyzed by both methods. The limit of detection (LOD) and limit of quantitaton (LOQ) were separately determined based on standard deviation of the y-intercept and the slope of the calibration curve by using the equations (1) and (2), respectively.

Where, δ: standard of y-intercept and S: slope of calibration curve.
Specificity
A sample solution of tablet was prepared in the test concentration range and injected into the chromatograph, to evaluate possible interfering peaks. For spectrophotometric analysis the UV spectrum of this solution was recorded in the range of 200-400 nm to evaluate the presence of possible interfering bands at 241 nm.
Ruggedness
Ruggedness of the proposed method was determined by analysis of sample solution prepared by proposed methods between different time intervals, days and analysts. The % R.S.D. was determined.
RESULTS AND DISCUSSION
Method development and optimization
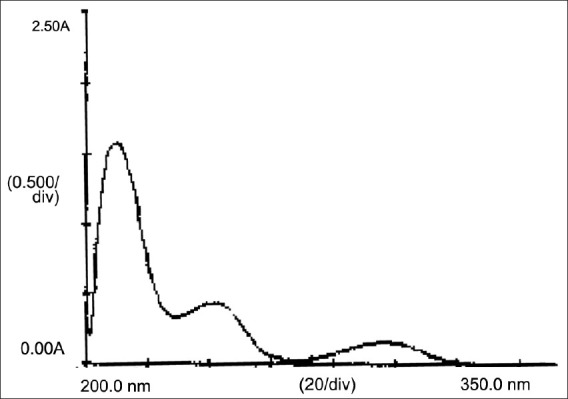
Repaglinide was completely soluble in methanol and hence methanol was selected as the solvent for repaglinide to obtained UV spectrum in the range of 200-400 nm [Figure 2]. After the evaluation of the spectrum, the wavelength of 241 nm was selected for measurement, due to the adequate molar absorptivity of repaglinide in this region.
Figure 2.

UV spectra of repaglinide in methanol
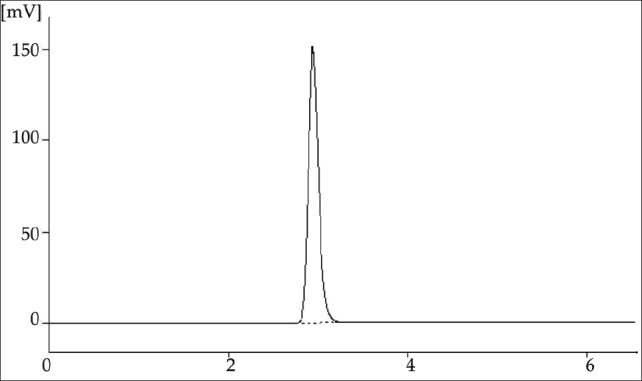
The chromatographic method was optimized by changing the composition of mobile phase, flow rate and column. Finally development was carried out using C18 column and a mobile phase composed of methanol and water (80:20 v/v, pH adjusted to 3.5 with orthophosphoric acid) at a flow rate of 1.0 ml/ min. The eluent was monitor at 241 nm. An adequate peak symmetry (tailing factor: 1.22) and short run time was achieved as demonstrated in the chromatogram [Figure 3]. The system suitability parameters are shown in Table 1.
Figure 3.

Chromatogram of standard solution of repaglinide
Table 1.
Result from system suitability study

Linearity
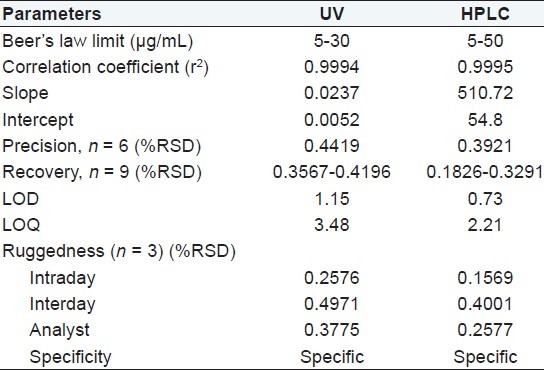
A linear relationship was found between the concentration and the response of both UV and HPLC method. The regression analysis data are presented in Table 2. The regression coefficients (r2) obtained was higher than 0.999 which attest the linearity of the methods.
Table 2.
Validation parameters of evaluated methods

Precision
The precision data obtained for the evaluated methods are demonstrated in Table 2. Both methods presented R.S.D. values lower than 2.0% assuring a good precision but HPLC method highly precise as compared to UV method.
Accuracy
Accuracy was investigated by means of recovery studies using the developed methods. Both spectrophotometric and chromatographic methods exhibited mean recoveries (n = 9) close to 100% [Tables 3 and 4], demonstrating an adequate accuracy.
Table 3.
Recovery study results of repaglinide for UV method

Table 4.
Recovery study results of repaglinide for HPLC method

Ruggedness
The % R.S.D. values reported were found to be less than 2% showed ruggedness of the s pectrophotometric and HPLC methods. The results of ruggedness were presented in Table 3.
Specificity
The chromatogram obtained with the tablet sample solution with excipients shows no interfering peaks in the retention time of repaglinide. For the UV method, no interfering absorption band was found at 241 nm, in the spectrum of the tablet sample solution.
The values of the LOD and LOQ were 1.15 μg/mL and 3.48 μg/mL, 0.73 μg/mL and 2.21 μg/mL for spectrophotometric and HPLC methods, respectively.
Analysis of tablets
The quantitative results using UV and HPLC methods are shown in Table 5. There was no statistically significant difference between the mean values, although UV method showed slightly higher % R.S.D. value compared with HPLC method. Therefore, both analytical methods, were found to be accurate, precise and could be used for routine quality control analysis of repaglinide.
Table 5.
Statistical comparison of results obtained by the proposed methods for the analysis of repaglinide in tablets

CONCLUSIONS
The advantage of UV method over HPLC method is that the proposed UV method does not require the elaborate treatment and procedures usually associated with chromatographic method. It is less time consuming and economical. A statistical comparison of the quantitative determination of repaglinide shows that HPLC method as more accurate and precise than UV method. The results indicate HPLC and UV spectrotometry methods are adequate methods to quantify repaglinide in pure form and its dosage form. There was no interference by excipients in the tablets and the mobile phase is easy to prepare. Since these methods are simple, specific, rapid, precise and accurate, they may be successfully and conveniently adopted for routine quality control analysis of repaglinide in bulk and pharmaceutical dosage form.
ACKNOWLEDGMENTS
Authors are thankful to the Manager, USV Lab. Pvt. Ltd., Mumbai, India for providing the gift samples and also thankful to Dr. K. P. Bhusari, Principal, Sharad Pawar College of Pharmacy, Nagpur for providing experimental facilities for this work.
Footnotes
Source of Support: Nil
Conflict of Interest: None declared.
REFERENCES
- 1.Rang HP, Dale MM, Ritter JM, Moore PK. Pharmacology. 5th ed. Edinburgh: Churchill Livingstone; 2003. p. 310. [Google Scholar]
- 2.Budavari S, editor. The Merck Index, an encyclopedia of chemicals, drugs and biologicals. 13th ed. Whitehouse Station, NJ: Merck and Co Inc; 2001. p. 790. [Google Scholar]
- 3.Reynolds JE. 33rd ed. London: Pharmaceutical Press; 2002. Martindale, the complete drug reference; p. 334. [Google Scholar]
- 4.Goyal A, Singhvi I. Visible spectrophotometric methods for estimation of repaglinide in tablet formulation. Indian J Pharm Sci. 2006;5:79–80. [Google Scholar]
- 5.Sharma S, Sharma MC. Simultaneous determination of repaglinide in pharmaceutical dosage form using indigo carmine. Amer Eurasian J Sci Res. 2011;6:47–51. [Google Scholar]
- 6.Patel JR, Suhagia BN, Patel BH. Simultaneous specrophotometric estimation of metformin and repaglinide in a synthetic mixture. Indian J Pharm Sci. 2007;69:844–52. [Google Scholar]
- 7.Kaushal N, Jain S, Tiwary AK. Development of spectrofluorimetric and HPLC methods for in vitro analysis of repaglinide. Indian J Pharm Sci. 2010;72:240–2. doi: 10.4103/0250-474X.65029. [DOI] [PMC free article] [PubMed] [Google Scholar]
- 8.Gandhimathi M, Renu TK. Determination of repaglinide in pharmaceutical formulation by HPLC with UV detection. Anal Sci. 2003;19:1675–82. doi: 10.2116/analsci.19.1675. [DOI] [PubMed] [Google Scholar]
- 9.Prameela RA, Bala SC, Archana N, Siva TP, Aruna B. Determination of repaglinide in pharmaceutical formulation by HPLC. J Applied Sci Res. 2009;5:1500–4. [Google Scholar]
- 10.Ruzilawati AB, Wahab MS, Imran A, Ismail Z, Gana SH. Method development and validation of repaglinide in human plasma by HPLC and its application in pharmacokinetic studies. J Pharm Biomed Anal. 2007;43:1831–5. doi: 10.1016/j.jpba.2006.12.010. [DOI] [PubMed] [Google Scholar]
- 11.International Conference on Harmonization. Geneva: Switzerland: 1996. ICH Guidelines, Q2B, Validation of Analytical Procedures: Methodology. [Google Scholar]


