

Abstract
How do visual luminance, shape, motion, and depth bind together in the brain to represent the coherent percept of a 3D object within hundreds of milliseconds (ms)? We provide evidence from simultaneous magneto-encephalographic (MEG) and electro-encephalographic (EEG) data that perception of 3D objects defined by luminance or motion elicits sequential activity in human visual cortices within 500 ms. Following activation of the primary visual cortex around 100 ms, 3D objects elicited sequential activity with only little overlap (dynamic 3D shapes: hMT- LO-vTemp, stationary 3D shapes: LO-vTemp). A delay of 80 ms, both in MEG / EEG responses and in reaction times (RT), was found when additional motion information was processed. We also found significant positive correlations between RT, and MEG and EEG responses in the right temporal location. After about 400 ms, long lasting activity was observed in the parietal cortex and concurrently in previously activated regions. Novel time-frequency analyses indicate that the activity in the Lateral Occipital (LO) complex is associated with an increase of induced power in the gamma band, a hallmark of binding. The close correspondence of an induced gamma response with concurrent sources located in LO in both experimental conditions at different points in time (~200 ms for luminance and ~300 ms for dynamic cues) strongly suggests that LO is the key region for the assembly of object features. The assembly is fed forward to achieve coherent perception of a 3D object within 500 ms.
Introduction
Our visual system identifies objects by using various cues, such as contours of objects in a painting, or movement patterns like the shape of a running animal against its surrounding background. An important ability of the brain is reconstruction of the third dimension from the 2D retinal images received by the eyes. A particularly salient cue for the extraction of 3D information is visual motion (Wallach, et al., 1953; Ullman, 1979; Todd & Bressan, 1990). Numerous studies have shown that brain damage in one or more cortical areas of the visual processing network results in malfunction in perception of objects. For instance, a patient with abnormal development of the ventral cortex following long term visual deprivation had trouble recognizing stationary 3D objects (e.g., Necker’s cube), but had no problem with identifying objects combined with visual motion cues, i.e. shape-from-motion stimuli (Fine et al., 2003). For this static-object-blind case, binding dynamic information aids recognition of visual objects. In contrast, another patient, who had no difficulty in recognizing stationary objects, could not recognize complex objects or forms generated by motion alone. With lesions in the ventral extrastriate cortex, this patient could see simple 2D motion (which does not require combining of depth and motion information), but was blind to coherent dynamic 3D objects (Cowey and Vaina, 2000). Recent brain imaging work in monkeys (Sereno, 2002; Vanduffel, 2002) and humans (Orban, et al,. 2004) has shown that a network of visual areas in the human brain participates in the perception of a 3D object defined by motion (Orban et al., 1999; Paradiso 2000; Murray et al., 2003; Peuskens et al., 2004).
To understand how specific brain areas bind depth, motion or luminance contours together to represent a coherent percept of a 3D object within 500 ms, it is difficult to use hemodynamic techniques, like PET or fMRI, because of their low temporal resolution. Electrophysiological methods, like event-related potentials (ERP) and magnetic fields (ERMF), offer high temporal resolution and are ideally suited to investigate these processes. The present experiment investigated temporal dynamics of cortical activation within the network of occipital, parietal and temporal areas during the perception of 3D shapes defined by luminance contours or by motion cues (Fig. 1). The combination of source analyses of evoked activity and time-frequency analyses of oscillatory activity afford an opportunity to gain new understanding of the neural processes underlying perception of 3D objects from motion. Our first goal was to identify the activation sequence of the different regions based on the MEG temporal evolution and spatial source analysis. Next, we examined where binding of different visual attributes to a coherent percept of a shape occurs in the network, in conjunction with complementary time-frequency analyses in the gamma band (~40 Hz).
Fig. 1.
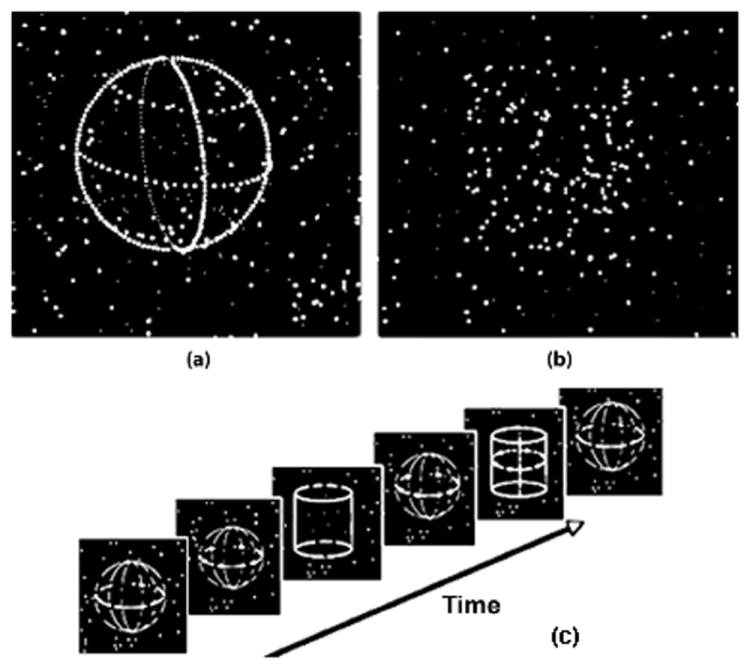
Visual displays and task. Two types of 3D visual objects were counter-balanced and presented in pseudorandom order. (a) Static 3D shapes with luminance contours – The object shapes were defined by stationary luminance dots against a background of randomly moving dots. (b) Dynamic 3D Shapes or Shape-from-motion (SFM) – transparent, rotating 3D shapes were defined by rotating dots against a randomly moving background. The 3D shapes without luminance boundary depicted vivid 3D object perception only through movement. (c) Subjects judged the shapes of the 3D objects by pressing buttons in their hands (e.g. left = cylinder, and right = sphere).
Methods
Visual Displays and Task
The 3D shapes were either outlined by luminance contour, or by coherent 3D rotation of dots on a background of randomly moving dots (Fig.1). For each trial, visual patterns depicted by 200 luminance dots were presented. Each apparent rotation sequence contained 10 picture frames. The display of the 10 frames in a rotation sequence was locked to the vertical sync signal of the computer monitor, and all frame durations were multiples of the monitor’s refresh rate (60 Hz, corresponding to 16.7 ms intervals). Each frame was presented for 50 msec. The nearer half of the dots in each display had higher luminance than the other dots, which created a depth cue by near-far luminance difference (Jiang et al., 1998; Dosher et al., 1986). Randomly moving dots without coherent patterns were always present in the background displays for each trial. Each rotation sequence lasted for 500 ms on the computer screen over 10 successive frames, with 5° of rotation between each frame. The dots depicting each shape-from-motion stimulus were randomly picked and displayed on the surface of the imaginary spherical or cylindrical volume. While maintaining fixation at the center of the screen, the subjects responded by pressing buttons in their left or right hands to indicate perceptual judgments of shape (sphere or cylinder, regardless whether the 3D shape is stationary or dynamic). Each 3D shape subtends a visual angle of about 4°.
Data acquisition
ERPs and ERMFs were recorded simultaneously using a BTI Magnes 2500 WH (4D Neuroimaging, San Diego, USA) whole-head system with 148 magnetometer channels and 32 EEG channels (NeuroScan, Inc.). Eye movements were continuously monitored by recording the electroculogram (EOG). The recording bandpass was DC-50 Hz with a sampling rate of 254 Hz for both types of measurement. For the MEG an online noise reduction system removed a weighted sum of environmentally induced magnetic noise (first-order spatial gradients of the field) recorded by eight remote reference sensors (3 magnetometers and 5 gradiometers). Artifact rejection was performed offline by removing epochs with eye movements, blinks and peak-to-peak amplitudes exceeding a threshold of 3.0 × 10⁻¹² T. This concerned around 20 % of the recorded trials. Individual head shapes and the sensor-frame coordinate system were co-registered by digitizing (Polhemus 3Space Fastrak) individual landmarks (nasion, left and right preauricular points), whose locations in relation to sensor positions were derived based on signals provided by five head coils with a fixed spatial relation to the landmarks. These landmarks, in turn, served to enable co-registration to individual anatomical MR scans that were recorded to constrain realistic source modeling.
Data analysis
Following artifact rejection, separate averages for the static and dynamic shapes were computed. For each subject and condition a minimum of 200 trials were included in the individual averages. In this way two different event-related potential (ERP) and magnetic field (ERMF) averages were obtained (3D static and dynamic shapes). The magnetic field distribution as measured by the MEG is oriented perpendicularly with respect to the electric field distribution (voltage gradient) measured by the EEG. Consequently, the ERP and ERMF produced by a given dipolar source will have different (nearly orthogonal) surface topographies. The surface topographies of ERP and ERMF were fit concurrently to obtain maximal localization power (Fuchs et al., 1998; Schoenfeld et al., 2003; Schoenfeld et al., 2007). This fitting procedure requires that the conductivities of the volume conductor model are matched for the EEG and MEG recordings. A conductivity factor was therefore determined to scale the EEG data with respect to the MEG data on the basis of a tangential dipole evoked by tactile stimulation of the index finger by an air puff at 30 to 40 ms latency (Fuchs et al., 1998). Reliably across these subjects, the conductivity factor could be approximated to 0.8 and this value was used for all subjects. The single subject data was analyzed using distributed source models. These models were computed based on the minimum L2-norm method, constrained on the cortical surface using individual realistic head models (boundary element method, BEM) derived from the individual MRI, as implemented into the multi-modal neuroimaging software Curry 4.0 (4D Neuroimaging). In order to find a realistic model to be used for the source analysis of the grand average, the dimensions of each individual brain along all three axes were compared with the mean dimensions. The brain of the subject that was closest to the mean in the three dimensions was considered to be the most canonical and was used as a BEM to model the grand average fields (Schoenfeld et al. 2003; Schoenfeld et al. 2007).
Statistics and timing analyses
Behavioral measures were submitted to repeated-measures ANOVA. ERP and MEG waveforms over selected channels or groups of sensors were divided from 50 – 500 ms into nine consecutive epochs of 50 ms and each tested for deviation from the baseline with a criterion of p < 0.05 (Guthrie & Buchwald, 1991), corrected for multiple comparisons in the relevant time ranges in which source analyses were performed. Timing analyses for EEG data were performed on single electrodes while the analyses for MEG data were carried out on spatial averages of three sensors at temporal left (TL), occipital left (OL), temporal right (TR) and occipital right (OR) locations (see Fig 3).
The timing analyses were performed to substantiate the delay between the onsets of the ERP/MEG waves of the static versus dynamic conditions. To accomplish this, the prestimulus baseline of the response to the 3D dynamic shape condition was divided into 10 epochs of 8 msec duration each, and the mean amplitude of each of these epochs was measured (with reference to the mean amplitude of the entire prestimulus period). This yielded 10 values that served as a “baseline reference set” (BaselineRS). Deviations in the response from this BaselineRS were looked for in the poststimulus period by determining a consecutive series of “data reference sets” (DataRS), and comparing each of these sets of values with the BaselineRS of values using t tests. This was done as follows. In the poststimulus period, beginning at time 100 ms (time range prior to the visually inspected onset of the main effect), 10 consecutive epochs of 8 msec duration each were defined, and the mean amplitude in each 8 msec epoch was measured (again, with reference to the mean amplitude value of the entire prestimulus period) to yield one poststimulus DataRS of 10 values. The first DataRS was compared to the BaselineRS using a t test, and was considered significant if p < .05. Then, this time window was “slid” to the right by 8 msec, creating the next DataRS (comprising 10 values altogether - the last nine from the prior DataRS, plus one new value). This new DataRS was also compared to the BaselineRS using a t test. This procedure was continued until a series of seven consecutive DataRS were significantly different from the prestimulus BaselineRS. The first time point of the first epoch of these seven DataRS that were significantly different from the DataRS was considered the onset latency of the response in the 3D dynamic shape condition.
The second step was to determine the “difference” in onset latency between the static and dynamic 3 D responses for each subject. To do this, the rising phase of the response for the 3D dynamic shape condition (consisting of 80 msec of the waveform following the onset latency of the wave as determined above) was “shifted backward in time,” time point by time point, and correlated against the corresponding time points for the static shape condition until the best correlation was found. This was sensible because the late wave shapes of the static and dynamic responses looked very similar but appeared to differ in onset latency. The amount of shift that gave the highest correlation between these waveform segments from the two conditions was interpreted as being the best estimate of the delay between the late waves of the two conditions. The difference value obtained using this method was highly consistent with the observed latency onset difference in the waveforms when inspected visually. Repeated-measures ANOVAs with the factor condition (static vs. dynamic 3D shapes) were then performed on the onsets of the late waves to substantiate the delays for each location. In an earlier study this procedure was found to be better suited to detect timing difference between slow waves in the presence of noise than by measuring peak latencies (Schoenfeld et al., 2003). Finally a correlation between the individual delays in the late waves at the temporal right locations (TR) and the reaction times was obtained by calculating the Spearman correlation coefficient (rs) and the corresponding two-tailed significance levels.
Single-trial Frequency Analyses
Amplitude and phase alignment of designated frequencies were assessed separately for the static and dynamic shape conditions. A continuous wavelet transformation was applied to single trials of MEG from each sensor, using standard Morlet wavelets with stretch factor ‘stretch = 1’ (Düzel et al., 2003). Taking the frequency resolution of our ‘standard’ Morlet wavelet into account, six logarithmically distributed wavelets optimally covered our frequency range of interest from 25.6 to 45.0 Hz. Each of these six wavelets was convolved with the MEG signal from each trial. During transformation, a normalization factor ensured that a signal with a maximum amplitude of one resulted in a transform with maximum amplitude of one. The modulus of the resulting time-frequency coefficient matrix denotes absolute amplitude, whereas the inverse tangent of its imaginary-to-real part ratio denotes phase. Amplitude and phase were averaged separately across trials for each time point. Phase alignment for each time point was measured according to the ‘phase-locking factor’ (Tallon-Baudry et al., 1996) as the length of the unit phase vector across trials divided by the number of trials. A value of 1 would correspond to perfect phase alignment across trials and a value of 0 to random phase variation across trials. To detect significant changes in amplitude or phase alignment statistical comparisons were performed across subjects using t-tests between a subset of data points from the baseline where no stimulus was presented and consecutive 20 ms intervals from 0 to 500 ms after stimulus presentation.
Results
Behavioral measures
In this experiment the observer’s task was to discriminate the shape regardless whether the objects were stationary or dynamic. The temporal processing obtained from MEG/ERP data were also compared to the reaction times of shape discrimination. We found that the perceivers were equally accurate (94.1% and 94.7% hit rate) when judging the 3D shapes depicted by luminous contours (Static shapes) and the transparent dynamic 3D shapes-from-motion (SFM) amongst fields of randomly moving dots (p > 0.05). However, the mean reaction time to recognize a static 3D object was 590 ms, faster than recognition of the dynamic shapes, which took on average 670 ms. A repeated measures ANOVA showed that the mean difference of 80 ms was highly significant (p < 0.001,Fig. 4).
Electrophysiological measures of early visual processing (60-120 ms)
First we investigated the possibility whether static and dynamic stimuli were processed differently at the earliest visual processing stages (reflected in the time range 60 – 120 ms in electrophysiological recordings). Importantly, we found no significant differences in amplitude nor timing between the responses elicited by static and dynamic stimuli for ERP (p > 0.05) nor for ERMF (p > 0.05).
Late latency timing analyses (120-550 ms)
At longer latencies, both static and dynamic 3D objects elicited a slow component with maximal amplitudes over occipital and occipito-temporal channels/sensors. We observed a significant time delay between the onset of this component when elicited by dynamic 3D shapes (blue lines of Fig. 2-4) compared to static 3D shapes (red lines in Fig 2-4) (p < 0.001) (Schoenfeld, 2003) that was maximal over right temporal magnetic sensors and electrode sites. The mean delays were 74.2 ms in the EEG and 81.8 ms in the MEG, which are strikingly close to the mean reaction time delay of 80 ms (see Fig 4). Significant positive correlations were found between the individual reaction time delays at the temporal right location (TR) and both the EEG (rs=0.74, p=0.02) and the MEG (rs=0.71, p=0.03) late wave delays.
Fig. 2.
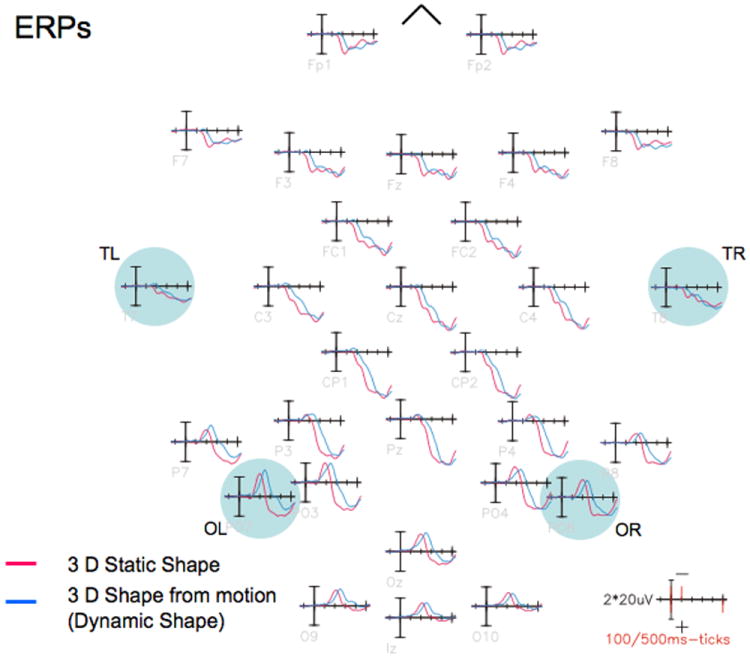
Grand-averaged event-related potential waveforms elicited by 3D static (red waveforms) and dynamic shape (blue waveforms) stimuli. Both types of stimuli elicited a negative slow wave that reached maximal amplitude over occipital sensors. Note that there were no substantial differences between the waveforms within the first 100 ms post stimulus, but the later slow wave elicited by the dynamic stimuli was delayed in time compared to the one elicited by the static stimuli. This delay was maximal for occipito-temporal electrodes located over the right hemisphere.
Fig. 3.
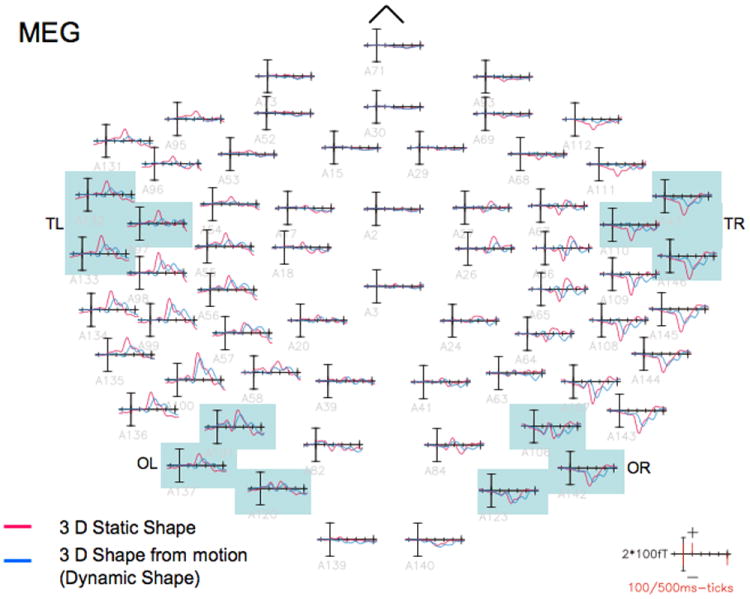
Grand-averaged event-related magnetic field waveforms elicited by 3D static (red waveforms) and dynamic shape (blue waveforms) stimuli. A delay that was maximal over right occipito-temporal sensors could also be observed in the event-related magnetic field waveforms, the responses to dynamic shapes being delayed compared to those to static shapes. Note that the delay pattern was very similar in the magnetic and electric potential waveforms.
Fig. 4.
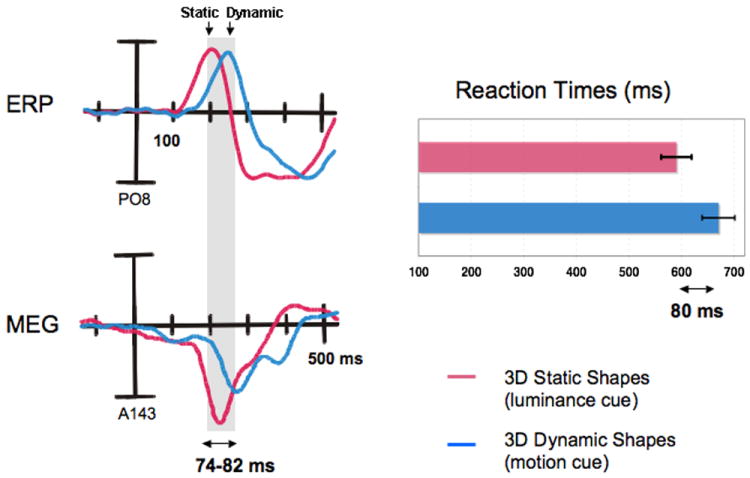
The delays between the waveforms elicited by dynamic (in blue) and static shapes (in red) are shown for the ERP (upper left) taken from channel PO8 and for the ERMF (bottom left) taken from sensor A143 (which is located over the right occipito-temporal cortex) along with the corresponding reaction times for both experimental conditions (right side of the Fig.). Note that the mean delays of 74.2 ms in the EEG and 81.8 ms in the MEG are very close to the mean reaction time delay of 80 ms.
Source analyses and sequence of cortical activation
To establish a dynamic profile of the changes in brain activation during the course of perception of 3D object shapes, source analyses were performed on single subject data and, for illustrative purposes, also on the grand-averaged data in the time-range of 50 ms - 550 ms (Fig 5a and 6a). Estimates of activity elicited by static 3D shapes were observed from 70 ms – 120 ms in the early visual cortex. The activity then migrated to bilateral lateral-occipital regions from 165 ms – 240 ms, and then to bilateral ventral temporal regions from 220 ms – 260 ms. In this latter region the estimates of activity were stronger in the right hemisphere. From 280 ms – 410 ms, estimates of activity could be observed in the parietal cortex, in the vicinity of the intraparietal sulcus (IPS). This pattern of activity was paralleled by activity from 295 ms – 415 ms in early visual regions.
Fig. 5.
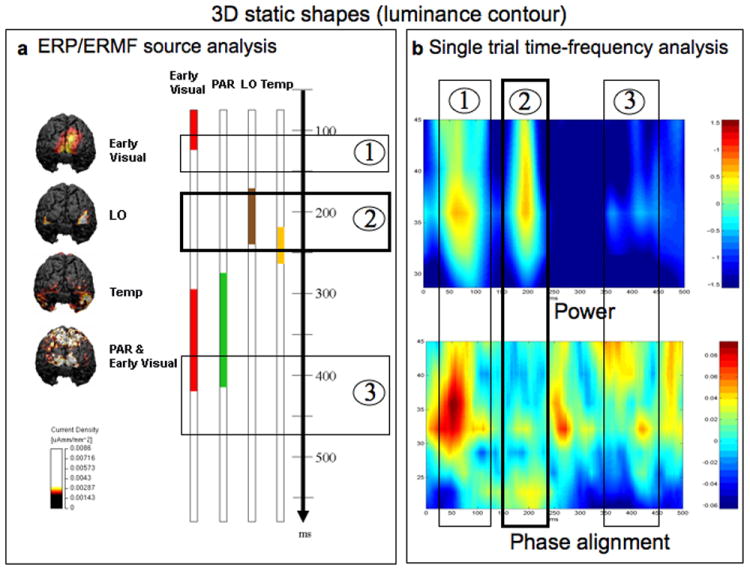
The activation sequence and binding during perception of 3D shapes by luminance contours. a) The left column illustrates the sources at different stages of processing based on the grand-averaged ERP/ERMF. The static 3D shapes elicited sequential activity in early visual areas, followed by activity in area LO, and later by activity in bilateral ventral temporal regions, with only little temporal overlap. After 300 ms, the activity was observed in parietal regions, which temporally overlapped with activity in previously activated visual regions. b) Time-frequency analysis on single trials revealed three significant increases of power in the gamma band compared to the pre-stimulus baseline. The first increase in power was closely associated with a concurrent increase in phase alignment (5b, bottom), indicating that the increase in power was of evoked nature. The second increase corresponded to the time range in which estimates of activity were localized to LO (Box 2). No concurrent significant increase in phase alignment was observed during this time (denoted 2, bottom), indicating that this increase in power was of induced nature, a signature of binding. Note that the single trial frequency analyses identified only one increase in power in the gamma band of induced nature in the time range 160 - 220 ms. During this time range (~200 ms) estimates of activity were observed in area LO in the average based source analyses (Box 2 in panel a).
Fig. 6.
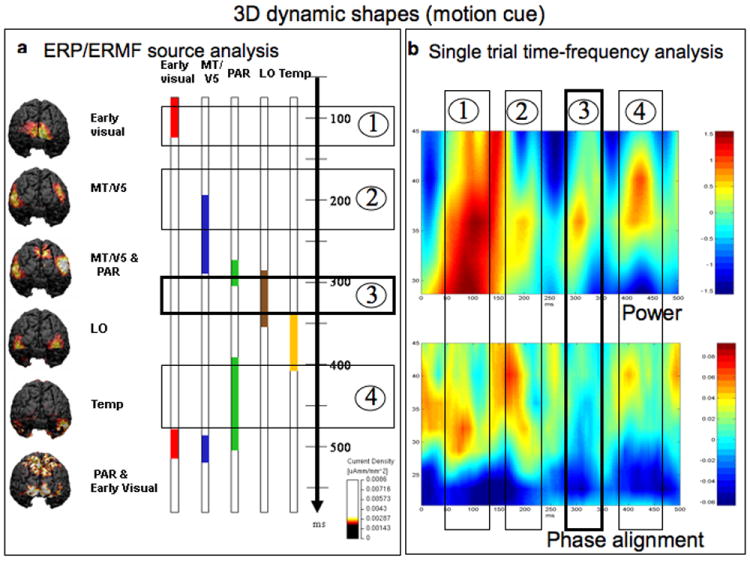
The activation sequence and binding during perception of 3D dynamic shapes. a). Dynamic shapes elicited sequential activity in early visual areas, followed by activity in hMT, in turn followed by a short period of activity in parietal regions. Then activity was observed in LO regions, followed by activity in ventral temporal regions. At this point, only little temporal overlap could be observed between these activations. Then longer lasting and stronger estimates of activity were observed again in the parietal cortex, which was paralleled by activity in occipito-temporal and early visual regions, now with a higher amount of temporal overlap. The most predominant estimates of activity around 300 ms were located in area LO (box 3). b). In this condition the time-frequency analysis on single trials revealed four significant increases of power in the gamma band compared to the pre-stimulus baseline. While the first two (boxes 1 and 2) and the fourth increase (box 4) were accompanied by concurrent increases in phase alignment (the bottom panel b), the third increase (box 3) occurred in the absence of such a concurrent phase alignment, indicating its induced nature. Note that this is the only increase of power in the gamma band that had an induced nature in the time range 280 - 320 ms (box 3). In the average based source analyses temporally overlapping estimates of activity were observed in hMT, the parietal cortex, but predominantly in area LO (also see box 3 in panel a).
For dynamic 3D shapes, estimates of activity were similarly first observed in the early visual cortex in the time range of 70 ms – 125 ms. At 195 ms – 280 ms middle occipital regions were activated bilaterally (see Fig 6a). In the time range of 260 ms – 310 ms estimates of activity were then observed in bilateral parietal cortex around the IPS. From 285 ms – 355 ms, estimates of activity were located in lateral occipital areas bilaterally followed from 335 ms – 410 ms by activity located in bilateral ventral temporal regions mainly of the right hemisphere. From 390 ms – 505 ms estimates of activity were observed in bilateral parietal cortex. These estimates of activity were paralleled in the time ranges of 480 ms - 515 ms and 490 ms – 520 ms by activity in early visual cortical regions and in lateral and middle occipital regions respectively.
Functional anatomy
Unlike hemodynamic methods in which localizers can be employed to identify functional relevant regions like hMT or LO, it is far more difficult to precisely localize these regions on the basis of electrophysiological data. However in addition to the literature (Malach et al 1995; Grill-Spector et al., 1998; Kourtzi et al.,2003; Welchman et al., 2005; Zeki et al., 1991; Tootell et al., 1995; Orban et al., 2003), our own fMRI (data not shown) and previous MEG data (Schoenfeld, 2003) indicated that the two types of stimuli used here typically elicit activity in distinct key regions of the visual system. Static stimuli activate the early visual regions, area LO, ventral temporal and parietal regions while dynamic shape stimuli typically also activate hMT (Peuskens et al., 2004). In this framework, the estimates of activity observed in the lateral occipital cortex in both experimental conditions most likely correspond to the LO region. This is equally true for the estimates of activity elicited by the dynamic stimuli in middle occipital regions that most likely correspond to region hMT, which is specialized in motion processing (Zeki et al., 1991; Tootell et al., 1995; Orban et al., 2003). Given the good match of the source locations with our own and other previous reports it is very likely that the sources identified in the current work correspond to the functional regions LO, hMT, IPS, and the ventral inferior temporal cortex.
Single trial frequency analysis
A key question with respect to perception of dynamic objects is at which stage of the processing chain the assembly of the visual features into a coherent object might occur. Binding processes across neighbouring visual areas have been suggested to be reflected in the synchronization of electrical oscillations in the gamma band (Singer and Reed, 1997; Engel, 1997; Tallon-Baudry, et al., 1996; Fries et al., 1997). Importantly, two types of responses have been described with respect to the nature of these oscillations. The first type of response was called evoked response and can be described as an increase in amplitude, directly related to a concurrent alignment in phase, which is tightly related to the stimulus onset. Due to the tight phase alignment evoked by the stimulus, this type of response would be apparent to classical averaging techniques like ERP and ERMF (Bertrand and Tallon-Baudry, 2000; Tallon-Baudry, 2003; Herrmann et al., 2004). The second type of response was called induced response and was described as an increase in amplitude in the absence of a concurrent stimulus-dependent tight alignment in phase. Due to the lack of phase alignment with respect to the stimulus onset, these responses are not apparent in the classical epoch-based averaging techniques. The presence of such induced responses have been associated with binding of visual features (Singer and Reed, 1997; Engel, 1997; Tallon-Baudry, et al., 1996; Herrmann et al., 2004). In the present study, we looked for an induced gamma response at around 40 Hz in the time-frequency analysis to identify those processing stages related to binding.
Single trial frequency analyses were performed over occipital sensors for both experimental conditions (Fig. 5b and Fig. 6b). During presentation of static shapes significant increases of amplitude (power) compared to the pre-stimulus baseline were observed in the gamma band in the time ranges 40 – 120 ms, 160 – 220 ms and 350 – 450 ms (see Fig 5b). In the early (40 – 120 ms) and late (350 – 450) time ranges these increases in amplitude were accompanied by concomitant increases in phase alignment (boxes nr. 1 and 3 in Fig 5b) indicating the evoked nature of these responses. For the increased amplitude in the middle time range (160 - 220 ms) however, only minor phase alignment could be observed (box nr. 2 in Fig 5b). An increase in gamma band power in the absence of a concurrent increase in phase alignment indicates the induced nature of the oscillation and has been suggested to be a hallmark of binding (Singer, W. & Reed,1997; Engel et al. 1997; Tallon-Baudry, 1996; Herrmann, 2004).
When dynamic shapes were presented, four individual significant increases of amplitude (power) were observed. The first significant increase occurred in the time range 50 – 160 ms and was accompanied by a concurrent increase in phase alignment (box nr. 1 in Fig 6b). The second increase in power (box nr. 2 in Fig 6b) occurred during 180 - 210 ms and, like the first, was also accompanied by an increase in phase alignment. The third increase occurred between 280 - 320 ms. Unlike the previous increase, no concurrent increase in phase alignment could be observed (box nr. 3 in Fig 6b) indicating the induced nature of the power peak. The fourth increase in power occurred in the time range of 380 - 450 ms and was again associated with a concurrent increase in phase alignment (box nr 4 in Fig 6b).
Discussion
Since most visual objects have different constituent features, like color, shape, or movement, it is an important challenge to elucidate the processes that underlie the assembly of these features to a unitary object. In animal research visual shape has been shown to be processed along the ventral visual stream (Ungerleider and Mishkin, 1982) and using hemodynamic measures key visual areas like area LO or the ventral temporal cortex (Kanwisher et al., 1997; Haxby et al., 2001) have also been identified in the human. More importantly, these areas have been shown to be cue invariant, i.e. they are activated whenever a visual shape is perceived regardless of the type of stimulus in which the shape is embedded (luminance, color, texture, motion) (Schoenfeld et al., 2003; Malach et al., 1995; Kourtzi et al., 2003; Avidan et al., 2002; Sasaki et al., 2005; Sawamura et al., 2005) paralleling basic findings in single cell recordings (Sary et al., 1993; Janssen et al., 2003).
It is important to note that there are differences between humans and monkeys with respect to the functional organization of the visual system. While consistent findings have been reported for early visual areas (Vanduffel et al., 2002) and surprisingly also for face processing regions (Tsao et al., 2006) in the ventral temporal cortex, important differences have also been noted. Significantly, our study extends the present knowledge by providing information about the temporal dynamics of these regions during 3D shape perception. We have demonstrated that, while parts of the spatial pattern of activity are indeed cue invariant, the timing critically depends on the processing of features, like luminance or motion, out of which shape information has to be extracted (Brincat & Connor, 2006). The results of the present study are well in line with previous work showing that areas LO and IT are active during both shape-from-luminance and shape-from-motion conditions.
Our study provides information about the temporal dynamics of processing in these regions during 3D shape perception. We show that after the initial stage of processing in the primary visual cortex, which is similar for both conditions, the electromagnetic indices of shape-from-motion processing were delayed in time (see Fig 4) by around 80 ms compared to shape-from-luminance. This temporal delay was maximal over right temporal sensors, was positively correlated with the difference in reaction times for dynamic versus static shapes and could be attributed to additional processing in area hMT (see also Fig 5 and 6) that was not required when the shape was extracted on the basis of luminance. A very similar result has been reported for the processing of 2D shapes-from-motion vs. luminance using the same methodology (Schoenfeld et al., 2003).
Following early visual areas, dynamic 3D shapes elicit activity in the well-known area hMT that is involved in motion processing (Zeki et al., 1991; Tootell et al., 1995; Orban et al., 2003). Therefore it is reasonable to assume that, at this stage, motion information is processed, a stage that was not necessary for the static shape stimulus, given that the shape could be extracted on the basis of luminance alone. In the late time range of the hMT activation, concurrent activity was observed, for a very short period of ca. 20 ms, in the medial part of the parietal cortex, temporally overlapping towards the end with activity in the area LO of both hemispheres. Logically, after the processing of the motion information, the depth and shape information are next in line to be processed. Although it has been suggested that in humans a substantial part of the depth processing is performed in MT (Orban et al., 2003), the short activation of the medial parietal cortex suggests that at least some aspects of visual depth are processed in this region. Additionally, the lack of parietal activation in viewing 2D form-from-motion stimuli (Schoenfeld et al., 2003) suggests that the short parietal activity is likely to reflect depth information processing to some extent. The following activity in area LO is compatible with the extraction of shapes or silhouettes from motion by assembling different perceptual features of the stimulus (Grill-Spector et al., 1998). As observed with static shapes, the extracted geometrical shape needs to be compared to the shape representation in the ventral occipital and ventral temporal cortices, which is consistent with the following activity observed in this region. The observed overlapping activity in the parietal cortex and in early visual areas at the end of the sequence for both types of stimuli is consistent with the view that the parietal cortex mediates top-down influence on early visual areas.
To sum up, we investigated the temporal dynamics of the perception of stationary and dynamic 3D shapes by applying two different analysis methods on electrophysiological data. The close correspondence of an induced gamma response with concurrent sources located in LO in both experimental conditions at different points in time (~200 ms for luminance and ~300 ms for dynamic cues) strongly suggests that LO might indeed be the key region for the assembly of object features. The result of this assembly can then be fed forward to ventral temporal areas for comparison with the memory representation of the object (Kanwisher et al., 1997; Haxby et al., 2001), which is well in line with the observed activity in the ventral occipital cortex following the estimates of activity in LO. For both types of stimuli, the results are compatible with a model of initial mostly serial processing, in which first low level visual features such as luminance or motion are processed, followed by recurrent feed-back mediated by the parietal cortex at later stages. Converging evidence from both analyses, namely ERP/ERMF sources located in LO and an increase of induced gamma power in the corresponding time range indicates that the assembly of the shape’s constituent visual features to a unitary whole takes place in area LO. The timing of this assembly appears to be critically dependent on the complexity of the constituent features. When additional features such as motion need to be processed, it results in a delay in forwarding information to object recognition areas and in the following behavioral response.
Acknowledgments
We thank L. Ungerleider for her comments on an earlier version of the manuscript and X. Jiang for technical assistance for the visual stimuli. Supported by US National Institute of Health grant AG000986 to Y.J and Germany DFG Scho 1217/1-1 grant to M.A.S.
References
- Avidan G, Harel M, Hendler T, Ben-Bashat D, Zohary E, Malach R. Contrast sensitivity in human visual areas and its relationship to object recognition. J Neurophysiol. 2002;87:3102–16. doi: 10.1152/jn.2002.87.6.3102. [DOI] [PubMed] [Google Scholar]
- Bertrand O, Tallon-Baudry C. Oscillatory gamma activity in humans: a possible role for object representation. Int J Psychophysiol. 2000;38:211–23. doi: 10.1016/s0167-8760(00)00166-5. [DOI] [PubMed] [Google Scholar]
- Brincat SL, Connor CE. Dynamic shape synthesis in posterior inferotemporal cortex. Neuron. 2006;49:17–24. doi: 10.1016/j.neuron.2005.11.026. [DOI] [PubMed] [Google Scholar]
- Cowey A, Vaina LM. Blindness to form from motion despite intact static form perception and motion detection. Neuropsychologia. 2000;38:566–78. doi: 10.1016/s0028-3932(99)00117-7. [DOI] [PubMed] [Google Scholar]
- Denys K, Vanduffel W, Fize D, Nelissen K, Peuskens H, Van Essen D, Orban GA. The processing of visual shape in the cerebral cortex of human and nonhuman primates: a functional magnetic resonance imaging study. J Neurosci. 2004;24:2551–2565. doi: 10.1523/JNEUROSCI.3569-03.2004. [DOI] [PMC free article] [PubMed] [Google Scholar]
- Dosher BA, Sperling G, Wurst SA. Tradeoffs between stereopsis and proximity luminance covariance as determinants of perceived 3D structure. Vision Res. 1986;26:973–990. doi: 10.1016/0042-6989(86)90154-9. [DOI] [PubMed] [Google Scholar]
- Düzel E, Habib R, Schott B, Schoenfeld A, Lobaugh N, McIntosh AR, Scholz M, Heinze HJ. A multivariate, spatiotemporal analysis of electromagnetic time-frequency data of recognition memory. Neuroimage. 2003;18:185–97. doi: 10.1016/s1053-8119(02)00031-9. [DOI] [PubMed] [Google Scholar]
- Engel AK, Roelfsema PR, Fries P, Brecht M, Singer W. Role of the temporal domain for response selection and perceptual binding. Cereb Cortex. 1997;7:571–82. doi: 10.1093/cercor/7.6.571. [DOI] [PubMed] [Google Scholar]
- Fine I, et al. Long-term deprivation affects visual perception and cortex. Nat Neurosci. 2003;6:915–6. doi: 10.1038/nn1102. [DOI] [PubMed] [Google Scholar]
- Fries P, Roelfsema PR, Engel AK, Konig P, Singer W. Synchronization of oscillatory responses in visual cortex correlates with perception in interocular rivalry. Proc Natl Acad Sci U S A. 1997;94:12699–704. doi: 10.1073/pnas.94.23.12699. [DOI] [PMC free article] [PubMed] [Google Scholar]
- Fuchs M, Wagner M, Wischmann HA, Kohler T, Theissen A, Drenckhahn R, et al. Improving source reconstructions by combining bioelectric and biomagnetic data. Electroencephalogr Clin Neurophysiol. 1998;107(2):93–111. doi: 10.1016/s0013-4694(98)00046-7. [DOI] [PubMed] [Google Scholar]
- Grill-Spector K, Kushnir T, Edelman GM, Itzchak Y, Malach R. Cue-invariant activation in object-related areas of the human occipital lobe. Neuron. 1998;21:191–202. doi: 10.1016/s0896-6273(00)80526-7. [DOI] [PubMed] [Google Scholar]
- Guthrie D, Buchwald JS. Significance testing of difference potentials. Psychophysiology. 1991;28(2):240–244. doi: 10.1111/j.1469-8986.1991.tb00417.x. [DOI] [PubMed] [Google Scholar]
- Haxby JV, Gobbini MI, Furey ML, Schouten I, Pietrini P. Distributed and overlapping representations of faces and objects in ventral temporal cortex. Science. 2001;293:2425–30. doi: 10.1126/science.1063736. [DOI] [PubMed] [Google Scholar]
- Herrmann CS, Munk MH, Engel AK. Cognitive functions of gamma-band activity: memory match and utilization. Trends Cogn Sci. 2004;8:347–55. 28. doi: 10.1016/j.tics.2004.06.006. [DOI] [PubMed] [Google Scholar]
- Iwaki S, Ueno S, Imada T, Tonoike M. Dynamic cortical activation in mental image processing revealed by biomagnetic measurement. NeuroReport. 1999;10:1793–1797. doi: 10.1097/00001756-199906030-00031. [DOI] [PubMed] [Google Scholar]
- Janssen P, Vogels R, Liu Y, Orban GA. At least at the level of inferior temporal cortex, the stereo correspondence problem is solved. Neuron. 2003;37:693–701. doi: 10.1016/s0896-6273(03)00023-0. [DOI] [PubMed] [Google Scholar]
- Jiang Y, Pantle AJ, Mark L. Visual inertia of rotating 3-D objects. Percept Psychophys. 1998;56:691–700. doi: 10.3758/bf03206036. [DOI] [PubMed] [Google Scholar]
- Kanwisher N, Woods RP, Iacoboni M, Mazziotta JC. A locus in human extrastriate cortex for visual shape analysis. J Cogn Neurosci. 1997;9:133–142. doi: 10.1162/jocn.1997.9.1.133. [DOI] [PubMed] [Google Scholar]
- Kourtzi Z, Erb M, Grodd W, Bulthoff HH. Representation of the perceived 3-D object shape in the human lateral occipital complex. Cereb Cortex. 2003;13:911–20. doi: 10.1093/cercor/13.9.911. [DOI] [PubMed] [Google Scholar]
- Malach R, Reppas JB, Benson RR, Kwong KK, Jiang H, Kennedy WA, Ledden PJ, Brady TJ, Rosen BR, Tootel RBH. Object-related activity revealed by functional magnetic resona./nce imaging in human occipital cortex. Proc Natl Acad Sci U S A. 1995;92:8135–8139. doi: 10.1073/pnas.92.18.8135. [DOI] [PMC free article] [PubMed] [Google Scholar]
- Murray SO, Olshausen BA, Woods DL. Processing shape, motion and three-dimensional shape-from-motion in the human cortex. Cereb Cortex. 2003;13:508–16. doi: 10.1093/cercor/13.5.508. [DOI] [PubMed] [Google Scholar]
- Orban GA, Fize D, Peuskens H, Denys K, Nelissen K, Sunaert S, Todd J, Vanduffel W. Similarities and differences in motion processing between the human and macaque brain: evidence from fMRI. Neuropsychologia. 2003;41:1757–68. doi: 10.1016/s0028-3932(03)00177-5. [DOI] [PubMed] [Google Scholar]
- Orban GA, Sunaert S, Todd JT, Van Hecke P, Marchal G. Human cortical regions involved in extracting depth from motion. Neuron. 1999;24:929–40. doi: 10.1016/s0896-6273(00)81040-5. [DOI] [PubMed] [Google Scholar]
- Orban GA, Van Essen D, Vanduffel W. Comparative mapping of higher visual areas in monkeys and humans. Trends Cogn Sci. 2004;8:315–24. doi: 10.1016/j.tics.2004.05.009. [DOI] [PubMed] [Google Scholar]
- Paradiso MA. Visual neuroscience: illuminating the dark corners. Curr Biol. 2000;10:R15–8. doi: 10.1016/s0960-9822(99)00249-3. [DOI] [PubMed] [Google Scholar]
- Peuskens H, Claeys KG, Todd JT, Norman J Farley, Van Hecke P, Orban GA. Attention to 3-D shape, 3-D motion, and texture in 3-D structure from motion displays. J Cogn Neurosci. 2004;16:665–82. doi: 10.1162/089892904323057371. [DOI] [PubMed] [Google Scholar]
- Sary G, Vogels R, Orban GA. Cue-invariant shape selectivity of macaque inferior temporal neurons. Science. 1993;260:995–7. doi: 10.1126/science.8493538. [DOI] [PubMed] [Google Scholar]
- Sasaki Y, Vanduffel W, Knutsen T, Tyler C, Tootell R. Symmetry activates extrastriate visual cortex in human and nonhuman primates. Proc Natl Acad Sci U S A. 2005;102:3159–63. doi: 10.1073/pnas.0500319102. [DOI] [PMC free article] [PubMed] [Google Scholar]
- Sawamura H, Georgieva S, Vogels R, Vanduffel W, Orban GA. Using functional magnetic resonance imaging to assess adaptation and size invariance of shape processing by humans and monkeys. J Neurosci. 2005;25:4294–306. doi: 10.1523/JNEUROSCI.0377-05.2005. [DOI] [PMC free article] [PubMed] [Google Scholar]
- Schoenfeld MA, Woldorff M, Düzel E, Scheich H, Heinze HJ, Mangun GR. Form-from-motion: MEG evidence for time course and processing sequence. J Cogn Neurosci. 2003;15:157–72. doi: 10.1162/089892903321208105. [DOI] [PubMed] [Google Scholar]
- Schoenfeld M, Hopf JM, Martinez A, Mai H, Sattler C, Gasde A, et al. Spatio-temporal Analysis of Feature-Based Attention. Cereb Cortex. 2007 doi: 10.1093/cercor/bhl154. Epub ahead of print. [DOI] [PubMed] [Google Scholar]
- Sereno ME, Trinath T, Augath M, Logothetis NK. Three-dimensional shape representation in monkey cortex. Neuron. 2002;33:635–52. doi: 10.1016/s0896-6273(02)00598-6. [DOI] [PubMed] [Google Scholar]
- Singer W, Reed RR. Sensory systems. Editorial overview. Curr Opin Neurobiol. 1997;7:469–72. doi: 10.1016/s0959-4388(97)80024-4. [DOI] [PubMed] [Google Scholar]
- Tallon-Baudry C, Bertrand O. Oscillatory gamma activity in humans and its role in object representation. Trends Cogn Sci. 1999;3:151–162. doi: 10.1016/s1364-6613(99)01299-1. [DOI] [PubMed] [Google Scholar]
- Tallon-Baudry C. Oscillatory synchrony and human visual cognition. J Physiol Paris. 2003;97:355–63. doi: 10.1016/j.jphysparis.2003.09.009. [DOI] [PubMed] [Google Scholar]
- Tallon-Baudry C, Bertrand O, Delpuech C, Pernier J. Stimulus specificity of phase-locked and non-phase-locked 40 Hz visual responses in human. J Neurosci. 1996;16:4240–9. doi: 10.1523/JNEUROSCI.16-13-04240.1996. [DOI] [PMC free article] [PubMed] [Google Scholar]
- Todd JT, Bressan P. The perception of 3-dimensional affine structure from minimal apparent motion sequences. Percept Psychophys. 1990;48:419–30. doi: 10.3758/bf03211585. [DOI] [PubMed] [Google Scholar]
- Tootell RB, Reppas JB, Kwong KK, Malach R, Born RT, Brady TJ, Rosen BR, Belliveau JW. Functional analysis of human MT and related visual cortical areas using magnetic resonance imaging. J Neurosci. 1995;15:3215–30. doi: 10.1523/JNEUROSCI.15-04-03215.1995. [DOI] [PMC free article] [PubMed] [Google Scholar]
- Tsao DY, Freiwald WA, Tootell RB, Livingstone MS. A cortical region consisting entirely of face-selective cells. Science. 2006;311:670–4. doi: 10.1126/science.1119983. [DOI] [PMC free article] [PubMed] [Google Scholar]
- Ullman S. The interpretation of structure from motion. Proc R Soc Lond B Biol Sci. 1979;203:405–26. doi: 10.1098/rspb.1979.0006. [DOI] [PubMed] [Google Scholar]
- Ungerleider LG, Mishkin M. In: Analysis of visual behavior. Ingle DJ, Goodale MA, Mansfield RJW, editors. MIT Press; Cambridge: 1982. pp. 549–586. [Google Scholar]
- Vanduffel W, Fize D, Peuskens H, Denys K, Sunaert S, Todd JT, Orban GA. Extracting 3D from motion: differences in human and monkey intraparietal cortex. Science. 2002;298:413–5. doi: 10.1126/science.1073574. [DOI] [PubMed] [Google Scholar]
- Wallach H, O’Connell DN, Neisser U. The memory effect of visual perception of three-dimensional form. J Exp Psychol. 1953;45:360–8. doi: 10.1037/h0063368. [DOI] [PubMed] [Google Scholar]
- Welchman AE, Deubelius A, Conrad V, Bulthoff HH, Kourtzi Z. 3D shape perception from combined depth cues in human visual cortex. Nat Neurosci. 2005;8:820–7. doi: 10.1038/nn1461. [DOI] [PubMed] [Google Scholar]
- Zeki S, Watson JD, Lueck CJ, Friston KJ, Kennard C, Frackowiak RS. A direct demonstration of functional specialization in human visual cortex. Journal of Neuroscience. 1991;11:641. doi: 10.1523/JNEUROSCI.11-03-00641.1991. [DOI] [PMC free article] [PubMed] [Google Scholar]