Fig. 4.
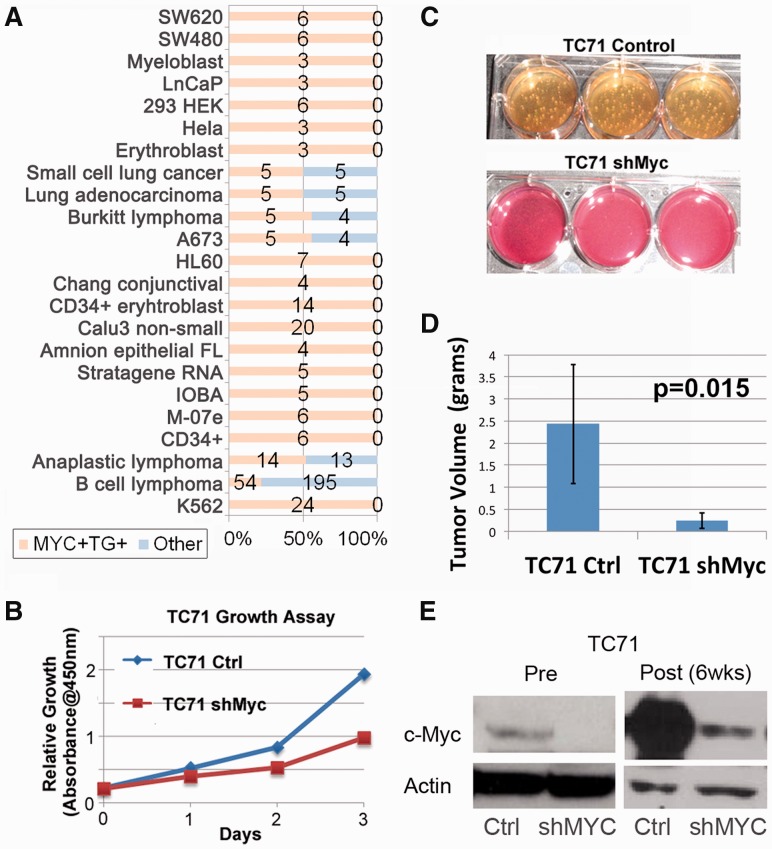
MYC analysis and validation. (A) MYC TF+TG+ biological contexts (similar contexts are grouped) and the number of MYC+TG+ samples (orange) and number of non-MYC+TG+ samples (blue) are shown. The majority of TF+TG+ samples are tumor types. (B) Decrease in proliferation of TC71 cells on knockdown of MYC. Control and shMyc TC71 cells were evaluated for changes in proliferation rates by using a cell viability reagent, CCK-8. Two thousand cells were initially plated into individual 96 wells and assessed daily for changes in growth and proliferation. (C) Decreased tumorigenicity as assessed by soft-agar assay for shMyc TC71 cells. Control TC71 cells developed significant soft-agar colonies within 2–3 weeks, whereas the shMyc cells formed only a few miniscule colonies over the same time. (D) Graphic display of differences in tumor weight comparing control and shMyc tumors. On average, the shMyc tumors weighed only 20% of control tumors. Vertical error bars indicate the standard deviation of the tumor volume. The P-value is obtained from a two-sided t-test. (E) Western blot analysis for MYC protein, c-Myc, in control and shMyc cells at 0 (Pre) and 6 weeks (Post). Actin is provided as a loading control. Blot displays decrease in MYC protein levels on stable expression of shMyc in TC71 cells

