Abstract
Motivation: Histone modifications regulate chromatin structure and gene expression. Although nucleosome formation is known to be affected by primary DNA sequence composition, no sequence signature has been identified for histone modifications. It is known that dense H3K4me3 nucleosome sites are accompanied by a low density of other nucleosomes and are associated with gene activation. This observation suggests a different sequence composition of H3K4me3 from other nucleosomes.
Approach: To understand the relationship between genome sequence and chromatin structure, we studied DNA sequences at histone modification sites in various human cell types. We found sequence specificity for H3K4me3, but not for other histone modifications. Using the sequence specificities of H3 and H3K4me3 nucleosomes, we developed a model that computes the probability of H3K4me3 occupation at each base pair from the genome sequence context.
Results: A comparison of our predictions with experimental data suggests a high performance of our method, revealing a strong association between H3K4me3 and specific genomic DNA context. The high probability of H3K4me3 occupation occurs at transcription start and termination sites, exon boundaries and binding sites of transcription regulators involved in chromatin modification activities, including histone acetylases and enhancer- and insulator-associated factors. Thus, the human genome sequence contains signatures for chromatin modifications essential for gene regulation and development. Our method may be applied to find new sequence elements functioning by chromatin modulation.
Availability: Software and supplementary data are available at Bioinformatics online.
Contact: misook.ha@samsung.com or wli@uchicago.edu
Supplementary information: Supplementary data are available at Bioinformatics online.
1 INTRODUCTION
Chromatin remodeling mediated by histone modifications is an important mechanism for specific gene expression (Ha et al., 2011). However, the relationship between genome sequence and chromatin remodeling is not well understood. Although DNA sequence preferences for nucleosome formation have been known since the mid 1980s (Drew and Travers, 1985; Struhl, 1985; Yuan et al., 2005), the role of histone–DNA interaction in nucleosome formation is subjected to debate (Kaplan et al., 2009; Zhang et al., 2009). The interplay between transcription factors (TFs) and adenosine triphosphate-dependent chromatin modulating factors in regulating histone modifications implies that histone modifications do not follow the sequence preferences of the general H3 nucleosomes or the other nucleosomes that are not trimethylated at H3K4 (Berger, 2007; Jenuwein and Allis, 2001; Matthews et al., 2007). Indeed, the H3K4me3 nucleosome is preferentially enriched in the genomic regions showing a low density of other nucleosomes and marks an open chromatin region. The advance of DNA sequencing technology with immunoprecipitated DNA segment associated with specific histone modifications allows us to examine the DNA sequence compositions specific to histone modifications in an unbiased way. Therefore, we extracted DNA sequences of nucleosomes carrying individual histone modifications from ChIP-seq data (Barski et al., 2007; Cui et al., 2009; Hawkins et al., 2010; Lister et al., 2009; Wang et al., 2008, 2009b) and identified the features of sequences bound to histone modifications in ChIP-seq experiments. Using the identified sequence specificities of H3K4me3 and H3 nucleosomes, we developed a model to compute the probabilities of H3K4me3 and H3 nucleosome occupation from the genome sequence context. H3K4me3 ChIP-seq data in various human cells indicate that the loci predicted by our model to have a high probability of the H3K4me3 sequence signature are preferentially occupied by H3K4me3 nucleosome. Our study provides a method for investigating the DNA sequence features of chromatin structure. Furthermore, our analyses show that the human genome sequence contains signals for chromatin remodeling at epigenetic regulatory elements.
2 METHODS
2.1 ChIP-seq data sources
The ChIP-seq data of H3 nucleosomes in two different conditions of human CD4 + T cells were obtained from Schones et al. (2008). The ChIP-seq data of CTCF, H3K4me1, H3K4me2, H3K4me3, H3K27me3, RNA Pol II in human CD4 + T cells, CD133 + and CD36 + cells were obtained from Barski et al. (2007) and Cui et al. (2009). Methyl-bisulfite sequencing data and ChIP-seq data of various histone methylations in human embryonic stem cells (HESC) are from Lister et al. (2009) and Hawkins et al. (2010). The ChIP-seq data of histone acetylases, deacetylases and acetylations are from Wang et al. (2008, 2009b).
2.2 Identification of sequence specificities of nucleosome modifications
The 30–50 bp sequences from the ChIP-seq data are mapped to the February 2009 human reference sequence (GRCh37/hg19) by perfect and unique match without allowing any mismatch or gap. To recover nucleosomal DNA fragments, each read was extended toward its 3′-end by 151 bp; the 30–50 bp reads are from the ends of both strands in nucleosome DNAs. The possible range of the ends of nucleosome-bound DNAs may be wider than that of micrococal nuclease-treated DNAs. Therefore, we consider 151 bp nucleosome-bound DNA regions, and from these regions, we estimate the frequencies of monomer, 2, 3, 4, 5 and 6mer sequences for each histone modification and each cell type. The sequence frequencies are normalized by the sequence composition in the reference genome sequence (hg19/GRCh37) to account for bias because of genome sequence composition. In this way, we estimate the enrichment of nucleosomes at every sequence composition.
2.3 A probabilistic model of H3 and H3K4me3 nucleosome occupation in a genome
The occurrence of an H3 or H3K4me3 nucleosome at a genomic site can be affected by adjacent sequences or adjacent nucleosomes. Across a genome, we calculate the probability that a nucleosome (H3 or H3K4me3) locates at a locus by using the modified fifth order hidden Markov model (HMM) (Rabiner, 1989). This model considers possible arrangements in view of the competition with adjacent nucleosomes in evaluating the forward and backward status and sequence composition of the147 bp sequence.
2.3.1 Forward procedure
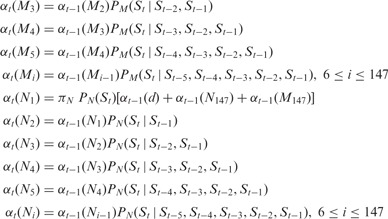
Using the forward procedure, we calculate the probability of each status at the ith position considering the genome sequence from the first bp S1 to Si.
Mi: The ith base pair in the DNA sequence of an H3K4me3 nucleosome.
Ni: The ith base pair the DNA sequence of an H3 nucleosome.
 : The probability that the sequence from
S1 to St is observed, and
St is the ith bp of the DNA sequence of
an H3K4me3 nucleosome.
 : The probability that the sequence from
S1 to St is observed, and
St is the ith bp of the DNA sequence of
an H3 nucleosome.
 : The probability that the sequence from
S1 to St is observed, and
St is not bound by any H3 or H3K4me3 nucleosome.
(1) Initialization
d: Depletion of all nucleosomes
 : Proportion of nucleosome-depleted regions
in the genome
 : Proportion of nucleosome-bound regions in
the genome
 : Proportion of H3K4me3 nucleosome-bound
regions in the genome
(2) Induction
 |
 |
(3) Termination
 , where T is the total
length of the genome.
2.3.2 Backward procedure
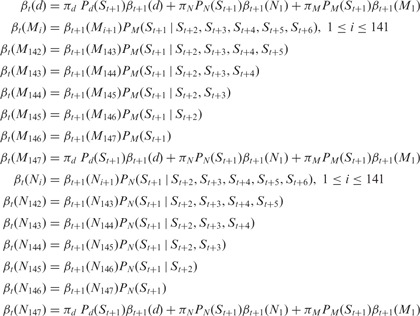
Using the backward procedure, we calculate the probability of observing the sequence,
from  to the end of the genome with an H3K4me3
nucleosome at
  .
.
 : Probability of the sequence from
 to the end of the genome when
 .
.
 : Probability of the sequence from
 to the end of the genome when
 .
.
 : Probability of the sequence from
 to the end of the genome when
 .
.
(1) Initialization
(2) Induction
 |
2.3.3 Integration of backward and forward probabilities
The probability that the tth bp is at Mi is normalized by the sum of all configurations in our model.
 |
2.3.4 The H3K4me3 sequence signature (the probability of H3K4me3 occupation based on DNA primary sequence)
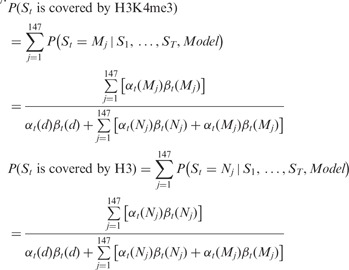
The probability that a base pair position can potentially be covered by an H3K4me3 can be calculated by summing the probabilities from M1 to M147.
 |
2.4 In vivo coverage of modified nucleosomes at a base pair
The ChIP-seq reads obtained from published data were mapped to the human genome sequence (hg19). Each 30–50 bp read perfectly matching the genome sequence only once was extended to 151 bp from the 5′-end of the read because the immunoprecipitated DNA fragments are 150 bp in length. The coverage of each histone modification at a base pair position was estimated by the number of extended reads covering that position. As the coverage is dependent on the depth of ChIP-seq, we use correlation coefficients that are standardized by standard deviations. The comparisons were made in the mappable genomic regions.
2.5 Comparison of the probabilistic H3K4me3 occupation map with in vivo data
To validate the predicted H3K4me3 occupation map, we calculate the correlation coefficient between the probability of H3K4me3 occupation at each base pair in the human reference genome (hg19/GRC37) and the in vivo coverage of H3K4me3 using ChIP-seq reads.
2.6 Identification of TF-binding sites and inter-chromatin interaction sites
The ER-α-bound human chromatin interaction sites were obtained from the ChIA-PET data in hg18 (Fullwood et al., 2009) and transferred to hg19 using liftOver. The AR- and FoxA1-binding sites in prostate cancer cells identified by Wang et al. (2009a) and Lupien et al. (2008) were transferred to hg19 using liftOver. NANOG-, OCT-, SOX2-, KLF4- and TAF1-binding sites in embryonic stem cells identified by Lister et al. (2009) were moved to hg19 using liftOver.
3 RESULTS
3.1 Sequence specificities of nucleosome modifications
We compared position-specific dinucleotide frequencies between H3 and H3K4me3 nucleosomal
DNA sequences. H3K4me3-bound DNA sequences show a 10 bp periodicity of dinucleotide
frequencies, but different amplitudes from H3 nucleosome-bound DNA (Supplementary Figs S1 and S2) (Satchwell et
al., 1986; Segal et
al., 2006). In addition to the 10 bp periodicity, position-specific
frequencies of each dinucleotide are within specific discrete ranges and differ from those
of H3 nucleosomes (Fig. 1; paired
t-tests, P-values  0
for CG frequencies in H3 versus H3K4me3, GC in H3 versus H3K4me3, CC/GG in H3 versus
H3K4me3, AG/CT in H3 versus H3K4me3, AC/GT in H3 versus H3K4me3, CA/TG in H3 versus
H3K4me3, AT in H3 versus H3K4me3, GA/TC in H3 versus H3K4me3, TA in H3 versus H3K4me3,
AA/TT in H3 versus H3K4me3).
Fig. 1.
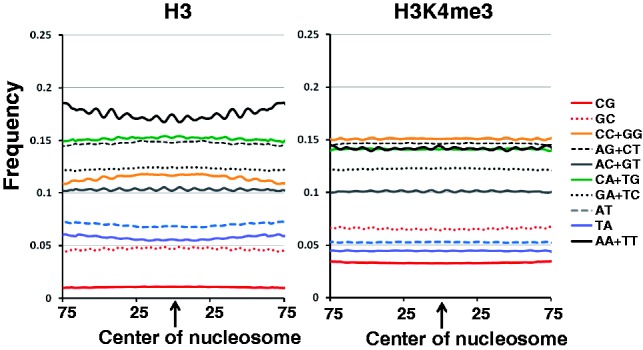
Dinucleotide frequencies in H3 and H3K4me3 nucleosomes. The frequency of every dinucleotide in H3 and H3K4me3 nucleosome-bound genomic sequences was calculated at each position using 3 bp windows. The horizontal axis represents distance from the center of nucleosome-bound sequences
The different dimer sequence frequencies between H3 and H3K4me3 nucleosomes imply that an
n-mer (n > 2) sequence composition can be a distinct feature of
H3K4me3 nucleosomes. We studied 6mer sequences in histone methylations because 6mer
sequences are long enough to represent sequence preferences, and the computation is still
feasible. The distinct sequence preferences of H3K4me3 and H3 nucleosome are well
reflected in 6mer sequence specificities and are consistently found in various cell types
(Fig. 2a and b, r
 0.98, P = 0). In
contrast, H3K4me1 and H3K27me3 nucleosomes show no consistent sequence preferences among
cell types (Fig. 2d and e). The preferred 6mer
DNA sequences of H3K4me3 show only a weak correlation with H3 nucleosome sequence
preferences (Fig. 2c, r
= 0.24, P = 0), indicating that H3K4me3 modification uses a
mechanism different from that of any other nucleosome.
Fig. 2.
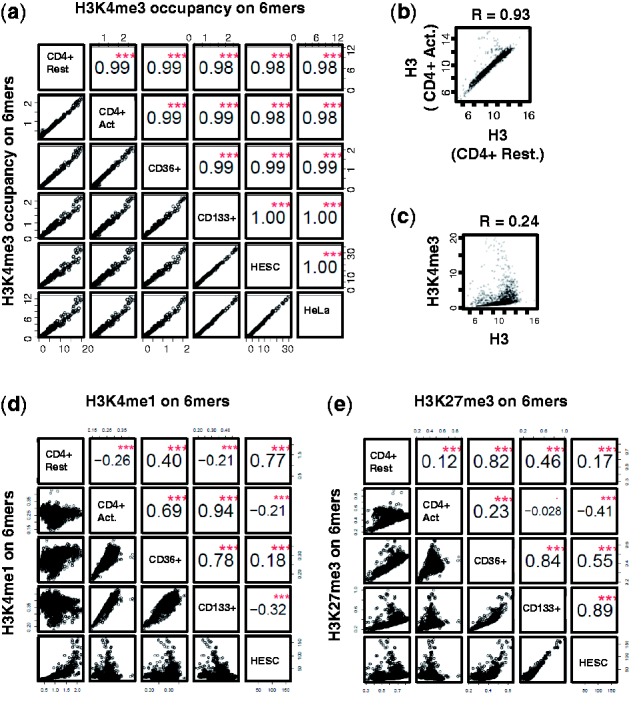
H3K4me3 shows consistent and distinct sequence specificity among various human cell types, whereas other modified nucleosomes do not. (a–e) The correlations of the 6mer specificities in H3K4me3 nucleosomes (a), in H3 nucleosomes (b), between H3K4me3 and H3 nucleosomes (c), in H3K4me1 nucleosomes (d) and in H3K27me3 nucleosomes (e). The nucleosome-bound DNAs were identified using the ChIP-seq data from various cell types: CD4 + T cells in resting state (CD4 + Rest), CD4 + T cells in activated state (CD4 + Act), CD36 + erythrocyte stem cell (CD36 + ), CD133 + , HESC and HeLa cells. The values in the squares represent correlation coefficients of 6mer sequence preference between two cell types. The red stars in a square signify that the correlation is highly significant, with the P-value close to 0. The vertical and horizontal axes represent the number of ChIP-seq reads covering the 6mer normalized by the number of 6mers in the human genome. Each point represents the enrichment of a 6mer in the ChIP-seq experiments in two cell types. The cell types on the x-axis and y-axis are marked on the main diagonal
To examine whether the sequence specificities differ between promoters and non-promoter regions, we calculated sequence specificities of histone modifications in the promoters and non-promoter regions. We found that the sequence specificities of histone modifications are highly significantly correlated between promoters and non-promoter regions (Supplementary Fig. S5), implying that the 6mer sequence specificities of H3K4me3 are consistently maintained across the genome.
3.2 A probabilistic model for an H3K4me3 occupation map in the human primary genome sequence
Using the aforementioned sequence specificities of H3K4me3 and H3 nucleosomes, we can
compute the probability, P(H3K4me3  ),
that a given 147 bp or shorter sequence segment (S) is an H3K4me3 nucleosome site, and
also P(H3
 )
(Fig. 3). In principle, a base pair in the
genome sequence can be the ith bp of the DNA sequence of a nucleosome
(i = 1, … , 147). However, at each time at most only one
nucleosome can occur at a base position. To consider various possible arrangements of
nucleosomes occupying a site, we constructed a modified 5th order (HMM of H3K4me3 and H3
nucleosome occupation (Fig. 3). Our model
calculates the probability of every possible arrangement of H3K4me3 and H3 nucleosomes on
the whole genome. It distinguishes between H3K4me3 and H3 nucleosomes and integrates all
possible arrangements based on forward and backward sequences of every base pair (Fig. 3). Ultimately, our model calculates the sum
of the probabilities of all possible H3K4me3 and H3 nucleosomes that can potentially cover
the base pair (see Section 2). If the loci
associated with a high probability of H3K4me3 nucleosome occupation becomes significantly
long, the genomic region may be considered to be fuzzy nucleosome sites as many previous
research articles did, including Yuan et
al. (2005) and Segal et
al. (2006) (Supplementary Fig. S6).
Fig. 3.
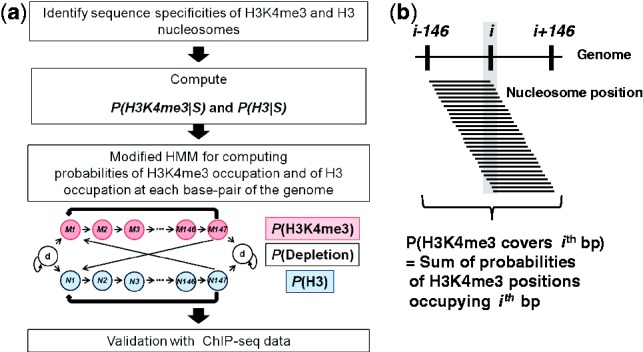
Flow chart to compute the probabilities of H3K4me3 and H3 nucleosome occupation at each base pair in the human genome. (a) First, the sequence specificities of H3K4me3 and H3 nucleosomes on 6mer sequences are inferred using in vivo ChIP-seq data. Second, the sequence specificities are used to compute the probability that a given sequence S of 147 bp is a potential H3K4me3 nucleosome site and the corresponding probability for an H3 nucleosome site without H3K4me3. Third, a modified fifth order HMM is constructed to compute the probabilities that a given base pair in the human genome is covered by an H3K4me3 nucleosome or an H3 nucleosome. (b) The probability of occupation at a base pair is the sum of the occupation probabilities of all the nucleosomes that can occupy the base pair
3.3 Association of the genome sequence context and the H3K4me3 occupation
To examine the association of primary genome sequence context and H3K4me3 distribution, we compared our sequence-based prediction of H3K4me3 occupation of a locus with the occupation level from ChIP-seq experiments. As ChIP-seq experiments cannot provide 1 bp resolution localization of nucleosomes, we use the probabilistic occupation level of H3K4me3 nucleosome and the number of ChIP-seq reads covering the locus. We found several lines of evidence for a significant correlation between our sequence-based prediction of H3K4me3 occupation and the experimental data. First, the 5′-ends of the E2F2 and GAPDH genes have been experimentally shown to carry a high level of H3K4me3 (Steward et al., 2006), and our model indeed predicts that these genomic regions have a high probability of H3K4me3 occupation (E2F2, r = 0.73, n = 3 × 10⁴ bp; GAPDH, r = 0.76, n = 6 × 10³ bp) (Fig. 4a and b). The correlation coefficients of coverage at a base pair resolution are within the ranges observed in biological replications (Leleu et al., 2010).
Fig. 4.
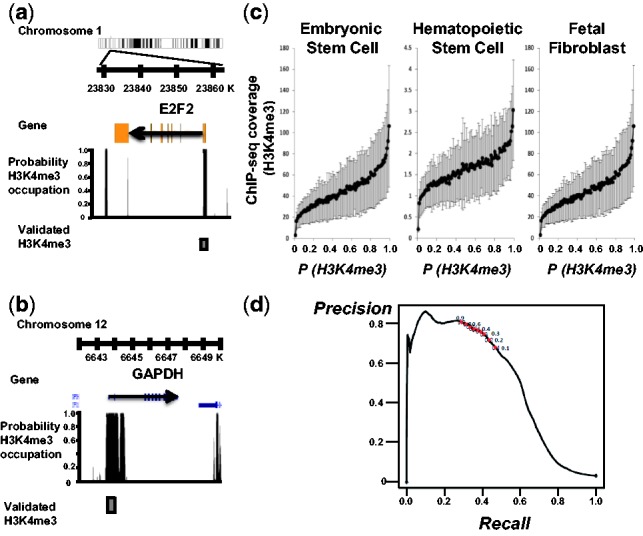
Computed probabilities of H3K4me3 occupation recapitulate in vivo occupancies of H3K4me3 across various cell types. (a and b) The 5′-end of E2F2 and GAPDH genes have been experimentally validated to have a very high level of H3K4me3 using western blot (Steward et al., 2006). Arrow indicates the direction of transcription. The level of black bar is the probability of H3K4me3 occupation at a base pair. A gray box represents the genomic region containing previously validated high-density H3K4me3 nucleosomes. (c) H3K4me3 ChIP-seq experimental occupancy is correlated with probability of H3K4me3 nucleosome occupation based on the human genome among cell types. The gray lines represent the 99% confidence interval of the mean ChIP-seq read occupancy. (d) Precision-recall analyses of P(H3K4me3 occupation). The dots mark cut-off probability of H3K4me3 occupation at 0.1–0.9 increased by 0.1
Second, we compare the probability of a base pair being covered by H3K4me3 and the number of reads covering the base pair in ChIP-seq experiments in various cell types. The probability correlates well with the in vivo occupancy of H3K4me3 at each base pair in the 2.5 × 10⁹ bp mappable genomic region, estimated from ChIP-seq data in diverse cell types, including embryonic stem cells (HESC, r = 0.83, P = 0, n = 2.5 × 10⁹ bp), fetal fibroblast cells (IMR90, r = 0.63, P = 0, n = 2.5 × 10⁹ bp), CD133 + hematopoietic stem cells (r = 0.55, P = 0, n = 2.5 × 10⁹ bp), CD36 + erythrocyte precursors (r = 0.54, P = 0, n = 2.5 × 10⁹ bp), HeLa (r = 0.52, P = 0, n = 2.5 × 10⁹ bp) and resting and activated CD4 + T helper cells (r = 0.46, P = 0, n = 2 × 10⁹ bp) (Fig. 4c). The enrichment of ChIP-seq reads provides probabilistic occupation level as well. In addition, there is possible variation in ChIP-seq experiments and differential regulation of H3K4me3 among cell types (Supplementary Fig. S3). The correlations between our predictions and the in vivo data are surprisingly high, suggesting a high accuracy of our model.
Third, we conducted precision/recall analyses to assess the efficiency of our method. The
precision level is the proportion of genomic regions occupied by H3K4me3 from the ChIP-seq
experiment among the predicted genomic regions at an occupation probability cut-off. The
recall level is the proportion of genomic regions predicted to be occupied by an H3K4me3
nucleosome among the genomic regions occupied by H3K4me3 from the ChIP-seq experiment. The
experimentally verified positive loci associated with enrichment of H3K4me3 occupation
were extracted from the H3K4me3 ChIP-seq experiment in CD4 + T cells (Poisson
process, P <  ).
With the P(H3K4me3 occupation) 0.5 cut-off, the precision level was
76% and the recall level was 37% in CD4 + T cells (Fig. 4d). As only 5% of the human genome is actually
occupied by an H3K4me3 nucleosome in CD4 + T cells, our prediction of H3K4me3
occupation efficiently enriches the true H3K4me3 occupation sites
[χ2 test, H3K4me3 occupation sites in the genome
(5%) versus H3K4me3 occupation sites among P(H3K4me3 occupation)
 0.5 (76%), P
= 0]. In view of the fact that only 1% of the genome is predicted with
P(H3K4me3 occupation)
  0.5, the enrichment of 37% true positive in P(H3K4me3 occupation)
is highly significant [χ2 test, P(H3K4me3
occupation)
  0.5 in total genome (1%) versus
P(H3K4me3 occupation)
  0.5 among true H3K4me3 occupation sites (37%),
P = 0]. The precision-recall analyses suggest that our method
efficiently predicts H3K4me3 nucleosome occupations.
3.4 The probability of H3K4me3 occupation at regulator–chromatin interaction sites
To investigate the role of the predicted H3K4me3 occupation in transcription, we studied its predicted occurrence around a transcribed region. We found a high peak of the probability of H3K4me3 occupation at the TSS and TTS of genes and at the start and end sites of exons (Fig. 5a). To study the probabilistic H3K4me3 occupation profile in higher-order chromatin–chromatin interaction, we examined the relationship between the probability of H3K4me3 occupation and protein factors regulating chromatin structure. Histone acetylases help long-range chromatin interactions between enhancer-bound TFs and the RNA Pol II complex at promoters and enhancers. Insulators are preferentially bound by CTCF and involved in gene regulation and chromatin structural changes. We calculated the read coverage from ChIP-seq of RNA Pol II to estimate the distribution of RNA Pol II on the human genome. The probability of H3K4me3 occupation is significantly correlated with binding of RNA Pol II (Fig. 5a). Using the ChIP-seq data of various histone acetylases, deacetylases and CTCF, we estimated their binding preferences by the number of reads covering a base pair. The histone acetylases included in the analyses are p300, CBP, MOF, PCAF and Tip60, and the histone deacetylases included are HDAC1, HDAC2, HDAC3 and HDAC6. We found that histone acetylases, deacetylases and CTCF preferentially interact with the genome regions showing high probability of H3K4me3 (Fig. 5a). Likewise, the in vivo levels of histone acetylations significantly correlate with the probability of H3K4me3 occupation. The significant co-localizations of various histone acetylations on the predicted H3K4me3 sites suggest that the high probability of H3K4me3 occupation represents the sequence context of histone modifications at regulatory elements. Note that p300, a well-known enhancer-binding protein (Visel et al., 2009), preferentially binds the genomic region associated with high probability of H3K4me3 occupation. These observations suggest that the sequence context encoding high probability of H3K4me3 occupation is specifically distributed across the human genome. In particular, the probability of H3K4me3 occupation is correlated with protein factors that affect chromatin structure.
Fig. 5.
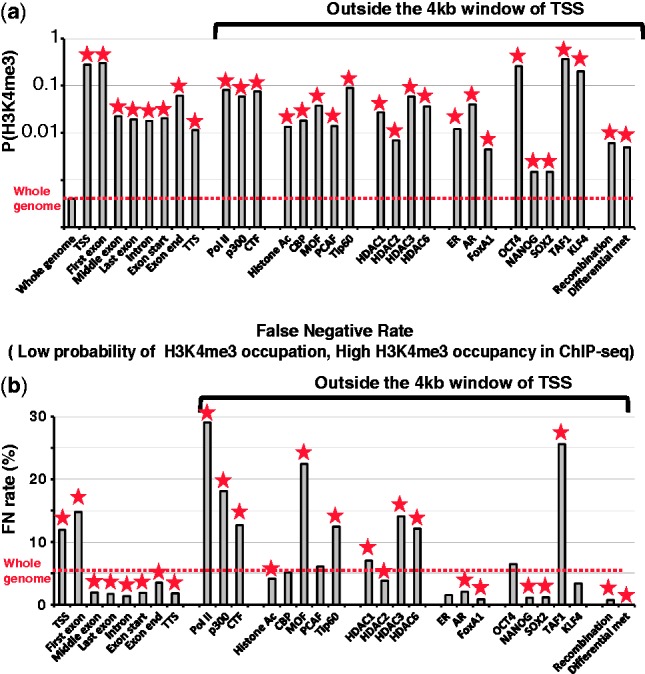
The probability of H3K4me3 occupation on regulatory elements in
the human genome. (a) The probabilities of H3K4me3 occupation on
regulatory elements in the human genome. The red dotted line represents the average
probability of H3K4me3 occupation in the whole genome. The vertical axes are in the
logarithmic scale. (b) The false negative rates at regulatory elements
represent the occupation of H3K4me3 not following the high probability of H3K4me3
occupation. Out of the sites with the probability of H3K4me3 occupation
< , the proportion of sites with the top
0.1% ChIP-seq reads in CD4 + T cells were calculated in a 200 bp window
for each regulatory element. Asterisks represent statistical significance,
P <
In general, we found many TF-binding sites associated with the high probability of H3K4me3 occupation (Supplementary Tables S1 and S2). The OCT4-, NANOG-, SOX2- and KLF4-binding sites identified by ChIP-seq in HESC (Lister et al., 2009) show high probability of the H3K4me3 occupation. These TFs are key regulators of stem cell identity and closely interact with histone modifications (Boyer et al., 2005). The results suggest that cell-type–specific TFs interact with different patterns of the probability of H3K4me3 occupation.
Finally, we estimated the proportion of H3K4me3 nucleosome occupied sites not following
the probability of H3K4me3 occupation. We calculated the false negative rates of the
probabilistic occupation map of H3K4me3 at regulatory elements (Fig. 5b). The false negative rate is the proportion of sites
showing a high occupancy level of H3K4me3 (a high number of H3K4me3 ChIP-seq reads,
Poisson distribution, P <  )
despite a very low probability of the H3K4me3 occupation [P(H3K4me3)
 0.00001]. The TSS regions and the first exons
show significantly higher false negative rates (12 and 15%) than most other
regulatory elements. This suggests that the sequence signature is not only derived from
TSS regions and the first exons but also from other genomic regions (Supplementary Fig. S3). Although Pol II-, p300- and CTCF-binding sites
contain a high probability of the H3K4me3 occupation, they still show high false negative
rates. This suggests that some H3K4me3 occupation in these regions is determined not only
by sequence context but also by epigenetic factors not explained by DNA sequence
context.
4 DISCUSSION
The different sequence preferences of H3K4me3 and H3 nucleosomes imply distinct mechanisms in their arrangement on the genome. Although the H3 nucleosome is mainly distributed by the bending property of DNA sequences (Segal et al., 2006; Vafabakhsh and Ha, 2012), the H3K4me3 nucleosome is regulated by protein factors recognizing specific sequence compositions, such as non-methylated CG-rich sequence signatures. The sequence-specific protein factors interact with histone methylase complexes specific to H3K4me3, such as Setd1. In mouse, insertion of non-methylated CpG-rich sequences leads to a high density of H3K4me3 occupation. For example, Cfp1 specifically binds to non-methylated CpG rich sequences and recruits the Setd1 complex (Thomson et al., 2010). In mouse and human, PRDM9, a meiosis-specific H3K4me3 histone methyltransferase, recognizes the target sites by the sequence specificity and deposits H3K4me3 nucleosomes at meiosis recombination hotspots (Baudat et al., 2010). Therefore, the sequence context showing high probability of H3K4me3 occupation at important regulatory elements across the genome may attract chromatin modifying factors.
We found consistent and distinct sequence specificity only for H3K4me3 but not for other histone modifications. It is possible that other histone modifications are associated with some sequence specificities that cannot be detected by the 6mer sequence preferences. Another possibility is that sequence-independent epigenetic factors regulate other histone modifications. Indeed, recently Tsai et al. (2010) showed that long non-coding RNAs guide the H3K27me3 enrichment, although the sequence specificity of the non-coding RNAs has not yet been identified.
Previously, Yuan et al. (2005) also used HMM to estimate nucleosome occupation probabilities from microarray data of nuclease-treated DNA. Their hidden state was the occupation of nucleosome, and the observations were microarray Cy3 intensities. Their emission probabilities were Cy3 intensities compared with the input DNA signal, Cy5. They characterized nucleosome location based on the consecutive eight probe intensities. On the other hand, our purpose is to compute the occupation probabilities of different types of nucleosomes from the genomic sequence alone. We first showed that the distinctive sequence specificities of H3K4me3 and H3 nucleosomes are consistent among different cell types. We then used the observed sequence specificities of H3 and H3K4me3 to predict their occupation probabilities at each mappable base pair from the genomic sequence alone. In our HMM model, the hidden state is the occupation of H3K4me3 (or H3) nucleosome at a base pair, and the observed state is the genome sequence. The emission probabilities in our model are sequence specificities of H4K4me3 (or H3). The predicted probabilities of H3K4me3 occupation are consistent with experimental data from various human cell types. Although ChIP-seq data contain noise, the probability of H3K4me3 occupying a genome region can be estimated from the sequence reads, as long as the number of reads is large enough for the statistics to be meaningful.
Our model for predicting an H3K4me3 nucleosome map from the human genome sequence is similar to Segal et al.’s model (2006) in that we assume that nucleosome formation in a genome is a dynamic process, and we calculate the nucleosome occupation probability at a locus considering all possible nucleosomes that can potentially cover the site and their forward and backward configurations in a genome. However, our model differs from theirs in at least three aspects. First, our model incorporates the specific modification status of each nucleosome and distinguishes between H3 and H3K4me3 occupations. On the other hand, Segal et al. and other studies did not distinguish between H3 and H3K4me3 nucleosomes, but considered general nucleosomes, i.e. micrococal nuclease-sensitive regions. Second, we compute the sequence compositions of DNA segments in H3 nucleosomes and in H3K4me3 nucleosomes separately, whereas Segal et al. computed the composition in extracted DNA segments in all forms of nucleosomes after treatment of micrococcal nuclease. Third, we aim to infer the probabilistic occupation level of the H3K4me3 nucleosome based on the genome sequence context, whereas Segal et al. computed the probabilistic positioning of a base pair within 147 bp nucleosomal DNAs. Our model is based on the ChIP-seq experiments. ChIP-seq enables us to infer the probable coverage of a locus but not exact positions within nucleosomes. Therefore, our model can only estimate the probabilistic occupation levels of H3K4me3 and H3 nucleosomes based on the whole-genome sequence context.
In conclusion, our results underscore a relationship between genome sequence and chromatin remodeling. In addition, sequence-independent epigenetic regulation of nucleosomes also contributes to chromatin modifications. Our analyses of the H3K4me3 sequence signature will be a valuable starting point for future studies of the genome structure. Ultimately, the computational approach may help identify epigenetic and genetic factors that regulate the chromatin structure.
ACKNOWLEDGEMENTS
The authors thank Changyeong Kim, Kyoung-Gu Woo, Jake Byrnes and Yong Woo for valuable suggestions and comments on the manuscript. M.H. appreciates supports from Kinam Kim, the former president of SAIT and current CEO of Samsung Display Corporation. M.H. conceived and designed the study, implemented and conducted the data analyses. S.H. implemented and optimized the algorithm. M.H. and W.H.L wrote the article.
Funding: National Institutes of Health (GM30998 to W.H.L.); Samsung Advanced Institute of Technology (to M.H.).
Conflict of Interest: none declared.
REFERENCES
- Barski A, et al. High-resolution profiling of histone methylations in the human genome. Cell. 2007;129:823–837. doi: 10.1016/j.cell.2007.05.009. [DOI] [PubMed] [Google Scholar]
- Baudat F, et al. PRDM9 is a major determinant of meiotic recombination hotspots in humans and mice. Science. 2010;327:836–840. doi: 10.1126/science.1183439. [DOI] [PMC free article] [PubMed] [Google Scholar]
- Berger SL. The complex language of chromatin regulation during transcription. Nature. 2007;447:407–412. doi: 10.1038/nature05915. [DOI] [PubMed] [Google Scholar]
- Boyer LA, et al. Core transcriptional regulatory circuitry in human embryonic stem cells. Cell. 2005;122:947–956. doi: 10.1016/j.cell.2005.08.020. [DOI] [PMC free article] [PubMed] [Google Scholar]
- Cui K, et al. Chromatin signatures in multipotent human hematopoietic stem cells indicate the fate of bivalent genes during differentiation. Cell Stem Cell. 2009;4:80–93. doi: 10.1016/j.stem.2008.11.011. [DOI] [PMC free article] [PubMed] [Google Scholar]
- Drew HR, Travers AA. DNA bending and its relation to nucleosome positioning. J. Mol. Biol. 1985;186:773–790. doi: 10.1016/0022-2836(85)90396-1. [DOI] [PubMed] [Google Scholar]
- Fullwood MJ, et al. An oestrogen-receptor-[agr]-bound human chromatin interactome. Nature. 2009;462:58–64. doi: 10.1038/nature08497. [DOI] [PMC free article] [PubMed] [Google Scholar]
- Ha M, et al. Coordinated histone modifications are associated with gene expression variation within and between species. Genome Res. 2011;21:590–598. doi: 10.1101/gr.116467.110. [DOI] [PMC free article] [PubMed] [Google Scholar]
- Hawkins RD, et al. Distinct epigenomic landscapes of pluripotent and lineage-committed human cells. Cell Stem Cell. 2010;6:479–491. doi: 10.1016/j.stem.2010.03.018. [DOI] [PMC free article] [PubMed] [Google Scholar]
- Jenuwein T, Allis CD. Translating the histone code. Science. 2001;293:1074–1080. doi: 10.1126/science.1063127. [DOI] [PubMed] [Google Scholar]
- Kaplan N, et al. The DNA-encoded nucleosome organization of a eukaryotic genome. Nature. 2009;458:362–366. doi: 10.1038/nature07667. [DOI] [PMC free article] [PubMed] [Google Scholar]
- Leleu M, et al. Processing and analyzing ChIP-seq data: from short reads to regulatory interactions. Brief. Funct. Genomics. 2010;9:466–476. doi: 10.1093/bfgp/elq022. [DOI] [PMC free article] [PubMed] [Google Scholar]
- Lister R, et al. Human DNA methylomes at base resolution show widespread epigenomic differences. Nature. 2009;462:315–322. doi: 10.1038/nature08514. [DOI] [PMC free article] [PubMed] [Google Scholar]
- Lupien M, et al. FoxA1 translates epigenetic signatures into enhancer-driven lineage-specific transcription. Cell. 2008;132:958–970. doi: 10.1016/j.cell.2008.01.018. [DOI] [PMC free article] [PubMed] [Google Scholar]
- Matthews AG, et al. RAG2 PHD finger couples histone H3 lysine 4 trimethylation with V(D)J recombination. Nature. 2007;450:1106–1110. doi: 10.1038/nature06431. [DOI] [PMC free article] [PubMed] [Google Scholar]
- Rabiner LR. A tutorial on hidden Markov models and selected applications in speech recognition. Proc. IEEE. 1989;77:257–286. [Google Scholar]
- Satchwell SC, et al. Sequence periodicities in chicken nucleosome core DNA. J. Mol. Biol. 1986;191:659–675. doi: 10.1016/0022-2836(86)90452-3. [DOI] [PubMed] [Google Scholar]
- Schones DE, et al. Dynamic regulation of nucleosome positioning in the human genome. Cell. 2008;132:887–898. doi: 10.1016/j.cell.2008.02.022. [DOI] [PMC free article] [PubMed] [Google Scholar]
- Segal E, et al. A genomic code for nucleosome positioning. Nature. 2006;442:772–778. doi: 10.1038/nature04979. [DOI] [PMC free article] [PubMed] [Google Scholar]
- Steward MM, et al. Molecular regulation of H3K4 trimethylation by ASH2L, a shared subunit of MLL complexes. Nat. Struct. Mol. Biol. 2006;13:852–854. doi: 10.1038/nsmb1131. [DOI] [PubMed] [Google Scholar]
- Struhl K. Naturally occurring poly(dA-dT) sequences are upstream promoter elements for constitutive transcription in yeast. Proc. Natl Acad. Sci. USA. 1985;82:8419–8423. doi: 10.1073/pnas.82.24.8419. [DOI] [PMC free article] [PubMed] [Google Scholar]
- Thomson JP, et al. CpG islands influence chromatin structure via the CpG-binding protein Cfp1. Nature. 2010;464:1082–1086. doi: 10.1038/nature08924. [DOI] [PMC free article] [PubMed] [Google Scholar]
- Tsai MC, et al. Long noncoding RNA as modular scaffold of histone modification complexes. Science. 2010;329:689–693. doi: 10.1126/science.1192002. [DOI] [PMC free article] [PubMed] [Google Scholar]
- Vafabakhsh R, Ha T. Extreme bendability of DNA less than 100 base pairs long revealed by single-molecule cyclization. Science. 2012;337:1097–1101. doi: 10.1126/science.1224139. [DOI] [PMC free article] [PubMed] [Google Scholar]
- Visel A, et al. Genomic views of distant-acting enhancers. Nature. 2009;461:199–205. doi: 10.1038/nature08451. [DOI] [PMC free article] [PubMed] [Google Scholar]
- Wang Q, et al. Androgen receptor regulates a distinct transcription program in androgen-independent prostate cancer. Cell. 2009a;138:245–256. doi: 10.1016/j.cell.2009.04.056. [DOI] [PMC free article] [PubMed] [Google Scholar]
- Wang Z, et al. Combinatorial patterns of histone acetylations and methylations in the human genome. Nat. Genet. 2008;40:897–903. doi: 10.1038/ng.154. [DOI] [PMC free article] [PubMed] [Google Scholar]
- Wang Z, et al. Genome-wide mapping of HATs and HDACs reveals distinct functions in active and inactive genes. Cell. 2009b;138:1019–1031. doi: 10.1016/j.cell.2009.06.049. [DOI] [PMC free article] [PubMed] [Google Scholar]
- Yuan GC, et al. Genome-scale identification of nucleosome positions in S. cerevisiae. Science. 2005;309:626–630. doi: 10.1126/science.1112178. [DOI] [PubMed] [Google Scholar]
- Zhang Y, et al. Intrinsic histone-DNA interactions are not the major determinant of nucleosome positions in vivo. Nat. Struct. Mol. Biol. 2009;16:847–852. doi: 10.1038/nsmb.1636. [DOI] [PMC free article] [PubMed] [Google Scholar]


