

Abstract
Objective. To study the value of the inflammatory markers (interleukin-6 (IL-6), interleukin-8 (IL-8), and C-reactive protein (CRP)) in predicting the outcome of noninvasive ventilation (NIV) in the management of acute respiratory failure (ARF) on top of chronic obstructive pulmonary disease (COPD) and the role of bacteria in the systemic inflammation. Methods. Thirty three patients were subjected to standard treatment plus NIV, and accordingly, they were classified into responders and nonresponders. Serum samples were collected for IL-6, IL-8, and CRP analysis. Sputum samples were taken for microbiological evaluation. Results. A wide spectrum of bacteria was revealed; Gram-negative and atypical bacteria were the most common (31% and 28% resp.; single or copathogen). IL-8 and dyspnea grade was significantly higher in the non-responder group (P = 0.01 and 0.023 resp.). IL-6 correlated positivity with the presence of infection and type of pathogen (P = 0.038 and 0.034 resp.). Gram-negative bacteria were associated with higher significant IL-6 in comparison between others (196.4 ± 239.1 pg/dL; P = 0.011) but insignificantly affected NIV outcome (P > 0.05). Conclusions. High systemic inflammation could predict failure of NIV. G-ve bacteria correlated with high IL-6 but did not affect the response to NIV.
1. Introduction
Chronic obstructive pulmonary disease (COPD) is a chronic, progressive disease classified as a first class health problem. It is the 4th leading cause of death for adults in the United States [1] and the 6th in Egypt [2]. It is now well-established, indeed a defining characteristic [1], that COPD is associated with airway inflammation which is fundamental to its pathogenesis [3], and numerous individual studies have demonstrated the presence of systemic inflammation in stable COPD [4]. Acute exacerbations of chronic obstructive pulmonary disease (AECOPD) describe the phenomenon of sudden worsening in airway function and respiratory symptoms in patients with COPD [5]. Acute respiratory failure (ARF) is a common and important event, which is frequently associated with severe exacerbations of COPD and considered to be as decompensated COPD [6].
Bacterial infections are implicated in the majority of AECOPD episodes. Sputum and bronchoscopy data have shown that Moraxella catarrhalis, Haemophilus influenzae, and Streptococcus pneumoniae are the most common organisms associated with AECOPD episodes. Other bacteria (e.g., Pseudomonas and Staphylococcus) have also been implicated [7]. Atypical microorganisms such as Mycoplasma pneumoniae and Chlamydia pneumoniae have been implicated in 5–10% of AECOPD cases [8].
Recently, there is abundant evidence that exacerbations also are associated with increases in both pan-airway and systemic inflammatory markers [9]. It is reasonable to assume that worsening airway inflammation is the primary inciting event of AECOPD that may be caused by bacteria, viruses, or environmental pollutants, including cigarette smoke [10]. Abundant markers reported to be higher in blood during exacerbation compared with the baseline [11]. Yet there is no clear information about how these biomarkers relate to significant clinical outcomes such as length of hospital stay, need for ICU treatment, response to treatment, and mortality [12].
The aim of the present work was to study the value of some inflammatory biomarkers (Interleukin 6 (IL-6), interleukin 8 (IL-8), and C-reactive protein (CRP)) in predicting the outcome of noninvasive ventilation (NIV) as a therapeutic modality in the management of ARF on top of COPD. In addition, it aims to find out a possible relationship between these inflammatory markers' levels on one hand and arterial blood gases derangement, the presence of infection, the type of infection, and the bacteriological load in such patients on the other hand.
2. Methods
2.1. Study Patients and Plan
The study included 33 patients attending the Respiratory Intensive Care Unit of the Chest Diseases Department, Alexandria Main University Hospital, Alexandria, Egypt. Patients included in this analysis were COPD patients as defined by the GOLD [1] without other significant respiratory diseases including asthma, tuberculosis, and bronchiectasis. All patients during enrollment in the study were in acute respiratory failure as defined by arterial blood gas criteria (PaO2 < 60 mmHg, with or without PaCO2 > 45 mmHg/pH < 7.35) during breathing room air [13]. However, any patient suffering from other confounding inflammatory diseases, such as malignancy, arthritis, connective tissue disorders, or inflammatory bowel disease, was excluded.
All the patients on admission were subjected to thorough history taking which included name, age, sex, smoking index (pack/year), exacerbation history, drug history, and symptomatology including the assessment of dyspnea using “The Modified Medical Research Council (MMRC) dyspnea scale scoring” [14], full clinical examination, recording of the vital signs, the body mass index (BMI), some laboratory investigations (including complete blood picture, serum albumin, serum electrolytes, creatinine, and blood urea nitrogen). Furthermore, plain chest X-ray and arterial blood gases (ABG) were performed on admission. Sputum samples or bronchial wash using fibreoptic bronchoscopy were obtained on admission for microbiological analysis.
After the initial evaluation of the studied group of patients, they were managed according to the international guidelines. The patients were assigned to the standard drug protocol, supplemental oxygen therapy plus NIV. NIV was delivered for all studied cohort and maintained as long as it is tolerated. The administered FiO2 was adjusted to maintain oxygen saturation values of 88–92%. In the presence of any contraindications to NIV, which are (1) respiratory or cardiac arrest, (2) medical instability (hypotensive shock, myocardial infarction requiring intervention, or uncontrolled ischemia or arrhythmias), (3) unable to protect airway, (4) unable to fit mask, and (5) uncooperative or agitated, the patient was excluded from the study. The type of NIV was bilevel positive airway pressure (BIPAP) in most cases and only a minority of the cases benefited from continuous positive airway pressure (CPAP). The starting data applied for all cases was inspiratory positive airway pressure of 12 cm H2O and increased slowly as tolerated by the patients with a maximum of 25 cm H2O, while the expiratory positive airway pressure was 3 to 6 cm H2O. In case of CPAP, the pressure applied was 10 to 12 cm H2O. Failure of NIV was defined as termination of NIV trial and initiation of invasive mechanical ventilation.
2.2. Microbiological Study
An equal volume of the sputum was mixed with sterile saline and incubated at room temperature for 15 minutes with intermittent shaking for homogenization of sputum. For the bronchial wash, no dilution was done. A semiquantitative method was used as follows.
The homogenized sputum was diluted 1 to 100 in sterile saline (by adding 10 μL from homogenized sputum to 990 μL sterile saline).
10 μL of the sample was inoculated per plate.
The inoculum was spread confluently over one half of the plate and streaked over the other half.
Plates were incubated 24 hours at 37°C. Plates inoculated included blood agar and MacConkey's agar.
Assessing the bacteriological load was carried out by counting the growth of pathogens on the plates and correlating the numbers to the volume of the sample. A count of ≥106 for sputum samples or ≥104 for bronchial lavage samples was considered significant.
Identification of the infecting pathogens was carried out according to standard microbiological procedures including Gram staining and biochemical reactions.
Antibiotic susceptibility testing was carried out on the isolated pathogens according to CLSI guidelines.
Polymerase Chain Reaction (PCR) was done on the collected sputum or bronchial lavage sample for detection of Mycoplasmapneumoniae and Chlamydia pneumonia as follows.
2.3. DNA Extraction
DNA was extracted from all samples using the GeneJET Genomic DNA Purification Kit (Fermentas, Thermo Scientific).
Briefly, samples were digested with Proteinase K in the supplied Lysis Solution. RNA was removed by treating the samples with RNAase. The lysate was then mixed with ethanol and loaded on the purification column where the DNA binds to the silica membrane. Impurities were effectively removed by washing the column with the prepared wash buffers. Genomic DNA was then eluted under low ionic strength conditions with the Elution Buffer.
(1) Amplification of Mycoplasma pneumoniae DNA Sequence (see [15]) —
PCR amplifications were carried out using 5 μL sample extracts in a total volume of 25 μL. Reactions were carried out using the ready-made master mix DreamTaq DNA Polymerase (Fermentas, Thermo Scientific) supplied in 2X DreamTaq Green Buffer (12.5 μL) containing 0.4 mM each of dATP, dCTP, dGtp, and dTTP and 4 mM MgCl2. Twenty-five picomoles of each of the primers were added, then the volume was brought up to 25 μL using nuclease free water. Positive (Mycoplasma DNA) and negative controls (water) were run concurrently with each run.
The two oligonucleotide primers flank a region 280 base pairs (bp) of the genome and have a sequence of 5′ GGG AGC AAA CAG GAT TAG ATA CCC T 3′ 5′ TGC ACC ATC TGT CAC TCT GTT AAC CTC 3′.
After an initial denaturation step at 94°C for 3 min, forty cycles were carried out under the following conditions: denaturation at 94°C for 45 sec, annealing at 55°C for 1 min, and extension at 72°C for 2 min. An additional step of extension at 72°C for 10 min was performed at the end of the 40 cycles. A second amplification of the PCR products was done using 5 μL of the first amplification products as a PCR target and proceeding with the same PCR conditions. Because of high sensitivity of the PCR reaction used, stringent precautions were taken to avoid the risk of false-positive results.
Amplifications were carried out in a Techne Progene thermal cycler.
(2) Amplification of Chlamydia pneumoniae DNA Sequence (see [16]) —
PCR amplifications were carried out using 5 μL sample extracts in a total volume of 25 μL. Reactions were carried out using the ready-made master mix DreamTaq DNA Polymerase (Fermentas, Thermo Scientific) supplied in 2X DreamTaq Green Buffer (12.5 μL) containing 0.4 mM each of dATP, dCTP, dGTP, and dTTP and 4 mM MgCl2. Fifteen picomoles of each of the primers were added, and the reaction volume was brought up to 25 μL using nuclease-free water. Positive (Chlamydia DNA) and negative controls (water) were run concurrently with each run.
The two oligonucleotide primers flanking a region 474 base pairs (bp) of the Chlamydia pneumoniae gene had a sequence of HM-1: 5′ GTG TCA TTC GCC AAG GTT AA 3′ HR-1: 5′ TGC ATA ACC TAC GGT GTG GTT 3′.
Amplifications were carried out in a Techne Progene thermal cycler. After an initial denaturation step at 95°C for 5 min, forty cycles were carried out under the following conditions: denaturation at 94°C for 1 min, annealing at 48°C for 1 min, and extension at 72°C for 1 min. An additional step of extension at 72°C for 10 min was performed at the end of the 40 cycles. A second amplification of the PCR products was done using 5 μL of the first amplification products as a PCR target and proceeding with the same PCR conditions. Because of high sensitivity of the PCR reaction used, stringent precautions were taken to avoid the risk of false-positive results.
(3) Detection of the Amplified Products (see [15]) —
Ten μL of the reaction mixture were electrophoresed in 1% agarose gel in 0.09 M Tris-borate, pH 8.0, and 2 mM Na2EDTA (TBE) buffer with 100 bp molecular weight markers (Promega). Electrophoresis was carried out at 80 volts for 25 minutes. DNA fragments (280 bp for Mycoplasma pneumoniae and 474 bp for Chlamydia pneumoniae were visualized by ethidium bromide staining against an ultraviolet transilluminator.
2.4. Serum Samples and Analysis of the Inflammatory Markers
Serum samples were obtained on admission were preserved in −80°C till the end of the study period. The collected samples were analyzed for IL-6, IL-8, and CRP. The IL-6 and IL-8 were measured in serum samples by ELISA kit (AviBion human IL-6 and IL-8 and code number IL06001 and IL08001, respectively, Finland) according to the manufacturers' directions.
An IL-6/IL-8 monoclonal coating antibody was adsorbed onto microwells.
IL-6/IL-8 present in the sample or standard bound to antibodies adsorbed to the microwells; a biotin conjugated polyclonal IL-6/IL-8 antibody was added and bound to IL-6/IL-8 captured by the first antibody.
Following incubation, unbound biotin conjugate was removed during a wash step. HRP-Streptavidin solution was added and binds to the biotin conjugated anti-IL-6/anti-IL-8. HRP-Streptavidin solution was removed during a wash step, and TMB One-Step Substrate reagent was added to each well.
A colored product is formed in proportion to the amount of IL-6/IL-8 present in the sample. The reaction was terminated by addition of acid and absorbance (stop solution “2 N H2SO4”). The test was measured at 450 nm within 15 minutes. A standard curve was prepared from the eight IL-6/IL-8 standard dilutions. The standard curve points were 500, 250, 125, 62.5, 31.25, 15.62, and 0 pg/mL. Both IL-6/IL-8 sample concentrations were determined by plotting against the standard curve.
CRP was measured in serum samples by CRP-ultrasensitive (MICRO CRP/ULTRA CRP, Vital Diagnostics, Italy). This kit utilizes quantitative turbidimetric latex technique.
2.5. Statistical Analysis
Statistical analysis was carried out using Microsoft Excel and Statistical Package for Social Sciences (SPSS version 11, Chicago, IL, USA). Data are presented as means ± standard deviation (SD) and range. Categorical variables were described using frequencies and percentages. All statistical tests, unless otherwise stated, were employed. Kruskal-Wallis' test was used to compare the three independent groups for abnormally distributed data; Mann-Whitney's test was used to compare two independent groups for abnormally distributed data; the Monte-Carlo's test was used for testing associations; Spearman's rank correlations were used as well. The use of the inflammatory biomarkers (IL-6, CRP, and IL-8) in assessing the response to NIV was evaluated using a receiver operating characteristic (ROC) curve analysis. The area under the ROC curve (AUC) is a measure of how well each of IL-6, CRP, and IL-8 can distinguish between the two groups. In an ROC curve, the true positive rate (sensitivity) is plotted in function of the false-positive rate (100-specificity) for different cutoff points of each of IL-6, CRP, and IL-8. Each point on the ROC curve represents a sensitivity/specificity pair corresponding to a particular decision threshold. A test with perfect discrimination (no overlap in the two distributions) has an ROC curve that passes through the upper left corner (100% sensitivity, 100% specificity). Therefore, the closer the ROC curve is to the upper left corner, the higher the overall accuracy of the test. Statistical significance was accepted as P ≤ 0.05. All applied statistical tests of significance were two sided.
3. Results
3.1. Baseline Patient Characteristics
Baseline clinical characteristics of the 33 patients included in the present study are reported in Table 1.
Table 1.
Baseline clinical characteristics of the patients.
| Baseline characteristics | Cases | Percentage (%) |
|---|---|---|
| Age (years) | ||
| Mean ± SD (range) | 56.61 ± 7.87 (45–81) | |
| Gender | ||
| Male/female | 26/7 | (79%)/(21%) |
| Smoking status | ||
| Current smokers | 11 | (33%) |
| Ex-smokers | 15 | (46%) |
| Passive smokers | 7 | (21%) |
| Smoking index (p/yr) | ||
| Mean ± SD (range) | 40.25 ± 23 (10–120) | |
| BMI (kg/m2) | ||
| Mean ± SD (Range) | 28.8 ± 8 (12.7–42) | |
| Presence of comorbidities | 18 | (54%) |
| Hypertension | 13 | (37%) |
| Diabetes mellitus | 7 | (21%) |
| Others | 6 | (17%) |
| Ischemic heart disease | 3 | (9.1%) |
| History of deep vein thrombosis | 2 | (6.1%) |
| Liver cirrhosis | 1 | (3%) |
| Sleep apnea syndrome (OSA) | 10 | (30.3%) |
| History of exacerbation | ||
| Less than or 3 times/year | 11 | (33%) |
| Previous mechanical ventilation | 3 | (9%) |
| More than 3 times/year | 22 | (67%) |
| Previous mechanical ventilation | 6 | (18%) |
OSA: obstructive sleep apnea, p/yr: pack/year.
According to the response to the NIV, the patients were classified into responders (25 patients (75.8%)) and non-responders (8 patients (24.2%)). From the responder group, four patients died (12%). Equally, four patients (12%) died from the non-responder group. The comparison between both groups on admission was demonstrated in Table 2. There was a statistically significant difference between the responder and non-responder groups regarding dyspnea grade (2.4 ± 0.87 (range = 1–4) versus 3.4 ± 0.92 (range = 2–4)) (P = 0.023). However, there was no significant difference between the two groups regarding the age, BMI, smoking index, smoking status, the infection with Gram-negative bacteria, laboratory investigations, and FEV1 percentage predicted (P > 0.05). Furthermore, there was neither statistical difference between the remaining laboratory investigations nor between the ABG parameters, the vital signs.
Table 2.
Comparison between different parameters among the responder and non-responder groups measured on admission.
| Responders (N = 25 cases) | Nonresponders (N = 8 cases) | Significance (P) | |
|---|---|---|---|
| Age (yrs) | 56.64 ± 8.18 (45–81) | 56.5 ± 7.29 (45–65) | 0.359 (0.719) |
| BMI (kg/m2) | 27.7 ± 7.62 (16.6–44.1) | 28 ± 9.2 (12.7–40.8) | 0.231 (0.817) |
| Dyspnea (MMRC) | 2.4 ± 0.87 (1–4) | 3.4 ± 0.92 (2–4) | 2.277 (0.023) ∗ |
| Current smoker (N (%)) | 8 (32%) | 2 (25%) | FE P = 1.0 |
| Infection with Gram-negative, yes/no (%) | 5/22 (22.7%) | 4/7 (57%) | FE P = 0.158 |
| FEV1 percentage predicted | 36.7 ± 17.1% (20.1–99.4) | 35.1% (22.8–48.5) | 1.638 (0.101) |
| Laboratory investigations | |||
| Total WBC (103/μL) | 11.3 ± 7.5 (4.1–37.5) | 13.4 ± 5.4 (7.44–21.51) | 1.47 (0.141) |
| Na (mmol/L) | 138.3 ± 3.7 (131–146) | 134.8 ± 10.5 (114–151) | 1.182 (0.237) |
| K (mmol/L) | 4.4 ± 0.6 (3.5–5.8) | 4.1 ± 0.6 (3.5–5.1) | 0.822 (0.411) |
| BUN (mg/dL) | 25.4 ± 15.9 (9–73) | 34.1 ± 13.9 (13–54) | 1.704 (0.088) |
| Cr (mg/dL) | 0.9 ± 0.5 (0.4–3) | 1.4 ± 0.7 (0.6–2.6) | 1.904 (0.057) |
| Serum albumin (g/dL) | 3.0 ± 0.5 (2.1–4) | 2.7 ± 0.3 (2.4–3.2) | 1.682 (0.093) |
| ABG | |||
| pH | 7.31 ± 0.06 (7.21–7.45) | 7.34 ± 0.08 (7.23–7.451) | 0.742 (0.458) |
| PCO2 (mmHg) | 67.2 ± 16 (38.6–106) | 68.3 ± 27.8 (23.6–103) | 0.653 (0.514) |
| PO2 (mmHg) | 48. 8 ± 14.2 (25–80) | 42.4 ± 4.4 (35.1–48) | 1.088 (0.277) |
| Vital signs | |||
| HR | 100 ± 11 | 103 ± 26 | −0.167 (0.865) |
| SBP | 141 ± 27 | 135 ± 22 | −0.466 (0.641) |
| RR | 29 ± 4 | 32 ± 7 | −1.078 (0.281) |
Yrs: years, MMRC: the Modified Medical Research Council, FEV1: forced expiratory volume in 1 second, WBC: white blood count, Na: sodium, K: potassium, BUN: blood urea nitrogen, Cr: creatinine, ABG: arterial blood gases, SBP: systolic blood pressure, RR: respiratory rate, HR: heart rate, pk/yr: pack/year, PaO2 (mmHg): partial arterial pressure of oxygen, PaCO2 (mmHg): partial arterial pressure of carbon dioxide, N: number of cases,∗significant if P ≤ 0.05, FE P = Fisher's exact test.
3.1.1. The Microbiological Analysis
A wide spectrum of bacteria was revealed from examination of the sputum samples (Figure 1). From the studied cases, 4 patients (12% of the total number of studied patients “33”) were not able to give up sputum even after induction. Bronchoscopic lavage was performed for 4 patients (12%): 3 patients (9%) were on invasive mechanical ventilation after early failure of NIV and the one patient (3%) was from the responder group of NIV. A Gram-positive bacterium, Staphylococcus aureus, was detected in one sputum sample (3%). Gram-negative bacteria were detected in 8 sputum samples (28%): they were Klebsiella species in 3 (10%), Pseudomonas in 2 (7%), and Acinetobacter in 3 (10%). Fungal infection, that is, Candida species, was detected in 2 (7%).
Figure 1.
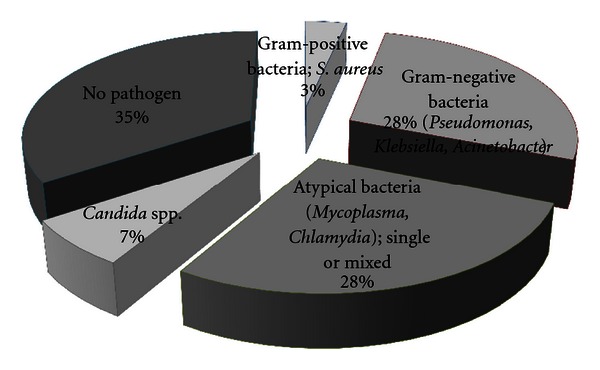
The bacteriological profile of the studied cases.
Atypical pathogens were positive, using PCR amplification of the sputum samples, in 8 patients (28%). On one hand, five samples (17%) showed single atypical organism infection either Mycoplasma pneumoniae (in 4 samples (14%)) or Chlamydia pneumoniae (in one (3%)). On the other hand, mixed infections were detected in 3 samples (10%), that is, M. pneumoniae with others (Gram-negative bacterium in one sample or Gram-positive bacterium in 2 samples). However, no pathogen was detected in 35% of the studied samples.
The Gram-negative bacteria were more prevalent among the non-responder group (57%) versus 22.7% among the responder group, and no evidence of infection was more frequent among the responder group (36.4%) versus 28.6% among non-responder group. However, the type of bacteria did not affect the response to NIV (P = 0.148).
3.1.2. The Serum Inflammatory Markers
A comparison between the responder and non-responder groups is demonstrated in Table 3 regarding the biomarkers. The mean value of the IL-8 on admission was 43.7 pg/dL (±79.2) versus 171.9 pg/dL (±134.3) among the responders and non-responders, respectively. There was a statistically significant difference when comparing both groups (P = 0.01). No similar significance was reported regarding the IL-6 or CRP when comparing both groups.
Table 3.
Comparison between the levels of studied biomarkers according to the response to NIV.
| Biomarkers | Response to NIV | Significance (P) | |
|---|---|---|---|
| Responder | Non-responder | ||
| IL-6 (pg/dL) | 31.5 ± 75.6 | 214.4 ± 275.1 | z = 1.59 (0.11) |
| IL-8 (pg/dL) | 43.7 ± 79.2 | 171.9 ± 134.3 | z = 2.563 (0.01) ∗ |
| CRP (mg/L) | 2.8 ± 1.1 | 2.9 ± 0.9 | z = 0.611 (0.541) |
IL-6: interleukin 6, IL-8: interleukin 8, CRP: C-reactive protein, NIV: noninvasive ventilation, ∗significant at P ≤ 0.05 between the responders and nonresponders.
With further analysis by the ROC (Figure 2), the best performing biomarker using the AUC was the IL-8 (AUC = 0.801). The best cutoff point for IL-8 regarding the “non-response” to NIV was >29.5 pg/dL; it has a sensitivity of 75% and a specificity of 80%. While that for IL-6 was >75.8 pg/dL with sensitivity of 50% and a specificity of 96% (AUC = 0.688). Regarding the CRP, the cutoff point was >2.95 mg/L, with a sensitivity of 62.5% and a specificity of 56% (AUC = 0.573). Accordingly, the cutoff point for both IL-6 and CRP had a low sensitivity which is prohibiting their use for prediction of NIV failure.
Figure 2.
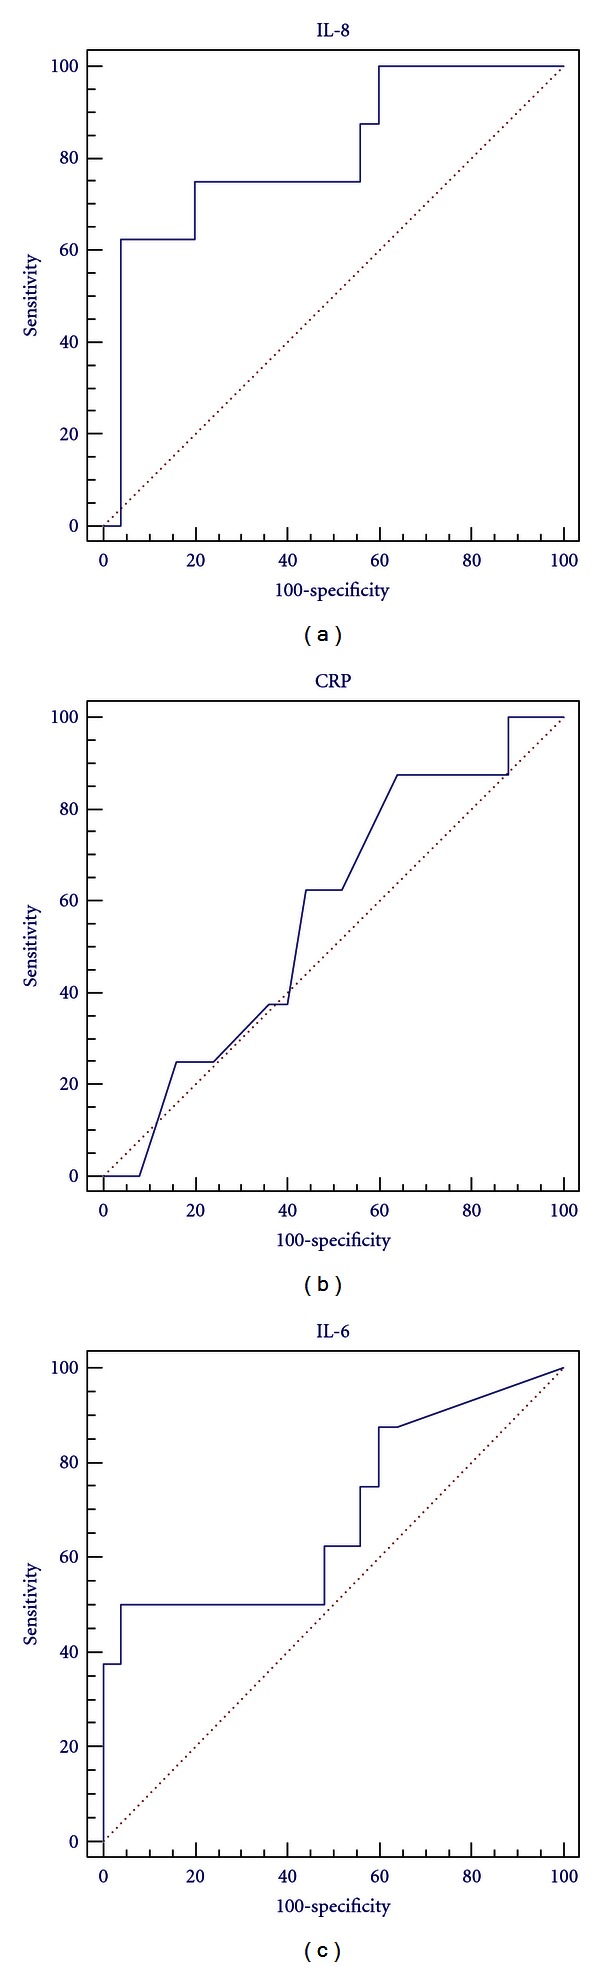
Receiver operating characteristic (ROC) curve for IL-6 on admission for the non-response to NIV (AUC = 0.688), ROC curve for IL-8 (AUC = 0.801), and ROC curve for CRP (AUC = 0.573).
3.2. Correlations
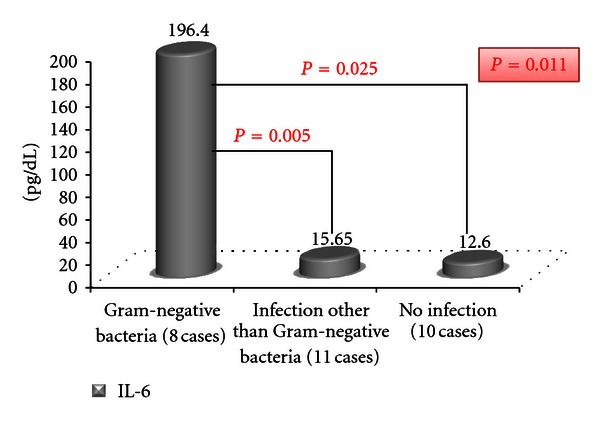
On admission, there was a statistically positive significant correlation between the IL-6 and the presence of infection regardless of its type (P = 0.038) (Figure 3). Furthermore, a statistically significant association between the level of IL-6 and the type of infection was present (P = 0.034) (Table 4). However, neither IL-8 nor CRP had a statistically significant difference when correlating either the presence of infection or the type of infection (P > 0.05). On classification of the pathogens into three groups, there was a significant difference between the readings of the IL-6 among the patients who were infected with Gram-negative bacteria and those who had no infection as well as those who were infected by pathogens other than Gram-negative bacteria (Figure 4).
Figure 3.
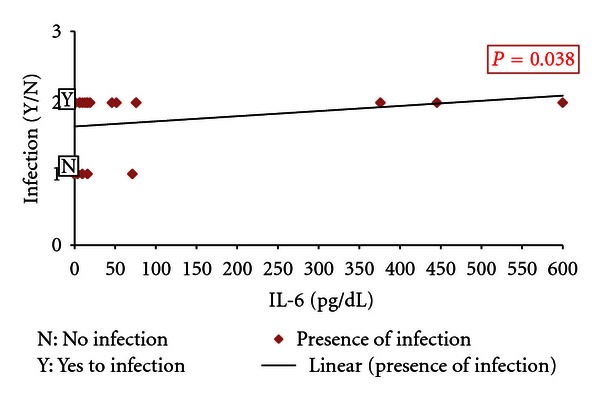
Correlation between the level of IL-6 on admission and the presence of infection.
Table 4.
Comparison between the levels of the studied biomarkers and the type of infection on admission.
| Biomarker | Infection | Significance | |||||
|---|---|---|---|---|---|---|---|
| Gram-negative bacteria (8 cases) |
Gram-positive bacteria (1 case) |
Fungal (2 cases) |
Atypical infection (5 cases) |
Mixed (mycoplasma and others) (3 cases) |
No infection (10 cases) |
||
| IL-6 (pg/dL) | 196.4 ± 239.1 | 12.8 | 35.4 ± 22.91 | 17.72 ± 32.57 | 5.2 ± 5.2 | 10.67 ± 21.94 | χ 2 = 12.03 |
| P = 0.034* | |||||||
| IL-8 (pg/dL) | 96.96 ± 118.32 | 11.8 | 18.75 ± 14.78 | 39.1 ± 52.88 | 43.87 ± 43.87 | 87.53 ± 134.54 | χ 2 = 0.839 |
| P = 0.975 | |||||||
| CRP (mg/L) | 2.84 ± 1.11 | 3.4 | 2.85 ± 0.78 | 3.04 ± 0.78 | 2.83 ± 2.83 | 2.55 ± 1.11 | χ 2 = 1.54 |
| P = 0.908 | |||||||
Figure 4.
Comparison between the levels of IL-6 among the cases in relation to type of infection.
Nonetheless, there was no significant correlation between the studied biomarkers on admission and dyspnea scale, BMI, FEV1% predicted, ABG parameters, the comorbidities or bacteriological load (P > 0.05).
4. Discussion
ARF on top of AECOPD represent a life-threatening condition. NIV should be used whenever possible as it has been shown to be an effective treatment for respiratory failure during AECOPD [17]. According to the present results, 75.8% succeeded the trial of NIV while 24.2% failed. Nearby results were recorded by Putinati et al. [18], as they reported a success among 77% and failureamong 23% of their patients episodes of respiratory failure. Also, Aburto et al. [19] had 75.3% of their patients received NIV successfully and 11.6% failed the NIV and were subjected for invasive mechanical ventilation. Other older studies also reported a range of failure of NIV between 7% and 24% [20–22].
The causes of failure of NIV among the non-responder group were mainly incoordination and deterioration of the consciousness. Ambrosino et al. [23] and Carlucci et al. [24] found that poor clinical tolerance of NIV was highly predictive of NIV failure. Soo Hoo et. al., [25] observed that patients successfully treated with NIV were able to tolerate the mask longer than patients who failed NPPV. Other causes associated with failure of NIV in the present study were worsening of the ABG and starting hemodynamic instability which was unresponsiveness to fluid therapy.
Neither the ABG parameters nor the vital signs had a statistically significant difference between the responder and non-responder groups (P > 0.05). Accordingly, these parameters failed to predict the failure or success of NIV in the present work which were of significance in other studies [20, 23, 24, 26, 27].
The dyspnea grade as measured by MMRC was significantly higher in the non-responder group than the responder group. None of the other compared parameters showed any significance when comparing both groups. Moretti et al. [28] found no significant difference between the failure and success groups regarding the albumin, the electrolytes, the pulmonary function, and the presence of community acquired pneumonia. However, there was a statistically significant difference between the groups regarding the presence of comorbidities and “activity of daily living score” on admission which reflects the clinical severity of the disease. A recent report found that dyspnea may better reflect the complex functional and psychological impact of the disease rather than the lung function measurements [29]. Accordingly, high dyspnea grade indicates more severe clinical condition which could precipitate NIV failure in the present study.
The percentage of Gram-negative infection was higher among the non-responder group than the responder one (57% versus 22.7%) despite being statistically insignificant. Ferrer et al. [30] found that airway colonization by nonfermenting Gram-negative bacilli is strongly associated with NIV failure. The insignificant difference in the current study could be attributed to the small number of the non-responder group in comparison to the responder group.
The overall hospital mortality was 24% in the present study, which is within the range of values reported by Baldwin and Allen [31] for NIV (6–25%). Furthermore, the hospital mortality rates were similar in both groups (responders and non-responders; each 12%) which was similar to that reported by Conti et al. [32] and Squadrone et al. [33]. Worthwhile of noting, NIV is not a therapy, but it is a form of life support until the cause underlying the acute respiratory failure is reversed with medical therapy [34].
Interestingly, in the present study, there was a statistically significant difference between the responder and non-responder groups regarding the IL-8 with higher levels among the non-responders. However, neither CRP nor IL-6 had similar results when comparing both groups. In the literature, inflammation at AECOPD becomes more marked with recruitment of neutrophils and eosinophils, the major components of the inflammatory response [35, 36], and increased CD4+ lymphocytes in the bronchial mucosa [37, 38]. This is associated with increased markers of airway neutrophilic inflammation (myeloperoxidase, IL-8, IL-6, and TNF-α) at the time of acute exacerbation [39, 40]. In contrast to stable disease, exacerbations appear to be associated with a direct correlation between the degree of airway inflammation and the magnitude of the systemic acute-phase response which supports the hypothesis of “spilling over” [9].
IL-8 is a potent neutrophil chemokine and activator, which can induce the migration of neutrophils to the airway and promote neutrophils' degranulation [40]. Qiu et al.'s [41] study of patients with COPD exacerbations has shown an upregulation of gene expression for IL-8 and epithelial-derived neutrophil attractant-78 in intubated patients with severe exacerbations. Elevated serum IL-8 in the present study could be a mirror of severe airway inflammation in severe AECOPD irrespective to the cause of the ARF. The best working cutoff point for IL-8 was 29.5 pg/dL as above this value the sensitivity for non-responding to NIV trial is supposed to be 75% with acceptable specificity (80%). Serum IL-6, CRP, and the total WBC were higher among the non-responder group despite being insignificant. Bathoorn et al. [42] reported increased systemic inflammation as demonstrated by increased number of blood total leukocytes, IL-6, and a trend in CRP during exacerbations. Accordingly, high systemic inflammation was associated with NIV failure which in turn reflects accentuated airway inflammation.
According to previously published data, about 50–70% of exacerbations are due to respiratory infections [43]. Commonly isolated organisms include H. influenzae, S. pneumoniae, M. catarrhalis, H. parainfluenzae and P. aeruginosa, with other Gram-negative bacteria occurring more rarely [44]. In the present study, the bacteriological profile showed a wide spectrum of infective pathogens. Respiratory infections were the cause of exacerbation in 66% of the studied samples. The Gram-negative bacteria constituted the most common causes of AECOPD either single or mixed (31% of infection). Similarly, Miravitlles et al. [45], Eller et al. [46], and Bogaert et al. [47], utilizing sputum cultures, demonstrated an increasing frequency of isolation of Pseudomonas spp and other Gram-negative bacilli in AECOPD. Soler et al. [48] also found a high incidence of Pseudomonas aeruginosa and other Gram-negative bacilli (28%) among their patients presenting with AECOPD. Accordingly, infections with Pseudomonas spp and Gram-negative bacteria occur in more severe exacerbations mostly, affecting the most debilitated patients. Another recent study by Li et al. [49] found that only 47% of theCOPD-exacerbationpatients had a positive sputum culture. They reported Gram-negative bacteria to be the most prevalent in their cohort. The high incidence of Gram-negatives could be related to antibiotic selection pressure, exposure to hospital flora, or the degree of host immune compromise [50].
Another observation in the present work was the incidence of atypical infection which was higher than the literature (28% either single or copathogen). Moreover, the Mycoplasma pneumonia was more frequent than Chlamydia pneumonia (25% versus 3%).
Meloni et al. [8] found that C. pneumoniae infection was reported in 8.9% of AECOPD patients and acute M. pneumoniae infection was found in 6.7% of the AECOPD. Lieberman et al. [51] and Papaetis et al. [52] found M. pneumoniae to be the cause of AECOPD in 14% and 9%, respectively. Otherwise, C. pneumoniae has been reported to cause 4–16% of AECOPD [53, 54]. The difference between these results and ours is because former studies were based almost solely on serological evidence, while the present study relied on detection of the organisms in sputum samples using PCR technique. PCR is considered to be the preferred diagnostic procedure for the diagnosis of M. pneumoniae infections [55]. Additionally, the high atypical bacterial infection in the studied cohort could reflect the high prevalence of this bacterial group in the community.
It was reported that the prevalence of atypical bacteria in Africa as a cause of lower respiratory tract infection is 20% [56]. Lui et al. [57] also found that atypical bacteria constituted 28.6% of the causal organisms of CAP where M. pneumonia and C. pneumoniae, as single or copathogens, were the commonest. Seemungal et al. [58] and Blasi et al. [59] found that 28% and 38%, respectively, of their patients had C. pneumoniae DNA PCR positive in their sputum during the AECOPD. But both Diederen et al. [60] and Varma-Basil et al. [61] found that all samples collected from AECOPD were negative for M. pneumoniae and C. pneumoniae DNA. The difference in the results between the present study and others may be due to a number of reasons, including differences in PCR techniques used [62, 63] and the differences in study plan and subjects.
There was a statistically significant correlation between the serum IL-6 and the type of bacteria. Furthermore, the positive significance was related to presence of Gram-negative bacteria rather than other types. Accordingly, the Gram-negative bacteria were associated with higher systemic inflammation. This could be explained on the basis of the endotoxins especially the lipopolysaccharides (LPS) which constitute the major cell wall component in all Gram-negative bacteria [64]. LPS initiates downstream intracellular signaling pathways that ultimately result in the activation of the nuclear transcription factor, nuclear factor κB [65], which in turn stimulates the transcription of genes coding for proinflammatory cytokines such as tumor necrosis factor-α and interleukin-1β which appear early in the circulation followed by IL-6 appearance within 2 hours [66]. Khair et al. [67] found that cultures of bronchial epithelial cells showed increased IL-6 production in response to Haemophilus influenzae endotoxin. Hence, increased serum IL-6 in accordance with Gram-negative infection is not surprising due to associated endotoxin.
5. Conclusions
Neither ABG nor vital signs were predictors of NIV failure. High serum IL-8 as a marker of systemic inflammation and poor baseline functional state (expressed by higher dyspnea grade) could predict failure of NIV. The presence of infection accentuates the systemic inflammation accompanied the ARF on top of AECOPD which was expressed by elevation of IL-6. Atypical and Gram-negative bacteria constitute the most common pathogens of AECOPD. Moreover, Gram-negative bacteria correlated with high IL-6 but did not affect the response to NIV.
Conflict of Interests
The authors declare that they have no conflict of interest.
Abbreviations
- COPD:
Chronic obstructive pulmonary disease
- AECOPD:
Acute exacerbations of chronic obstructive pulmonary disease
- ARF:
Acute respiratory failure
- NIV:
Noninvasive ventilation
- IL-6:
Interleukin 6
- IL-8:
Interleukin 8
- CRP:
C-reactive protein
- GOLD:
The Global Initiative for Chronic Obstructive Lung Disease
- MMRC:
The Modified Medical Research Council
- BMI:
Body mass index
- ABG:
Arterial blood gases
- FiO2:
Fraction of inspired oxygen
- BIPAP:
Bilevel positive airway pressure
- CPAP:
Continuous positive airway pressure
- PCR:
Polymerase chain reaction
- bp:
base pairs
- SD:
Standard deviation
- ROC:
Receiver Operating characteristic curve
- AUC:
The area under the ROC curve
- OSA:
Obstructive sleep apnea
- p/yr:
Pack/year
- FEV1:
Forced expiratory volume in 1 second
- yrs:
years
- WBC:
White blood count
- Na:
Sodium
- K:
Potassium
- BUN:
Blood urea nitrogen
- Cr:
Creatinine
- SBP:
Systolic blood pressure
- RR:
Respiratory rate
- HR:
Heart rate
- PaO2 (mmHg):
Partial arterial pressure of oxygen
- PaCO2 (mmHg):
Partial arterial pressure of carbon dioxide
- N:
Number of cases
- LPS:
lipopolysaccharides.
References
- 1.NHLBI/WHO Global Initiative for Chronic Obstructive Lung Disease (GOLD) Global strategy for the diagnosis, management and prevention of chronic obstructive lung disease. 2009, http://www.goldcopd.org/
- 2.Death and DALY estimates by cause. 2002, http://www.who.int/entity/healthinfo/statistics/bodgbddeathdalyestimates.xls.
- 3.Di Stefano A, Caramori G, Ricciardolo FLM, Capelli A, Adcock IM, Donner CF. Cellular and molecular mechanisms in chronic obstructive pulmonary disease: an overview. Clinical and Experimental Allergy. 2004;34(8):1156–1167. doi: 10.1111/j.1365-2222.2004.02030.x. [DOI] [PubMed] [Google Scholar]
- 4.Gan WQ, Man SFP, Senthilselvan A, Sin DD. Association between chronic obstructive pulmonary disease and systemic inflammation: a systematic review and a meta-analysis. Thorax. 2004;59(7):574–580. doi: 10.1136/thx.2003.019588. [DOI] [PMC free article] [PubMed] [Google Scholar]
- 5.Celli BR, Macnee W. ATS/ERS Task ForceStandards for the diagnosis and treatment of patients with COPD: a summary of the ATS/ERS position paper. European Respiratory Journal. 2004;23:932–946. doi: 10.1183/09031936.04.00014304. [DOI] [PubMed] [Google Scholar]
- 6.Calverley PMA. Respiratory failure in chronic obstructive pulmonary disease. European Respiratory Journal, Supplement. 2003;22(47):26S–30S. doi: 10.1183/09031936.03.00030103. [DOI] [PubMed] [Google Scholar]
- 7.Lieberman D, Lieberman D, Ben-Yaakov M, et al. Infectious etiologies in acute exacerbation of COPD. Diagnostic Microbiology and Infectious Disease. 2001;40(3):95–102. doi: 10.1016/s0732-8893(01)00255-3. [DOI] [PubMed] [Google Scholar]
- 8.Meloni F, Paschetto E, Mangiarotti P, et al. Acute Chlamydia pneumoniae and Mycoplasma pneumoniae infections in community-acquired pneumonia and exacerbations of COPD or asthma: therapeutic considerations. Journal of Chemotherapy. 2004;16(1):70–76. doi: 10.1179/joc.2004.16.1.70. [DOI] [PubMed] [Google Scholar]
- 9.Hurst JR, Perera WR, Wilkinson TMA, Donaldson GC, Wedzicha JA. Systemic and upper and lower airway inflammation at exacerbation of chronic obstructive pulmonary disease. American Journal of Respiratory and Critical Care Medicine. 2006;173(1):71–78. doi: 10.1164/rccm.200505-704OC. [DOI] [PubMed] [Google Scholar]
- 10.O’Donnell DE, Parker CM. COPD exacerbations · 3: pathophysiology. Thorax. 2006;61(4):354–361. doi: 10.1136/thx.2005.041830. [DOI] [PMC free article] [PubMed] [Google Scholar]
- 11.Wouters EFM, Groenewegen KH, Dentener MA, Vernooy JHJ. Systemic inflammation in chronic obstructive pulmonary disease: the role of exacerbations. Proceedings of the American Thoracic Society. 2007;4(8):626–634. doi: 10.1513/pats.200706-071TH. [DOI] [PubMed] [Google Scholar]
- 12.Franciosi LG, Page CP, Celli BR, et al. Markers of exacerbation severity in chronic obstructive pulmonary disease. Respiratory Research. 2006;7, article 74 doi: 10.1186/1465-9921-7-74. [DOI] [PMC free article] [PubMed] [Google Scholar]
- 13.Weiss SM, Hudson LD. Outcome from respiratory failure. Critical Care Clinics. 1994;10(1):197–215. [PubMed] [Google Scholar]
- 14.Mahler DA, Wells CK. Evaluation of clinical methods for rating dyspnea. Chest. 1988;93(3):580–586. doi: 10.1378/chest.93.3.580. [DOI] [PubMed] [Google Scholar]
- 15.Bedewy KML, Elsayed MNE, Mahmoud MI. Ventilator-associated pneumonia: serum TNF∞ and determination of the role of some atypical bacterial pathogens by PCR. Egyptian Journal of Medical Microbiology. 2001;10(1):27–42. [Google Scholar]
- 16.Bedewy KML, Ibrahim YN, Abdelfattah MA. Serum RANTES and TNF∞ levels in patients with acute coronary events: correlation with Chlamydia pneumoniaeinfection. Egyptian Journal of Medical Microbiology. 2003;12:33–46. [Google Scholar]
- 17.Lightowler JV, Wedzicha JA, Elliott MW, Ram FSF. Non-invasive positive pressure ventilation to treat respiratory failure resulting from exacerbations of chronic obstructive pulmonary disease: cochrane systematic review and meta-analysis. British Medical Journal. 2003;326(7382):185–187. doi: 10.1136/bmj.326.7382.185. [DOI] [PMC free article] [PubMed] [Google Scholar]
- 18.Putinati S, Ballerin L, Piattella M, Panella GL, Potena A. Is it possible to predict the success of non-invasive positive pressure ventilation in acute respiratory failure due to COPD? Respiratory Medicine. 2000;94(10):997–1001. doi: 10.1053/rmed.2000.0883. [DOI] [PubMed] [Google Scholar]
- 19.Aburto M, Esteban C, Moraza FJ, Aguirre U, Egurrola M, Capelastegui A. COPD exacerbation: mortality prognosis factors in a respiratory care unit. Archivos de Bronconeumologia. 2011;47(2):79–84. doi: 10.1016/j.arbres.2010.10.012. [DOI] [PubMed] [Google Scholar]
- 20.Brochard L, Mancebo J, Wysocki M, et al. Noninvasive ventilation for acute exacerbations of chronic obstructive pulmonary disease. New England Journal of Medicine. 1995;333(13):817–822. doi: 10.1056/NEJM199509283331301. [DOI] [PubMed] [Google Scholar]
- 21.Kramer N, Meyer TJ, Meharg J, Cece RD, Hill NS. Randomized, prospective trial of noninvasive positive pressure ventilation in acute respiratory failure. American Journal of Respiratory and Critical Care Medicine. 1995;151(6):1799–1806. doi: 10.1164/ajrccm.151.6.7767523. [DOI] [PubMed] [Google Scholar]
- 22.Çelikel T, Sungur M, Ceyhan B, Karakurt S. Comparison of noninvasive positive pressure ventilation with standard medical therapy in hypercapnic acute respiratory failure. Chest. 1998;114(6):1636–1642. doi: 10.1378/chest.114.6.1636. [DOI] [PubMed] [Google Scholar]
- 23.Ambrosino N, Foglio K, Rubini F, Clini E, Nava S, Vitacca M. Non-invasive mechanical ventilation in acute respiratory failure due to chronic obstructive pulmonary disease: correlates for success. Thorax. 1995;50(7):755–757. doi: 10.1136/thx.50.7.755. [DOI] [PMC free article] [PubMed] [Google Scholar]
- 24.Carlucci A, Richard JC, Wysocki M, Lepage E, Brochard L. Noninvasive versus conventional mechanical ventilation: an epidemiologic survey. American Journal of Respiratory and Critical Care Medicine. 2001;163(4):874–880. doi: 10.1164/ajrccm.163.4.2006027. [DOI] [PubMed] [Google Scholar]
- 25.Soo Hoo GW, Santiago S, Williams AJ. Nasal mechanical ventilation for hypercapnic respiratory failure in chronic obstructive pulmonary disease: determinants of success and failure. Critical Care Medicine. 1994;22(8):1253–1261. doi: 10.1097/00003246-199408000-00009. [DOI] [PubMed] [Google Scholar]
- 26.Plant PK, Owen JL, Elliott MW. Early use of non-invasive ventilation for acute exacerbations of chronic obstructive pulmonary disease on general respiratory wards: a multicentre randomised controlled trial. The Lancet. 2000;355(9219):1931–1935. doi: 10.1016/s0140-6736(00)02323-0. [DOI] [PubMed] [Google Scholar]
- 27.Confalonieri M, Garuti G, Cattaruzza MS, et al. A chart of failure risk for noninvasive ventilation in patients with COPD exacerbation. European Respiratory Journal. 2005;25(2):348–355. doi: 10.1183/09031936.05.00085304. [DOI] [PubMed] [Google Scholar]
- 28.Moretti M, Cilione C, Marchioni A, Tampieri A, Fracchia C, Nava S. Incidence and causes of non-invasive mechanical ventilation failure after initial success. Thorax. 2000;55(10):819–825. doi: 10.1136/thorax.55.10.819. [DOI] [PMC free article] [PubMed] [Google Scholar]
- 29.Schlecht NF, Schwartzman K, Bourbeau J. Dyspnea as clinical indicator in patients with chronic obstructive pulmonary disease. Chronic Respiratory Disease. 2005;2(4):183–191. doi: 10.1191/1479972305cd079oa. [DOI] [PubMed] [Google Scholar]
- 30.Ferrer M, Ioanas M, Arancibia F, Marco MA, De La Bellacasa JP, Torres A. Microbial airway colonization is associated with noninvasive ventilation failure in exacerbation of chronic obstructive pulmonary disease. Critical Care Medicine. 2005;33(9):2003–2009. doi: 10.1097/01.ccm.0000178185.50422.db. [DOI] [PubMed] [Google Scholar]
- 31.Baldwin DR, Allen MB. Non-invasive ventilation for acute exacerbations of chronic obstructive pulmonary disease. Use it sooner than later to assist the “respiratory muscle pump". British Medical Journal. 1997;314:163–164. doi: 10.1136/bmj.314.7075.163. [DOI] [PMC free article] [PubMed] [Google Scholar]
- 32.Conti G, Antonelli M, Navalesi P, et al. Noninvasive vs. conventional mechanical ventilation in patients with chronic obstructive pulmonary disease after failure of medical treatment in the ward: a randomized trial. Intensive Care Medicine. 2002;28(12):1701–1707. doi: 10.1007/s00134-002-1478-0. [DOI] [PubMed] [Google Scholar]
- 33.Squadrone E, Frigerio P, Fogliati C, et al. Noninvasive vs invasive ventilation in COPD patients with severe acute respiratory failure deemed to require ventilatory assistance. Intensive Care Medicine. 2004;30(7):1303–1310. doi: 10.1007/s00134-004-2320-7. [DOI] [PubMed] [Google Scholar]
- 34.Baudouin S, Turner L, Blumenthal S, et al. Non invasive ventilation in acute respiratory failure. Thorax. 2002;57(3):192–211. doi: 10.1136/thorax.57.3.192. [DOI] [PMC free article] [PubMed] [Google Scholar]
- 35.Saetta M, Turato G, Maestrelli P, Mapp CE, Fabbri LM. Cellular and structural bases of chronic obstructive pulmonary disease. American Journal of Respiratory and Critical Care Medicine. 2001;163(6):1304–1309. doi: 10.1164/ajrccm.163.6.2009116. [DOI] [PubMed] [Google Scholar]
- 36.White AJ, Gompertz S, Stockley RA. Chronic obstructive pulmonary disease 6: the aetiology of exacerbations of chronic obstructive pulmonary disease. Thorax. 2003;58(1):73–80. doi: 10.1136/thorax.58.1.73. [DOI] [PMC free article] [PubMed] [Google Scholar]
- 37.Saetta M, Baraldo S, Zuin R. Neutrophil chemokines in severe exacerbations of chronic obstructive pulmonary disease: fatal chemo-attraction? American Journal of Respiratory and Critical Care Medicine. 2003;168(8):911–913. doi: 10.1164/rccm.2308002. [DOI] [PubMed] [Google Scholar]
- 38.Zhu J, Qiu YS, Majumdar S, et al. Exacerbations of bronchitis: bronchial eosinophilia and gene expression for interleukin-4, interleukin-5, and eosinophil chemoattractants. American Journal of Respiratory and Critical Care Medicine. 2001;164(1):109–116. doi: 10.1164/ajrccm.164.1.2007050. [DOI] [PubMed] [Google Scholar]
- 39.Aaron SD, Angel JB, Lunau M, et al. Granulocyte inflammatory markers and airway infection during acute exacerbation of chronic obstructive pulmonary disease. American Journal of Respiratory and Critical Care Medicine. 2001;163(2):349–355. doi: 10.1164/ajrccm.163.2.2003122. [DOI] [PubMed] [Google Scholar]
- 40.Bhowmik A, Seemungal TAR, Sapsford RJ, Wedzicha JA. Relation of sputum inflammatory markers to symptoms and lung function changes in COPD exacerbations. Thorax. 2000;55(2):114–120. doi: 10.1136/thorax.55.2.114. [DOI] [PMC free article] [PubMed] [Google Scholar]
- 41.Qiu Y, Zhu J, Bandi V, et al. Biopsy neutrophilia, neutrophil chemokine and receptor gene expression in severe exacerbations of chronic obstructive pulmonary disease. American Journal of Respiratory and Critical Care Medicine. 2003;168(8):968–975. doi: 10.1164/rccm.200208-794OC. [DOI] [PubMed] [Google Scholar]
- 42.Bathoorn E, Liesker JJW, Postma DS, et al. Change in inflammation in out-patient COPD patients from stable phase to a subsequent exacerbation. International Journal of Chronic Obstructive Pulmonary Disease. 2009;4(1):101–109. doi: 10.2147/copd.s4854. [DOI] [PMC free article] [PubMed] [Google Scholar]
- 43.Ball P. Epidemiology and treatment of chronic bronchitis and its exacerbations. Chest. 1995;108:43S–52S. doi: 10.1378/chest.108.2_Supplement.43S. [DOI] [PMC free article] [PubMed] [Google Scholar]
- 44.Pela R. Airways microbial flora in COPD patients in stable clinical conditions and during exacerbations: a bronchoscopic investigation. Monaldi Archives for Chest Disease. 1998;53(3):262–267. [PubMed] [Google Scholar]
- 45.Miravitlles M, Espinosa C, Fernández-Laso E, Martos JA, Maldonado JA, Gallego M. Relationship between bacterial flora in sputum and functional impairment in patients with acute exacerbations of COPD. Chest. 1999;116(1):40–46. doi: 10.1378/chest.116.1.40. [DOI] [PubMed] [Google Scholar]
- 46.Eller J, Ede A, Schaberg T, Niederman MS, Mauch H, Lode H. Infective exacerbations of chronic bronchitis: relation between bacteriologic etiology and lung function. Chest. 1998;113(6):1542–1548. doi: 10.1378/chest.113.6.1542. [DOI] [PubMed] [Google Scholar]
- 47.Bogaert D, Van Der Valk P, Ramdin R, et al. Host-pathogen interaction during pneumococcal infection in patients with chronic obstructive pulmonary disease. Infection and Immunity. 2004;72(2):818–823. doi: 10.1128/IAI.72.2.818-823.2004. [DOI] [PMC free article] [PubMed] [Google Scholar]
- 48.Soler N, Torres A, Ewig S, et al. Bronchial microbial patterns in severe exacerbations of chronic obstructive pulmonary disease (COPD) requiring mechanical ventilation. American Journal of Respiratory and Critical Care Medicine. 1998;157(5):1498–1505. doi: 10.1164/ajrccm.157.5.9711044. [DOI] [PubMed] [Google Scholar]
- 49.Li XJ, Li Q, Si LY, Yuan QY. Bacteriological differences between COPD exacerbation and community-acquired pneumonia. Respiratory Care. 2011;56(11):1818–1824. doi: 10.4187/respcare.00915. [DOI] [PubMed] [Google Scholar]
- 50.Lin SH, Kuo PH, Hsueh PR, Yang PC, Kuo SH. Sputum bacteriology in hospitalized patients with acute exacerbation of chronic obstructive pulmonary disease in Taiwan with an emphasis on Klebsiella pneumoniae and Pseudomonas aeruginosa. Respirology. 2007;12(1):81–87. doi: 10.1111/j.1440-1843.2006.00999.x. [DOI] [PubMed] [Google Scholar]
- 51.Lieberman D, Lieberman D, Ben-Yaakov M, et al. Serological evidence of Mycoplasma pneumoniae infection in acute exacerbation of COPD. Diagnostic Microbiology and Infectious Disease. 2002;44(1):1–6. doi: 10.1016/s0732-8893(02)00421-2. [DOI] [PubMed] [Google Scholar]
- 52.Papaetis G, Anastasakou E, Tselou T, et al. Serological evidence of Mycoplasma pneumoniae infection in patients with acute exacerbation of COPD: analysis of 100 hospitalizations. Advances in Medical Sciences. 2010;55(2):235–241. doi: 10.2478/v10039-010-0031-6. [DOI] [PubMed] [Google Scholar]
- 53.Blasi F, Legnani D, Lombardo VM, et al. Chlamydia pneumoniae infection in acute exacerbations of COPD. European Respiratory Journal. 1993;6(1):19–22. [PubMed] [Google Scholar]
- 54.Miyashita N, Niki Y, Nakajima M, Kawane H, Matsushima T. Chlamydia pneumoniae infection in patients with diffuse panbronchiolitis and COPD. Chest. 1998;114(4):969–971. doi: 10.1378/chest.114.4.969. [DOI] [PubMed] [Google Scholar]
- 55.Beersma MFC, Dirven K, Van Dam AP, Templeton KE, Claas ECJ, Goossens H. Evaluation of 12 commercial tests and the complement fixation test for Mycoplasma pneumoniae-specific immunoglobulin G (IgG) and IgM antibodies, with PCR used as the "gold standard". Journal of Clinical Microbiology. 2005;43(5):2277–2285. doi: 10.1128/JCM.43.5.2277-2285.2005. [DOI] [PMC free article] [PubMed] [Google Scholar]
- 56.Arnold FW, Summersgill JT, Lajoie AS, et al. A worldwide perspective of atypical pathogens in community-acquired pneumonia. American Journal of Respiratory and Critical Care Medicine. 2007;175(10):1086–1093. doi: 10.1164/rccm.200603-350OC. [DOI] [PubMed] [Google Scholar]
- 57.Lui G, Ip M, Lee N, et al. Role of ’atypical pathogens’ among adult hospitalized patients with community-acquired pneumonia. Respirology. 2009;14(8):1098–1105. doi: 10.1111/j.1440-1843.2009.01637.x. [DOI] [PubMed] [Google Scholar]
- 58.Seemungal TAR, Wedzicha JA, MacCallum PK, et al. Chlamydia pneumoniae and COPD exacerbation. Thorax. 2002;57(12):1087–1089. doi: 10.1136/thorax.57.12.1087-a. [DOI] [PMC free article] [PubMed] [Google Scholar]
- 59.Blasi F, Damato S, Cosentini R, et al. Chlamydia pneumoniae and chronic bronchitis: association with severity and bacterial clearance following treatment. Thorax. 2002;57(8):672–676. doi: 10.1136/thorax.57.8.672. [DOI] [PMC free article] [PubMed] [Google Scholar]
- 60.Diederen BMW, van der Valk PDLPM, Kluytmans JAWJ, Peeters MF, Hendrix R. The role of atypical respiratory pathogens in exacerbations of chronic obstructive pulmonary disease. European Respiratory Journal. 2007;30(2):240–244. doi: 10.1183/09031936.00012707. [DOI] [PubMed] [Google Scholar]
- 61.Varma-Basil M, Dwivedi SKD, Kumar K, et al. Role of Mycoplasma pneumoniae infection in acute exacerbations of chronic obstructive pulmonary disease. Journal of Medical Microbiology. 2009;58(3):322–326. doi: 10.1099/jmm.0.003335-0. [DOI] [PubMed] [Google Scholar]
- 62.Ieven MM, Hoymans VY. Involvement of Chlamydia pneumoniae in atherosclerosis: more evidence for lack of evidence. Journal of Clinical Microbiology. 2005;43(1):19–24. doi: 10.1128/JCM.43.1.19-24.2005. [DOI] [PMC free article] [PubMed] [Google Scholar]
- 63.Maraha B, Berg H, Kerver M, et al. Is the perceived association between Chlamydia pneumoniae and vascular diseases biased by methodology? Journal of Clinical Microbiology. 2004;42(9):3937–3941. doi: 10.1128/JCM.42.9.3937-3941.2004. [DOI] [PMC free article] [PubMed] [Google Scholar]
- 64.McCloskey RV, Straube RC, Sanders C, Smith SM, Smith CR. Treatment of septic shock with human monoclonal antibody HA-1A: a randomized, double-blind, placebo-controlled trial. Annals of Internal Medicine. 1994;121(1):1–5. doi: 10.7326/0003-4819-121-1-199407010-00001. [DOI] [PubMed] [Google Scholar]
- 65.Karin M, Ben-Neriah Y. Phosphorylation meets ubiquitination: the control of NF-κB activity. Annual Review of Immunology. 2000;18:621–663. doi: 10.1146/annurev.immunol.18.1.621. [DOI] [PubMed] [Google Scholar]
- 66.May MJ, Ghosh S. Signal transduction through NF-κB. Immunology Today. 1998;19(2):80–88. doi: 10.1016/s0167-5699(97)01197-3. [DOI] [PubMed] [Google Scholar]
- 67.Khair OA, Devalia JL, Abdelaziz MM, Sapsford RJ, Tarral H, Davies RJ. Effect of Haemophilus influenzae endotoxin on the synthesis of IL-6, IL-8, TNF-α and expression of ICAM-1 in cultured human bronchial epithelial cells. European Respiratory Journal. 1994;7(12):2109–2116. doi: 10.1183/09031936.94.07122109. [DOI] [PubMed] [Google Scholar]