

Abstract
Individual variation is the foundation for evolutionary change, but little is known about the nature of normal variation between brains. Phylogenetic variation across mammalian brains is characterized by high inter-correlations in brain region volumes, distinct allometric scaling for each brain region and the relative independence in olfactory and limbic structures volumes from the rest of the brain. Previous work examining brain variation in individuals of some domesticated species showed that these three features of phylogenetic variation were mirrored in individual variation. We extend this analysis to the human brain and 10 of its subdivisions (e.g., isocortex, hippocampus) by using magnetic resonance imaging scans of 90 human brains ranging between 16 to 25 years of age. Human brain variation resembles both the individual variation seen in other species, and variation observed across mammalian species. That is, the relative differences in the slopes of each brain region compared to medulla size within humans and between mammals are concordant, and limbic structures scale with relative independence from other brain regions. This non-random pattern of variation suggests that developmental programs channel the variation available for selection.
Keywords: Allometry, Variation, Human, Brain, Evolution
Introduction
That random variation in individual phenotypes and associated genotypes must be the foundation of natural selection has been called the “fourth pillar of Darwinism.” The demonstration of marked conservation of programs specifying the initial body plan and fundamental physiological control processes in vertebrates and invertebrates challenges this assumption [Kirschner and Gerhart, 2005; Gerhart and Kirschner, 2007]. Instead, researchers in evolution and development, “evo-devo,” propose that selection for robust and stable developmental programs generates limited and coordinated ranges of variation on which natural selection may act [Wagner, 2005; Draghi and Wagner. 2008; Masel and Trotter, 2010]. The basic features of vertebrate brain organization are similarly conserved [Striedter, 2005; Reichert, 2009; Yopak et al., 2010], so much so as to suggest a similar claim, extending it to the domain of basic architecture in neural computation.
Three features predominate cross species comparison of mammalian brains [Finlay and Darlington, 1995; Reep et al., 2007]. First, there is a high correlation in structure volumes across mammalian species. Second, each brain region expands with a distinct allometry. For example, isocortical and cerebellar volumes increase at a greater rate than other structures as overall brain size expands. Third, structures that comprise the limbic system vary more independently of other brain regions across species [Finlay and Darlington, 1995; Reep et al., 2007]. An analysis of brain volumes of an existing data set of individual domesticated, wild, and feral species [Kruska, 1970; Kruska and Stephan, 1973; Kruska, 1980; Kruska, 1996; Kruska, 2005] shows that the pattern of variation observed within and between brains of wild and domesticated populations echo this pattern [Finlay et al., 2011].
Recent evo-devo studies have shown that standing variation may lead to faster changes in particular phenotypes [Barrett and Schluter, 2008; Schluter and Conte, 2009; but see Agrawal and Stinchcombe, 2009] and that standing variation may be biased by prior selection to vary along particular dimensions [Kirschner and Gerhart, 2005; Gerhart and Kirschner, 2007; Schluter, 1996; Clarke, 1998; Eroukhamanoff and Svensson, 2011]. For example, Schluter [1996] examined individual variation in skeletal structure of stickleback species and found that co-variation among a particular set of features remained as high in distantly related taxa as in closely related ones. If the variation offered to selection was random, and selection directional, the variation patterns of increasingly more distantly-related species should progressively diverge. If variation is constrained, perhaps “filtered” by selection in producing robust and stable phenotypes, a persistent co-variation of morphological variation could result.
Previous work on brain organization in boars, minks and laboratory mice [Finlay et al., 2011; but see Hager et al., 2012] showed that characteristic features of phylogenetic variation were mirrored in individual variation. Human brains, however, are manifestly “atypical,” in that they are very large for their bodies [Jerison, 1973] and there are multiple indices of directional selection on brain size [Evans et al., 2005; Gilbert et al., 2005; Vallender, 2008]. Therefore, the brain expansion of hominids is a case of directional selection and an analysis of variation in human brains would be a useful piece in the puzzle of mammalian brain development and evolution. To that end, we used magnetic resonance imaging (MRI) scans of 90 human brains to test whether individual human brain region volumes co-vary with the pattern of individual variation observed in several other mammalian species, and with phylogenetic variation.
Materials and Methods
MRI scans
We selected a total of 90 MRI scans from two sources (Supplementary table 1). Thirty-six MRI scans of healthy participants were obtained from National Institute of Health Pediatric MRI Data Repository created by the National Institute of Health MRI Study of Normal Brain Development [Brain Development Cooperative Group, 2012; third data release]. This is a multi-site, longitudinal study of developing children from ages newborn through young adulthood. The use of the MRI scans was approved for exemption from the Institutional Review Board at our institution. We selected MRI scans of 18 human males ranging between 16–21 years of age and 18 human females ranging between 16–21 years of age. As our purpose was to characterize variation, we deliberately selected individuals with some of the smallest and largest brains to maximize variation in brain size. TheseT1-weighted images were obtained using 3-dimensional spoiled gradient recalled echo in the steady state on a 1.5-Tesla scanner (GE medical systems or Siemens; echo time of 8–11 ms, repetition time of 22–25 ms, excitation angle of 30°, acquisition matrix of 256 × 256, number of signals acquired, 1, field of view=250 mm, sagittal orientation; 160–180 slices of 1–1.5 mm thickness). All MRI images had been corrected for intensity nonuniformities with the N3 algorithm [Sled, et al., 1998].
The second source of MRI scans was the Open Access Series of Imaging Studies, which is made freely available to researchers [see http://www.oasis-brains.org; Marcus et al., 2007], from which we selected 54 MRI scans. Informed consent for the participants complies with guidelines of the Washington University Human Studies Committee (St Louis, MO). These MRI scans were acquired on a 1.5T Vision system (Siemens). T1-weighted magnetization-prepared rapid gradient echo (MP-RAGE) scans were obtained (field of view = 224, matrix = 256 × 256, slices of 1.25 mm3 thick, TR = 9.7 ms, TE = 4 ms, flip angle = 10°, TI = 20 ms, TD = 200 ms [Marcus et al., 2007]. Several acquisitions were averaged to enhance the signal to noise ratio. Twenty-seven MRI scans each of males and females ranged between 18–25 years of age. Here we also deliberately selected individuals with some of the smallest and largest brains within the available data-set to maximize variation in brain size. All brain region volumes were estimated using slices of defaced MRI images with the software program Image J.
Brain segmentation
Brain region delineations are shown in table 1 and illustrated in figure 1. We used 4–20 slices through each brain region and multiplied the areas by the slice thickness and spacing to reconstruct brain region volumes. Volumetric measurements of the brain and main brain subdivisions of 138 mammalian species (e.g., primates, bats, carnivores) were also obtained from the literature [Reep et al., 2007; Stephan et al., 1981; Baron et al., 1996]. Volumetric measurements of individual members of three species (chimpanzees; Pan troglodytes n=6; wild minks, Mustela vison; n=12; wild and domesticated minks: n=24; boars Sus scrofa, n=6; wild and domesticated boars n=12) were obtained from the literature [Kruska, 1970; Kruska and Stephan, 1973; Kruska, 1996; Finlay et al., 2011; Semendeferi and Damasio, 2000]. The choice of brain regions was constrained to match these existing parcellation schemes [Reep et al., 2007; Kruska and Stephan, 1973; Finlay et al., 2011; Stephan et al., 1981; Baron et al., 1996; table 1]. We have updated some of the terminology of this literature to match current imaging nomenclature. In addition, the prior analyses include the globus pallidus as part of the diencephalon but we here include the globus pallidus as part of the striatum (table 1).
Table 1.
Summary of boundaries used to delineate brain regions.
| Brain region name | Brain region delineations |
|---|---|
| Isocortex | The isocortex includes the grey and white matter of the isocortex as well as the claustrum. |
| Striatum | The striatum includes the globus pallidus, putamen, caudate nucleus and internal capsule. |
| Septum | The septum includes the fornix when its fibers are intermingled with septal nuclei. |
| Hippocampus | The hippocampus includes the dentate gyrus, cornu Ammonis, alveus, hippocampal commissure, fornix-fimbria caudal to septum. |
| Subicular cortex | The subicular cortex is referred to as the schizocortex in previous analyses (Stephan et al., 1981). It includes the entorhinal, parahippocampal, presubicular, parasubicular and subicular cortices. |
| Olfactory cortex | The olfactory cortex includes the olfactory cortex and amygdala. The olfactory cortex includes all layers of primary olfactory cortex. |
| Diencephalon | The diencephalon includes the hypothalamus and the thalamus. |
| Mesencephalon | The mesencephalon includes the midbrain, pons as well as the cerebral peduncles. |
| Cerebellum | The cerebellum includes the cerebellar peduncles. |
| Medulla | The rostral boundary of the medulla is the pons and the caudal boundary is the spinal cord. |
Fig. 1.
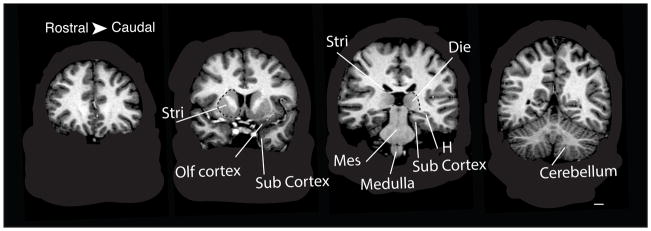
Coronal planes of an MRI scan of an 18 year-old male brain. Delineations show the boundaries of several brain regions used in the present study. The skulls were removed from the images. These images were taken from the Open Access Series of Imaging Studies. Abbreviations: Stri: striatum; Die: diencephalon, Olf cortex: olfactory cortex, sub cortex: subicular cortex, H: hippocampus, Mes: mesencephalon, Med. Scale bar: 10 mm.
Principal component analyses
We performed a principal component analysis on the natural-logged values of the size of 10 brain regions in humans (i.e., isocortex, striatum, septum, hippocampus, olfactory cortex, subicular cortex, diencephalon, cerebellum, mesencephalon, medulla). This statistical approach is highly similar to that performed previously for cross-species comparisons analyses [Finlay and Darlington, 1995; Reep et al., 2007; Finlay et al., 2011]. Unlike previous analyses, however, olfactory bulb volumes are not included because olfactory bulb volumes may not be obtained with high accuracy in the human MRI scans we analyzed. An oblimin oblique rotation was applied to three principal components. We also performed another principal component analysis using structures that collectively comprise the limbic system (i.e., hippocampus, subicular cortex, septum, olfactory cortex, amygdala) as a single anatomic unit. The statistical analysis was performed with the software package JMP8.
Allometric scaling
To compare allometric scaling of brain regions within humans and across other mammalian species, we regressed natural-logged values of each brain region volume (i.e., isocortex, diencephalon, cerebellum, medulla, mesencephalon, striatum, septum, hippocampus, subicular cortices) against the natural logged values of the medulla volume in humans and across mammalian species. These generalized linear regressions were performed via restricted estimated maximum likelihood with the software program R (version 2.15.0).
Because standard statistical analyses do not consider that species are not statistically independent of each other, we used the phylogeny generalized least squares statistics (PGLS) to obtain phylogenetically-controlled slopes of the same brain region volumes regressed against medulla volume in 138 mammalian species. The phylogeny, which includes branch lengths for these species used in our study, was taken from Bininda-Emonds et al., 2007 (fig. 2). Regression parameters were found by maximum likelihood estimates (ML).
Fig. 2.

Phylogeny of the mammalian species used in this study. The phylogeny of the 138 mammalian species was extracted from Bininda-Emonds et al., 2007.
We varied Pagel’s λ to test for phylogenetic signal in our data. Pagel’s λ multiplies all internal branches of the phylogeny by λ and the estimated ML value of Pagel’s λ provides an estimate of the phylogenetic dependence of species in statistical analyses [Pagel, 1999; Freckleton et al., 2002; table 2]. The value of λ of the residuals varies between 0 and 1. A value of 0 indicates that the data does not have a phylogenetic structure. A value of 1 indicates that traits co-vary in direct proportion to their shared evolutionary history [Pagel, 1999; Freckleton et al., 2002]. We report ML values of λ and we include significance tests for likelihood ratio (LR) statistics where we compare LR scores when λ=0 and λ=1 [Pagel, 1999; Barton and Capellini, 2011; table 2]. Here, LR=−2*[(log-likelihood of better fit model)-(log-likelihood of worse fit model)]. We performed a χ2 significance test to assess differences between the two models [Pagel, 1999]. Statistical tests were one-tailed. Cross-species analyses were done in R (version 2.15.0) with the ape package.
Table 2.
The volumes of the isocortex (Iso), cerebellum (Cer), diencephalon (Die), mesencephalon (Mes), striatum (Stri), hippocampus (Hip), septum (Sep), olfactory cortex (Olf cortex) and subicular cortices (Sub) were each regressed against medulla volumes using maximum likelihood (ML) estimates in PGLS in 138 mammalian species. We report slope, intercepts and λ values using maximum likelihood estimates in PGLS. We also report χ2 significance tests to assess significant differences between two models, one in which λ is set to 0 and one in which λ is set to 1.
| Iso | Cer | Str | Die | Sub | Mes | Hip | Olf | Sep | |
|---|---|---|---|---|---|---|---|---|---|
| Intercept | 1.948* | 1.042* | −0.148 | 0.219* | −0.995* | −0.310* | −0.198 | −0.008 | −2.268* |
| Slope | 1.337* | 1.211* | 1.108* | 1.092* | 1.014* | 0.983* | 0.956* | 0.953* | 0.884* |
| Significance tests for LR statistics (λ=0) | >0.05 | >0.05 | >0.05 | <0.05 | <0.05 | <0.05 | <0.05 | >0.05 | <0.05 |
| Significance tests for LR statistics (λ=1) | <0.05 | <0.05 | <0.05 | <0.05 | <0.05 | <0.05 | <0.05 | <0.05 | <0.05 |
Statistically significant at p<0.05.
Results
Ranges of variation
We first characterize the range of variation in brain size in humans compared to some reported ranges in variation in brain volumes for other species, including individual chimpanzees, boars and minks, using both ranges and standard deviations of brain volume. Because of the deliberately non-normalized human population, and the small sample of chimpanzee and boar brains, standard deviations should be viewed with caution. Overall brain size in humans in our sample ranges between 1,035.33 cm3 to 1,712.49 cm3 (x̄=1358.53 cm3; s=159.42; n=90). Overall brain volumes in chimpanzees range between 242.4 cm3 to 437.5 cm3 (x̄=320.88 cm3; s=68.40; n=6). Overall brain size in domestic and wild boars ranges from 85.34 cm3 to 193.82 cm3 (x̄=129.62; s=37.55; n=12). Overall brain size in domestic and wild minks ranges from 7.20 cm3 to 10.48 cm3 (x̄=8.93; s=1.09; n=24). The range of human brain size lies within 49.84% of the mean compared to 60.80%, 83.69%, 36.73% of the overall brain size in chimpanzees, boars and minks, respectively. One standard deviation of human brain volume in this sample (i.e., the coefficient of variation) is 11.73% compared to 21.32%, 28.97%, 12.21% in chimpanzees, boars and minks respectively. Thus, this particular sample of humans does not exhibit any remarkable differences in range or coefficient of variation compared to prior samples.
Allometric variation
Across mammals, each brain region expands with a distinct allometry [Finlay and Darlington, 1995]. In particular, the isocortex and cerebellum expand disproportionately relative to the other brain regions in mammals as overall brain size increases. To determine whether the pattern of allometry observed across mammalian species is similar to that found within human brain variation, we used PGLS to regress the brain region volumes against medulla volume in 138 mammalian species (table 2). We separately regressed brain region volume against medulla volume in our sample of 90 human brains (fig. 3). In both individual and phylogenetic variation, the isocortex and cerebellum have the highest slopes when regressed against medulla compared to the remaining brain regions (fig. 3, 4). The slopes of brain region volumes regressed against the medulla volume in humans and across mammalian species are significantly concordant (tau=0.6667; two-tailed p<0.05).
Fig. 3.

Natural-logged values of brain region volumes regressed against the natural-logged values of medulla volumes in humans. Circle, non-limbic structure; diamond, limbic structure; open circle and open triangle, male; Closed circle and closed triangle, female.
Fig. 4.

Slopes of mammalian brain regions regressed against medulla volume plotted against slopes of brain regions regressed against the medulla volume in humans.
Axes of Variation
We performed a principal component analysis to capture the structure of variation between brain region volumes in humans (fig. 5). Such an analysis shows that the first, second and third principal components accounts for 49.42%, 14.04% and 9.76% of the total variation, respectively. The first component loads highly on the isocortex, mesencephalon, medulla, diencephalon, cerebellum and striatum. The second principal component loads on limbic structures such as the olfactory cortex, the septum and to a lesser extent the subicular cortices. The third component loads highly on the hippocampus and subicular cortices (fig. 5). These findings show that the limbic structure volumes are in part dissociable from remaining brain region volumes in our sample of human brains.
Fig. 5.

Principal component analysis with vectors for the ten brain regions show that structures that comprise the limbic system (i.e., septum, olfactory cortex) load on principal component 2 and that other limbic structures (i.e., hippocampus, subicular cortex) load on principal component 3 whereas most non-limbic structures load highly on principal component 1. Abbreviations: Sub: subicular cortex; Olf cortex: olfactory cortex; Sep: septum; Hip: hippocampus; Stri: striatum; Iso: isocortex; Die: diencephalon; Cer: cerebellum; Mes: mesencephalon; Med: medulla.
The limbic system consists of a relatively large number of small brain regions, which contribute to a traditional functional system, and limbic structures have been shown to co-vary. We therefore performed a second principal component analysis with “limbic system” as a single value (i.e., limbic system is the sum of olfactory cortex, subicular cortex, septum, hippocampus volumes; fig. 6). In this analysis, the first, second and third principal components account for 67.29%, 9.60% and 7.92% of the total variance, respectively. The first principal component loads highly on the cerebellum and mesencephalon and to a lesser extent on the diencephalon and isocortex. The second principal component loads highly on the striatum and to a lesser extent on the isocortex. The third principal component loads highly on the limbic system (fig. 6). Taken together, these findings show that the limbic system as a whole and its subdivisions are dissociable from remaining brain regions in our sample of human brains.
Fig. 6.

A principal component analyses for the limbic system and remaining brain regions show that the limbic system loads on principal component 3 whereas the striatum loads on principal component 2 and other non-limbic structures load highly on principal component 1. Abbreviations: Stri: striatum; Iso: isocortex; Die: diencephalon; Cer: cerebellum; Mes: mesencephalon; Med: medulla.
Discussion
We find that the pattern of allometric scaling in brain region size, and the relative independence of limbic system scaling characterizes individual variation in human brains. The pattern of variation observed in human brains is similar to the individual variation within and across mammalian species [Finlay and Darlington, 1995; Reep et al., 2007; Toro et al., 2008; Finlay et al., 2011; but see Hager et al., 2012]. Two versions of principal component analyses show the variation in the limbic system to be in part dissociable from the rest of the brain. The pattern of variation within the limbic system echoes some distinctions that have been made previously [Reep et al., 2007] focusing on marine mammals with highly atrophic olfactory bulbs.
A recent report has shown that brain region volumes vary relatively independently of other brain regions in recombinant inbred mice lines [Hager et al., 2012] and may be associated with particular genetic variations, which the authors identify as evidence for “mosaic” evolution, rather than the coordinated process we have provided evidence for here. Previous work on brain variation in mouse strains [Williams et al., 1998; Finlay et al., 2011] found evidence for phylotypic, coordinated variation in mice as well. Coordinated variation and mosaic variation are not mutually exclusive properties in species variation. Interestingly, however, of the 47 individual domesticated animals and mouse strains that were previously analyzed [Finlay et al., 2011], 3 different individual mice strains out of four individual animals fall outside the 90% confidence intervals,. The amount of individual variation remaining after phylotypic variation is accounted for is, of course, large (Fig. 3). A fraction of individual variation must certainly relate to individual genetic mutations producing pathology that presumably would not characterize phylogenetic variation. The degree to which the laboratory mouse is a good model of normal genetic variability is also an ongoing concern. Systematic comparison of the patterns of phylogenetic variation with genetic variation associated with particular traits in individual species may supply a new way to understand different classes of genetic variation.
Relationship to development
The conserved pattern of allometric variation observed across mammals is mirrored in a conserved developmental program [Clancy et al., 2001]. Across mammals, brain regions with different birthdays enlarge with distinct allometric slopes with respect to remaining brain regions. That is, brain regions that undergo neurogenesis on average late in development exhibit steeper allometric slopes relative to brain regions with early birthdates [Reep et al., 2007; Finlay et al., 2001; Finlay et al., 1998]. Those precursor pools that exit the cell cycle later in development have extended periods to expand their precursor cell numbers, producing an exponential increase in their progeny in adulthood [i.e., late equals large; Striedter, 2005; Finlay and Darlington, 1995; Finlay et al., 2010]. The isocortex and cerebellum have notably protracted neurogenetic schedules relative to remaining brain regions. The observations that intrinsically linked developmental processes are associated with a predictable pattern of brain scaling across mammals, and that patterns of brain scaling in mammals mirror those found in humans, suggest that the same developmental processes produce variation at the individual and species level.
The arguments we have made rely on mechanisms that produce neuron number rather than volume. Although structure-by-structure details of how neuron numbers vary with brain region volume within humans are not clear, previous work has shown that cortical and cerebellar neuron numbers increase disproportionately relative to neuron numbers in remaining brain region in mammals [Herculano-Houzel, 2009, 2012]. These observations suggest that the variation in isocortical volume is reflective of variations in isocortical neuron numbers at least across primates.
We use the “translating time” formulation developed previously to determine how much variation in neurogenesis timing would be necessary to produce the difference in volumes of the smallest and largest human brains in our sample and thus provide some independent confirmation of the plausibility of a change limited to developmental duration as the mechanism responsible for the size variations we observe [Clancy et al., 2001; Clancy et al., 2007; http://www.translatingtime.net/]. This method uses multivariate analyses to define a “species score” which ranks the total duration of events generating the nervous system. For instance, hamsters and mice have low species scores, cats and marmosets have intermediate scores, and humans exhibit a high species scores. Moreover, species scores have a high correlation with absolute brain size [Finlay and Darlington, 1995; Clancy et al., 2001]. We can therefore invert the regression equation to determine a “species score” each for the largest- and smallest brain human in our sample and then calculate when the end of cortical neurogenesis would occur in these two large- and small-brained human “species.” We estimate from this procedure that approximately 7 to 8 days of development for the end of isocortical neurogenesis would produce the difference in the range of overall brain size observed in our sample of human brains. For reference, the total time from conception to the end of isocortical neurogenesis is approximately 110 to 120 days in humans [Clancy et al., 2001], so a range of variation in 7 to 8 days appears to be a plausible variation in developmental duration. To our knowledge, no direct measurements of variation in neural development duration have been made in humans. It is also possible that variation in the progenitor pool populations [Charvet and Striedter, 2009], the timing or pattern of gene expressions [Sylvester et al., 2010; McGowan et al., 2011], cell cycle rates [Charvet and Striedter, 2010] and/or cell death account for variation in human brain region volumes in adulthood. Further work to establish the commensurability of various aspects of neurogenesis, cell cycle rates, and progenitor pool populations is in progress.
The significance of limbic variation
We could not include the olfactory bulb in our analyses, which is the structure that has consistently loaded highest on principal component 2 or 3 in phylogenetic analyses and in individual variation across species [Yopak et al., 2010; Finlay et al., 2011]. Thus, we might expect the contribution of the limbic factor to human brain variation to be reduced [Reep et al., 2007; Finlay et al., 2011]. However, limbic structures still contribute robustly to the second and third principal component in human brain variation. Interestingly, the hippocampal and subicular cortices co-vary in humans, and the striatum appears as a separable component of variation.
Across species, those which load highest on this component are often (but not always) olfactory or chemosensory specialists, including sharks and rays from deep-water habitats, nocturnal rodents and insectivores [Yopak et al., 2010]. Recently, Smitka et al., [2012] showed a small relationship between hippocampal volume and olfactory thresholds in human subjects. Recently, Jacobs [2012] proposed that the olfactory bulb may have an underappreciated role in spatial orientation in marine vertebrates, linking it to the hippocampus and the formation of allocentric maps, suggesting that the “limbic system,” is involved in many more functions than olfaction.
It is interesting to relate variation in various limbic structures with variation in behavior. We could consider sensory or emotional differences, differences in memory capacity, or protection or predisposition to common mental disorders. In mammals, limbic structures (e.g., hippocampus) exhibit adult neurogenesis, which vary with learning, experience and environmental stress [Kaslin et al., 2008; Snyder et al., 2011; Castilla-Ortega et al., 2011]. Moreover, some limbic structure volumes appear to vary with experience [Maguire et al., 2000]. The same statement about relative variability in limbic structures appears to hold true for non-mammalian vertebrates [Lucas et al., 2004], although “adult” neurogenesis is widely distributed throughout their nervous systems [Kaslin et al., 2008]. However, why the limbic system volume varies relatively independently from other brain regions within and across species is not clear.
Individual and phylogenetic variability
The similar pattern of variation in brain anatomy that we observe at the species and individual level may be both the source and product of evolutionary processes in humans. In this case, we have suggested that variation in the duration of neurodevelopment links individual and species variation in overall brain volume. Given that isocortical volume is disproportionately increased compared to the medulla size in bigger brains at both the individual and species level, we should consider what computational or energetic advantages apply to both the individual and species levels of analyses. Across species, brain size has been linked to various measures of behavioral flexibility, including innovation, successful invasion of new niches, and laboratory measures of learning and flexibility [Lefebvre and Sol, 2008; Sol et al., 2008; Reader et al., 2011]. For humans, brain size has been shown to have a small, but statistically significant relationship to IQ [Willerman and Schultz, 1991], and the present analyses suggest that larger brains have disproportionate volumes of isocortex.
The observation that human brains are manifest outliers in relative brain volume, but still show allometric variation in brain regions, suggests that conserved allometric variation is not “exhausted” in the enlarged human brain. Additionally, the usual assumption that the isocortex per se has been the subject of targeted selection is not supported by our observations: relatively greater increase in cortical and cerebellar volume is the predictable result of overall increase in brain size. Simple extension of neurogenesis duration could be the cause of human brain expansion, applied to all brain regions, but with different allometric consequences depending on the relative duration of each brain part production. This coordinated increase in brain region volumes produces, for example, the often-observed “linkage” of cortical and cerebellar volumes or neuron numbers “for free” [Herculano-Houzel et al., 2007] as well as the cortical white matter increasing at a higher rate than cortical grey matter [Zhang and Sejnowski, 2000]. This view is in contrast to the view that brain regions expand independently to fill specific adaptations, which remains the default assumption about the process of brain evolution since it was suggested by Jerison in 1973. By eliminating the variation accounted for by the first principal component, some variation in brain region volumes can be attributed to niche-specific or ecological factors [Abdel-Mannan et al., 2008; Barton, 1998; Barton, 2007; Shultz and Dunbar, 2007; Charvet and Finlay, 2012]. Our intention here is not to contest these observations, but to insist that it is the overwhelming co-variation of brain parts that requires a functional explanation, instead of investing the last 1–5% variation in the volumes of structures with all of their functional significance.
A similar pattern of variation in the head and jaw of cichlid fish was observed between closely- and distantly related fish species [Schluter, 1996], contrary to what would be expected if species variation were a random walk away from initial states. Robust and conserved developmental processes may be essential properties of the individual phenotype that facilitates rather than constrains the generation of functional anatomical, physiological and behavioral variation [Kirschner and Gerhart, 2005; Gerhart and Kirschner, 2007]. Our findings support the same characterization of variation in mammalian brain parts. Rather than assuming that an increase in brain region volumes (e.g., cortical areas, cerebellum) is the mechanism that underlies species-important skills, considering how flexibility in the localization of cognitive function is allocated to those skills may be a more profitable focus [Anderson, 2010].
Supplementary Material
Acknowledgments
We thank Diarmuid Cahalane for help with estimating the range of variation in the length of development in humans. This work was supported by an NSF grant #0849612 and an NIH fellowship: 1F32HD067011-01A1. The content is solely the responsibility of the authors and does not necessarily represent the official views of the Eunice Kennedy Shriver National Institute of Child Health and Human Development, the Brain Development Cooperative Group Investigators or the National Institutes of Health. Support for the Brain Development Cooperative Group comes from the National Institute of Child Health and Human Development, the National Institute on Drug Abuse, the National Institute of Mental Health, and the National Institute of Neurological Disorders and Stroke (Contract #s N01-HD02-3343, N01-MH9-0002, and N01-NS-9-2314, -2315, -2316, -2317, -2319, -2320). A listing of the participating sites and of the study investigators can be found at /nihpd/info/participating_centers.htm. Support for the Open Access Series of Imaging Studies comes from grants P50 AG05681, P01 AG03991, R01 AG021910, P50 MH071616, U24 RR021382 and R01 MH56584. We thank the AnthroTree Workshop for training in phylogenetic comparative methods. The AnthroTree Workshop is supported by the NSF (BCS-0923791) and the National Evolutionary Synthesis Center (NSF grant EF-0905606).
References
- Abdel-Mannan O, Cheung AF, Molnár Z. Evolution of cortical neurogenesis. Brain Res Bull. 2008;75:398–404. doi: 10.1016/j.brainresbull.2007.10.047. [DOI] [PubMed] [Google Scholar]
- Anderson ML. Neural reuse: a fundamental organizational principle of the brain. Behav Brain Sci. 2010;33:245–66. doi: 10.1017/S0140525X10000853. discussion 266–313. [DOI] [PubMed] [Google Scholar]
- Agrawal AF, Stinchcombe JR. How much do genetic covariances alter the rate of adaptation? Proc Biol Sci. 2009;276:1183–1191. doi: 10.1098/rspb.2008.1671. [DOI] [PMC free article] [PubMed] [Google Scholar]
- Baron G, Stephan H, Frahm HD. Comparative neurobiology in chiroptera: macromorphology, brain structures, tables and atlases. Basel: Birkhauser; 1996. [Google Scholar]
- Barrett RD, Schluter D. Adaptation from standing genetic variation. Trends Ecol Evol. 2008;23:38–44. doi: 10.1016/j.tree.2007.09.008. [DOI] [PubMed] [Google Scholar]
- Barton RA. Visual specialization and brain evolution in primates. Proc Biol Sci. 1998;265:1933–7. doi: 10.1098/rspb.1998.0523. [DOI] [PMC free article] [PubMed] [Google Scholar]
- Barton RA. Evolutionary specialization in mammalian cortical structure. J Evol Biol. 2007;20:1504–1511. doi: 10.1111/j.1420-9101.2007.01330.x. [DOI] [PubMed] [Google Scholar]
- Barton RA, Capellini I. Maternal investment, life histories, and the costs of brain growth in mammals. Proc Natl Acad Sci USA. 2011;108:6169–74. doi: 10.1073/pnas.1019140108. [DOI] [PMC free article] [PubMed] [Google Scholar]
- Bininda-Emonds OR, Cardillo M, Jones KE, MacPhee RD, Beck RM, Grenyer R, Price SA, Vos RA, Gittleman JL, Purvis A. The delayed rise of present-day mammals. Nature. 2007;446:507–12. doi: 10.1038/nature05634. [DOI] [PubMed] [Google Scholar]
- Brain Development Cooperative Group . Total and Regional Brain Volumes in a Population-Based Normative Sample from 4 to 18 Years: The NIH MRI Study of Normal Brain Development. Cereb Cortex. 2012;22:1–12. doi: 10.1093/cercor/bhr018. [DOI] [PMC free article] [PubMed] [Google Scholar]
- Castilla-Ortega E, Pedraza C, Estivill-Torrús G, Santín LJ. When is adult hippocampal neurogenesis necessary for learning? evidence from animal research. Rev Neurosci. 2011;22:267–83. doi: 10.1515/RNS.2011.027. [DOI] [PubMed] [Google Scholar]
- Charvet CJ, Finlay BL. Embracing covariation in brain evolution: large brains, extended development, and flexible primate social systems. Prog Brain Res. 2012;195:71–87. doi: 10.1016/B978-0-444-53860-4.00004-0. [DOI] [PMC free article] [PubMed] [Google Scholar]
- Charvet CJ, Striedter GF. Developmental basis for telencephalon expansion in waterfowl: enlargement prior to neurogenesis. Proc Biol Sci. 2009;276:3421–7. doi: 10.1098/rspb.2009.0888. [DOI] [PMC free article] [PubMed] [Google Scholar]
- Charvet CJ, Striedter GF. Bigger brains cycle faster before neurogenesis begins: a comparison of brain development between chickens and bobwhite quail. Proc Biol Sci. 2010;277:3469–75. doi: 10.1098/rspb.2010.0811. [DOI] [PMC free article] [PubMed] [Google Scholar]
- Clarke GM. The genetic basis of developmental stability. V. Inter- and intra-individual character variation. Heredity. 1998;80:562–567. [Google Scholar]
- Clancy B, Darlington RB, Finlay BL. Translating developmental time across mammalian species. Neuroscience. 2001;105:7–17. doi: 10.1016/s0306-4522(01)00171-3. [DOI] [PubMed] [Google Scholar]
- Clancy B, Kersh B, Hyde J, Anand KJS, Darlington RB, Finlay BL. Web-based method for translating neurodevelopment from laboratory species to humans. Neuroinformatics. 2007;5:79–94. doi: 10.1385/ni:5:1:79. [DOI] [PubMed] [Google Scholar]
- Draghi J, Wagner G. Evolution of evolvability in a developmental model. Evolution. 2008;62:301–315. doi: 10.1111/j.1558-5646.2007.00303.x. [DOI] [PubMed] [Google Scholar]
- Eroukhamanoff F, Svensson EI. Evolution and stability of the G-matrix during the colonization of a novel environment. J Evol Biol. 2011;24:1363–1373. doi: 10.1111/j.1420-9101.2011.02270.x. [DOI] [PubMed] [Google Scholar]
- Evans PD, Gilbert SL, Mekel-Bobrov N, Vallender EJ, Anderson JR, Vaez-Azizi LM, Tishkoff SA, Hudson RR, Lahn BT. Microcephalin, a gene regulating brain size, continues to evolve adaptively in humans. Science. 2005;309:1717–20. doi: 10.1126/science.1113722. [DOI] [PubMed] [Google Scholar]
- Finlay BL, Clancy B, Darlington RB. Late still equals large. Brain Behav Evol. 2010;75:4–6. [Google Scholar]
- Finlay BL, Darlington RB. Linked regularities in the development and evolution of mammalian brains. Science. 1995;268:1578–1584. doi: 10.1126/science.7777856. [DOI] [PubMed] [Google Scholar]
- Finlay BL, Darlington RB, Nicastro N. Developmental structure in brain evolution. Behav Brain Sci. 2001;24:263–78. [PubMed] [Google Scholar]
- Finlay BL, Hersman MN, Darlington RB. Patterns of vertebrate neurogenesis and the paths of vertebrate evolution. Brain Behav Evol. 1998;52:232–242. doi: 10.1159/000006566. [DOI] [PubMed] [Google Scholar]
- Finlay BL, Hinz F, Darlington RB. Mapping behavioural evolution onto brain evolution: the strategic roles of conserved organization in individuals and species. Philos Trans R Soc Lond B Biol Sci. 2011;366:2111–2123. doi: 10.1098/rstb.2010.0344. [DOI] [PMC free article] [PubMed] [Google Scholar]
- Freckleton RP, Harvey PH, Pagel M. Phylogenetic analysis and comparative data: a test and review of evidence. Am Nat. 2002;160:712–26. doi: 10.1086/343873. [DOI] [PubMed] [Google Scholar]
- Gerhart J, Kirschner M. The theory of facilitated variation. Proc Natl Acad Sci USA. 2007;104(Suppl 1):8582–8589. doi: 10.1073/pnas.0701035104. [DOI] [PMC free article] [PubMed] [Google Scholar]
- Gilbert SL, Dobyns WB, Lahn BT. Genetic links between brain development and brain evolution. Nat Rev Genet. 2005;6:581–90. doi: 10.1038/nrg1634. [DOI] [PubMed] [Google Scholar]
- Hager R, Lu L, Rosen GD, Williams RW. Genetic architecture supports mosaic brain evolution and independent brain-body size regulation. Nat Commun. 2012;3:1079. doi: 10.1038/ncomms2086. [DOI] [PMC free article] [PubMed] [Google Scholar]
- Herculano-Houzel S. The human brain in numbers: a linearly scaled-up primate brain. Front Hum Neurosci. 2009;3:31. doi: 10.3389/neuro.09.031.2009. [DOI] [PMC free article] [PubMed] [Google Scholar]
- Herculano-Houzel S. Neuronal scaling rules for primate brains: the primate advantage. Prog Brain Res. 2012;195:325–40. doi: 10.1016/B978-0-444-53860-4.00015-5. [DOI] [PubMed] [Google Scholar]
- Herculano-Houzel S, Collins CE, Wong P, Kaas JH. Cellular scaling rules for primate brains. Proc Natl Acad Sci USA. 2007;104:3562–7. doi: 10.1073/pnas.0611396104. [DOI] [PMC free article] [PubMed] [Google Scholar]
- Jacobs LF. From chemotaxis to the cognitive map: the function of olfaction. Proc Natl Acad Sci USA. 2012;109(Suppl 1):10693–700. doi: 10.1073/pnas.1201880109. [DOI] [PMC free article] [PubMed] [Google Scholar]
- Jerison HJ. Evolution of the brain and intelligence. New York, NY: Academic Press; 1973. [Google Scholar]
- Kaslin J, Ganz J, Brand M. Proliferation, neurogenesis and regeneration in the non-mammalian vertebrate brain. Philos Trans R Soc Lond B Biol Sci. 2008;363:101–22. doi: 10.1098/rstb.2006.2015. [DOI] [PMC free article] [PubMed] [Google Scholar]
- Kirschner M, Gerhart J. The Plausibility of Life. New Haven, CT: Yale University Press; 2005. [Google Scholar]
- Kruska D. Vergleichend cytoarchitektonische Untersuchungen an Gehirnen von Wild- und Hausschweinen. Z Anat Entwickl Gesch. 1970;131:291–324. [PubMed] [Google Scholar]
- Kruska D, Stephan H. Volumenvergleich allocortikaler Hirnzentren bei Wild- und Hausschweinen. Acta Anat. 1973;65:73–108. [PubMed] [Google Scholar]
- Kruska D. Domestikations bedingte Hirngrosse nanderungen bei Saugetieren. J Zool Syst Evol Res. 1980;18:161–195. [Google Scholar]
- Kruska D. The effect of domestication on brain size and composition in the mink (Mustela vison) J Zool. 1996;239:645–661. [Google Scholar]
- Kruska DC. On the evolutionary significance of encephalization in some eutherian mammals: effects of adaptive radiation, domestication, and feralization. Brain Behav Evol. 2005;65:73–108. doi: 10.1159/000082979. [DOI] [PubMed] [Google Scholar]
- Lefebvre L, Sol D. Brains, lifestyles and cognition: are there general trends? Brain Behav Evol. 2008;72:135–44. doi: 10.1159/000151473. [DOI] [PubMed] [Google Scholar]
- Lucas JR, Brodin A, de Kort SR, Clayton NS. Does hippocampal size correlate with the degree of caching specialization? Proc Biol Sci. 2004;271:2423–9. doi: 10.1098/rspb.2004.2912. [DOI] [PMC free article] [PubMed] [Google Scholar]
- Maguire EA, Gadian DG, Johnsrude IS, Good CD, Ashburner J, Frackowiak RS, Frith CD. Navigation-related structural change in the hippocampi of taxi drivers. Proc Natl Acad Sci USA. 2000;97:4398–4403. doi: 10.1073/pnas.070039597. [DOI] [PMC free article] [PubMed] [Google Scholar]
- Marcus DS, Wang TH, Parker J, Csernansky JG, Morris JC, Buckner RL. Open Access Series of Imaging Studies (OASIS): cross-sectional MRI data in young, middle aged, nondemented, and demented older adults. J Cogn Neurosci. 2007;19:1498–507. doi: 10.1162/jocn.2007.19.9.1498. [DOI] [PubMed] [Google Scholar]
- Masel J, Trotter MV. Robustness and evolvability. Trends Genet. 2010;26:406–14. doi: 10.1016/j.tig.2010.06.002. [DOI] [PMC free article] [PubMed] [Google Scholar]
- McGowan L, Kuo E, Martin A, Monuki ES, Striedter G. Species differences in early patterning of the avian brain. Evolution. 2011;65:907–11. doi: 10.1111/j.1558-5646.2010.01126.x. [DOI] [PubMed] [Google Scholar]
- Pagel M. Inferring the historical patterns of biological evolution. Nature. 1999;401:877–84. doi: 10.1038/44766. [DOI] [PubMed] [Google Scholar]
- Reader SM, Hager Y, Laland KN. The evolution of primate general and cultural intelligence. Philos Trans R Soc Lond B Biol Sci. 2011;366:1017–27. doi: 10.1098/rstb.2010.0342. [DOI] [PMC free article] [PubMed] [Google Scholar]
- Reep RL, Finlay BL, Darlington RB. The limbic system in Mammalian brain evolution. Brain Behav Evol. 2007;70:57–70. doi: 10.1159/000101491. [DOI] [PubMed] [Google Scholar]
- Reichert H. Evolutionary conservation of mechanisms for neural regionalization, proliferation and interconnection in brain development. Biol Lett. 2009;23:112–116. doi: 10.1098/rsbl.2008.0337. [DOI] [PMC free article] [PubMed] [Google Scholar]
- Schluter D. Adaptive radiation along the lines of least resistance. Evolution. 1996;50:1766–1774. doi: 10.1111/j.1558-5646.1996.tb03563.x. [DOI] [PubMed] [Google Scholar]
- Schluter D, Conte GL. Genetics and ecological speciation. Proc Natl Acad Sci U S A. 2009;106(Suppl 1):9955–9962. doi: 10.1073/pnas.0901264106. [DOI] [PMC free article] [PubMed] [Google Scholar]
- Shultz S, Dunbar RI. The evolution of the social brain: anthropoid primates contrast with other vertebrates. Proc Biol Sci. 2007;274:2429–36. doi: 10.1098/rspb.2007.0693. [DOI] [PMC free article] [PubMed] [Google Scholar]
- Semendeferi K, Damasio H. The brain and its main anatomical subdivisions in living hominoids using magnetic resonance imaging. J Hum Evol. 2000;38:317–32. doi: 10.1006/jhev.1999.0381. [DOI] [PubMed] [Google Scholar]
- Sled JG, Zijdenbos AP, Evans AC. A nonparametric method for automatic correction of intensity nonuniformity in MRI data. I E E E Trans Med Imaging. 1998;17:87–97. doi: 10.1109/42.668698. [DOI] [PubMed] [Google Scholar]
- Smitka M, Puschmann S, Buschhueter D, Gerber JC, Witt M, Honeycutt N, Abolmaali N, Hummel T. Is there a correlation between hippocampus and amygdala volume and olfactory function in healthy subjects? NeuroImage. 2012;59:1052–1057. doi: 10.1016/j.neuroimage.2011.09.024. [DOI] [PubMed] [Google Scholar]
- Snyder JS, Soumier A, Brewer M, Pickel J, Cameron HA. Adult hippocampal neurogenesis buffers stress responses and depressive behaviour. Nature. 2011;476:458–61. doi: 10.1038/nature10287. [DOI] [PMC free article] [PubMed] [Google Scholar]
- Sol D, Bacher S, Reader SM, Lefebvre L. Brain size predicts the success of mammal species introduced into novel environments. Am Nat. 2008;172(Suppl 1):S63–71. doi: 10.1086/588304. [DOI] [PubMed] [Google Scholar]
- Stephan H, Frahm H, Baron G. New and revised data on volumes of brain structures on insectivores and primates. Folia Primatol. 1981;35:1–29. doi: 10.1159/000155963. [DOI] [PubMed] [Google Scholar]
- Striedter GF. Principles of brain evolution. Sunderland, MA: Sinauer Associates; 2005. [Google Scholar]
- Sylvester JB, Rich CA, Loh YH, van Staaden MJ, Fraser GJ, Streelman JT. Brain diversity evolves via differences in patterning. Proc Natl Acad Sci U S A. 2010;107:9718–23. doi: 10.1073/pnas.1000395107. [DOI] [PMC free article] [PubMed] [Google Scholar]
- Toro R, Perron M, Pike B, Richer L, Veillette S, Pausova Z, Paus T. Brain size and folding of the human cerebral cortex. Cereb Cortex. 2008;18:2352–7. doi: 10.1093/cercor/bhm261. [DOI] [PubMed] [Google Scholar]
- Vallender EJ. Exploring the origins of the human brain through molecular evolution. Brain Behav Evol. 2008;72:168–177. doi: 10.1159/000151476. [DOI] [PMC free article] [PubMed] [Google Scholar]
- Wagner A. Robustness, evolvability, and neutrality. FEBS Lett. 2005;579:1772–1778. doi: 10.1016/j.febslet.2005.01.063. [DOI] [PubMed] [Google Scholar]
- Willerman L, Schultz R. In vivo brain size and intelligence. Intelligence. 1991;15:223–228. [Google Scholar]
- Williams RW, Strom RC, Goldowitz D. Natural variation in neuron number in mice is linked to a major quantitative trait locus on Chr 11. J Neurosci. 1998;18:138–146. doi: 10.1523/JNEUROSCI.18-01-00138.1998. [DOI] [PMC free article] [PubMed] [Google Scholar]
- Yopak KE, Lisney TJ, Darlington RB, Collin SP, Montgomery JC, Finlay BL. A conserved pattern of brain scaling from sharks to primates. Proc Natl Acad Sci USA. 2010;107:12946–12951. doi: 10.1073/pnas.1002195107. [DOI] [PMC free article] [PubMed] [Google Scholar]
- Zhang K, Sejnowski TJ. A universal scaling law between gray matter and white matter of cerebral cortex. Proc Natl Acad Sci USA. 2000;97:5621–6. doi: 10.1073/pnas.090504197. [DOI] [PMC free article] [PubMed] [Google Scholar]
Associated Data
This section collects any data citations, data availability statements, or supplementary materials included in this article.