

Abstract
Sleep spindles are synchronized 11–15 Hz electroencephalographic (EEG) oscillations predominant during nonrapid-eye-movement sleep (NREMS). Rhythmic bursting in the reticular thalamic nucleus (nRt), arising from interplay between Cav3.3-type Ca2+ channels and Ca2+-dependent small-conductance-type 2 (SK2) K+ channels, underlies spindle generation. Correlative evidence indicates that spindles contribute to memory consolidation and protection against environmental noise in human NREMS. Here, we describe a molecular mechanism through which spindle power is selectively extended and we probed the actions of intensified spindling in the naturally sleeping mouse. Using electrophysiological recordings in acute brain slices from SK2 channel-overexpressing (SK2-OE) mice, we found that nRt bursting was potentiated and thalamic circuit oscillations were prolonged. Moreover, nRt cells showed greater resilience to transit from burst to tonic discharge in response to gradual depolarization, mimicking transitions out of NREMS. Compared with wild-type littermates, chronic EEG recordings of SK2-OE mice contained less fragmented NREMS, while the NREMS EEG power spectrum was conserved. Furthermore, EEG spindle activity was prolonged at NREMS exit. Finally, when exposed to white noise, SK2-OE mice needed stronger stimuli to arouse. Increased nRt bursting thus strengthens spindles and improves sleep quality through mechanisms independent of EEG slow waves (<4 Hz), suggesting SK2 signaling as a new potential therapeutic target for sleep disorders and for neuropsychiatric diseases accompanied by weakened sleep spindles.
Introduction
Nonrapid-eye-movement sleep (NREMS) is characterized by low-frequency oscillations in the electroencephalogram (EEG). Considerable evidence indicates that NREMS EEG oscillations underlie some of the unique functions of sleep for the brain, not only its restorative actions but also its roles in memory consolidation, brain development, and cognition (Miyamoto and Hensch, 2003; Diekelmann and Born, 2010; Fogel and Smith, 2011; Hanlon et al., 2011). For example, sleep spindles appear as brief (0.5–3 s) episodes of 11–15 Hz oscillations in the human sleep EEG and predominate during light stages of NREMS (Dijk et al., 1993). Interindividual variability in spindle rate in humans correlates with resilience to wake up during environmental noise (Dang-Vu et al., 2010). Furthermore, an increase in spindle density or amplitude is observed in humans (for review, see Fogel and Smith, 2011) and rodents (Schiffelholz and Aldenhoff, 2002; Eschenko et al., 2006; Mölle et al., 2009) after learning tasks. Finally, spindle-like activity emerges with the development of cortical sensorimotor processing (Khazipov et al., 2004). Strengthened spindling thus accompanies some of sleep's beneficial effects on the brain. However, how modified spindle density affects sleep and its functions has not yet been assessed directly.
The cellular and ionic events underlying spindles are well described (Steriade, 2006; Beenhakker and Huguenard, 2009) and molecular entry points for modification have been identified (Huntsman et al., 1999; Cueni et al., 2008; Espinosa et al., 2008). The reticular thalamic nucleus (nRt) is the pacemaker for spindles by providing strong GABA-ergic inhibition to thalamic nuclei, thereby causing rebound burst discharge of thalamocortical (TC) cells (Steriade, 2006; Beenhakker and Huguenard, 2009). Bursting in nRt is dominated by low-threshold T-type Ca2+ channels of the CaV3.3-type (Astori et al., 2011). Elimination of these channels leads to a marked weakening of spindle power during NREMS (Astori et al., 2011), whereas optogenetic activation of nRt bursts triggers a cortical spindle (Halassa et al., 2011). Entry of Ca2+ through CaV3.3 channels is coupled to activation of Ca2+-dependent small-conductance-type 2 (SK2) K+ channels (SK2 channels) in nRt, thereby enabling sequential bursts via vigorous interburst afterhyperpolarizations (AHPs) (Cueni et al., 2008).
In this study, we found strengthened repetitive bursting in nRt through transgenic overexpression of SK2 channels, while the timing of rhythmic bursts remained intact. In vitro synchronized activity arising from reciprocal interactions between nRt and TC cells was also intensified in SK2 channel-overexpressing (SK2-OE) animals. Notably, spindle activity was prolonged at the exit from NREMS, a time at which EEG activity in the spindle frequencies dominates the NREMS power spectrum. We have previously shown that EEG spindle power at these transitions depends on nRt bursting (Astori et al., 2011). We now also found that NREMS in SK2-OE mice was more consolidated, as indicated by a larger amount of time spent in longer NREMS episodes. Finally, SK2-OE animals had an increased threshold to awaken from NREMS in response to auditory stimulation. Sleep spindle occurrence is thus shaped by SK2-channel-mediated repetitive nRt bursting and contributes to augmented NREMS consolidation and arousal threshold.
Materials and Methods
General animal handling, genotyping, and quantitative real-time PCR.
Heterozygote SK2+/T males (Hammond et al., 2006) were bred with C57BL/6J females and maintained in a pathogen-free environment at 21−23°C and 40% humidity. Mice were entrained to a 12 h light/dark cycle with food and water available ad libitum. All studies were performed with heterozygous SK2+/T or wild-type (WT) littermates. Mice were genotyped as described previously (Hammond et al., 2006). The Veterinary Offices of the Canton de Vaud and of Oregon Health and Science University approved all experimental procedures. For real-time (RT)-PCR, RNA was extracted from punches of nRt and reactions performed as described previously (Hammond et al., 2006). Portions of all experiment types (in vitro, EEG, arousal) were performed blind to the genotype of the animals during data acquisition and analysis.
Electrophysiological recordings and analyses.
For whole-cell patch-clamp recordings, horizontal brain slices (300 μm thick) were prepared from 3- to 5-week-old SK2-OE and WT littermate mice and experiments were performed at 30−32°C as described previously (Cueni et al., 2008). For extracellular multiunit recordings, horizontal slices (400 μm thick) from 6- to 8-week-old mice were maintained in an interface-style recording chamber at 34–35°C and continuously perfused with oxygenated artificial CSF containing 3 mm Ca2+/0.5 mm Mg2+ (Astori et al., 2011).
For SK2-current recordings in voltage-clamp and for monitoring burst discharge, patch pipettes (3–4 MΩ) were prepared from borosilicate glass capillaries (TW150F-4; WPI) on a DMZ-Universal puller (Zeitz-Instruments) and filled with the following (in mm): 140 KMeSO4, 10 KCl, 10 HEPES, 0.1 EGTA, 2 MgCl2, 4 K-ATP, 0.2 Na-GTP, and 10 phosphocreatine (306–309 mOsm, pH 7.23). A liquid junction potential of −10 mV was taken into account. For T-current recordings, patch pipettes were filled with the following (in mm): 135 tetramethylammonium hydroxide, 40 HEPES, 10 EGTA, 2 MgCl2, 2.5 QX-314-Cl, and 0.2 Na-GTP, titrated to pH 7.2 with hydrofluoric acid. The liquid junction potential < 5 mV was not corrected for.
For spontaneous IPSC (sIPSC) recordings in nRt and TC cells, the intracellular pipette solution contained the following (in mm): 120 CsCl, 10 HEPES, 2 EGTA, 8 NaCl, 0.2 MgCl2, 2.5 QX-314-Cl, 0.3 Mg-ATP, 0.2 Na-GTP, and 10 phosphocreatine (295 mOsm, pH 7.35), and 6,7-dinitroquinoxaline-2,3-dione (DNQX; 40 μm) and dl-APV (100 μm) were added to the bath. sIPSCs were recorded at −60 mV for at least 5 min. A liquid junction potential <5 mV was not taken into account. To measure tonic GABAA receptor currents in TC cells, the GABAA receptor blocker gabazine (10 μm) was bath applied for 3 min.
For monitoring spontaneous burst-induced IPSCs (bIPSCs; see Fig. 3D), patch pipettes containing the following (in mm): 130 CsGluconate, 8.3 NaGluconate, 1.7 NaCl, 1 CaCl2, 10 HEPES, 10 EGTA, 2.5 QX-314-Cl, 4 Mg-ATP, 0.2 Na-GTP, and 10 phosphocreatine (294 mOsm, pH 7.26) were used to voltage clamp TC cells at −30 mV. In contrast to sIPSC recordings, the extracellular medium did not contain glutamate receptor antagonists. These recording conditions were chosen to promote spontaneous bursting in nRt cells via glutamatergic synaptic input (Crandall et al., 2010). Large (197–1687 pA) gabazine-sensitive events occurred singly or in groups of 2–3 at a low frequency of 3.2 ± 1.3/min (n = 8), which were recorded for at least 10 min and termed bIPSCs. Single bIPSCs or the first of a group were used for analysis.
Figure 3.

Spontaneous IPSCs and tonic GABAergic currents are unaltered in SK2-OE TC cells. Moreover, unitary bIPSCs can be detected in the absence of glutamatergic receptor blockers. A, Representative recordings of sIPSCs from a WT (left) and a SK2-OE (right) TC cell. B, Upper left, Overlaid average sIPSC from a WT (gray) and an SK2-OE (black) TC cell, obtained through averaging at least 200 events aligned to their rise time. Bar graphs show mean values for weighted decay time constants τw (lower left), amplitudes (upper right), and interevent interval (IEI) (lower right) of sIPSCs. Cumulative distributions are shown for amplitude and IEI (p > 0.05). C, Membrane holding currents recorded in DNQX (40 μm) and dl-APV (100 μm) in a WT and a SK2-OE TC neuron clamped at −50 mV during gabazine application (10 μm), revealing a tonic current component that was comparable between genotypes (right: WT: n = 7; SK2-OE: n = 8; p > 0.05). D, Burst IPSCs occurring in a WT TC cell when blockers for glutamatergic transmission were omitted. Application of gabazine (10 μm) blocked all events. Events marked with a number are shown enlarged at the bottom, revealing that they arose from the temporal summation of closely spaced IPSCs, yielding the typical multipeak waveform of bIPSCs. E, Example trace of a cell-attached recording from a bursting nRt cell, producing high-frequency ACs. Traces marked with 1 and 2 are shown enlarged at the bottom. F, G, Bar graphs show the time intervals between the first three temporally summated IPSCs in TC cells (F; n = 8; **p < 0.01) and between the first three ACs of spontaneously bursting nRt cells (G; n = 7; *p < 0.05).
For cell-attached recordings, pipettes (4–5 MΩ) were filled with the following (in mm): 140 KMeSO4, 10 KCl, 10 HEPES, 0.1 EGTA, 2 MgCl2, 4 K-ATP, 0.2 Na-GTP, and 10 phosphocreatine (306–309 mOsm, pH 7.23). Action currents (ACs) were recorded at −60 mV for at least 3 min. Only bursts of spontaneous ACs were included in the analysis. Bursts were defined as a group of at least four consecutive ACs occurring at frequencies ≥ 100 Hz. In recordings containing ≥ 4 bursts, time intervals were measured between the first and second and second and third AC.
Fitting of dose–response curves between T- and SK2-currents was done with the Hill equation on mean data. SK2-current properties were analyzed and fit in Clampfit 10. Low-threshold bursting at different membrane potentials was quantified as described previously (Cueni et al., 2008). Data of at least five cells were included per voltage bin (see Fig. 2). Interburst intervals were defined as the time elapsed between the first AP of one burst to the first AP of the following burst and measured between the first and second and the second and third burst.
Figure 2.
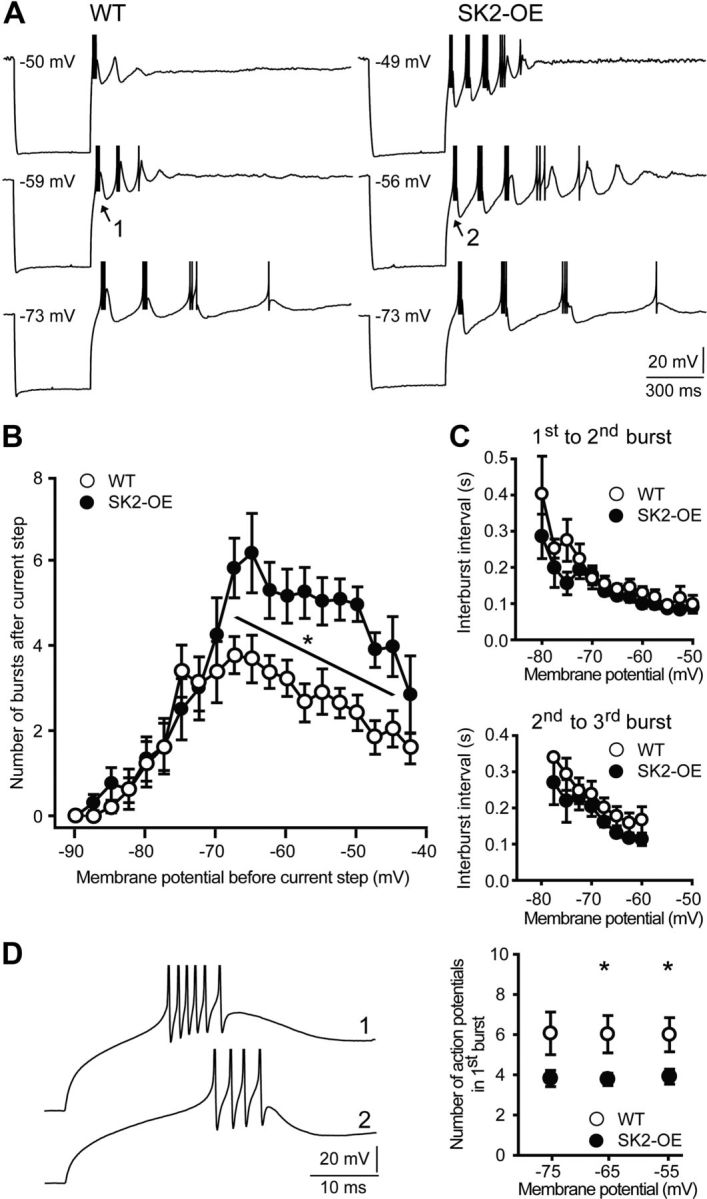
SK2-OE nRt cells show potentiated intrinsic repetitive bursting, but a curtailed number of APs per burst. A, Representative membrane voltage responses to 400 ms current injection (−0.5 nA), starting at different holding potentials. APs are truncated in amplitude. 1 and 2 denote bursts that are expanded in D. B, Number of low-threshold burst discharges as a function of membrane potential before current step, plotted in voltage bins of 2.5 mV (WT: n = 8; SK2-OE: n = 9; *p < 0.05). C, Interburst intervals between first and second (top) and second and third burst (bottom), plotted as a function of membrane potential (WT: n = 8; SK2-OE: n = 9; p > 0.05). D, Left, Enlarged bursts marked as 1 and 2 in A. Right, Number of APs within the first burst at three different membrane potentials (WT: n = 8; SK2-OE: n = 9; *p < 0.05).
Analysis of sIPSCs was performed in MiniAnalysis 6.0 (Synaptosoft). Root-mean-square (RMS) noise was determined in an event-free 60 ms time window. A minimal peak threshold of at least twice the determined RMS noise was set as detection criterion. To estimate the weighted decay time constant (τw), monophasic events with a rise time < 2 ms were averaged and τw calculated from a weighted average of decay time constants in a bi-exponential fit.
Spontaneous bIPSCs were included in the analysis if peak amplitude was >100 pA and if temporally summating multiple peaks were clearly identifiable. Recordings containing 8–43 bIPSCs per cell were included in the analysis. The duration of bIPSCs was assessed by dividing the curve integral within 60 ms from bIPSC onset by the maximal peak amplitude (see Fig. 4A,B). This measure (in fC/pA = ms) was chosen to estimate bIPSC duration while accounting for its multipeak waveform that is not suited for exponential fitting or half-width measurements (Longordo et al., 2009). Multiunit synchronized discharges were recorded and analyzed as described previously (Astori et al., 2011).
Figure 4.
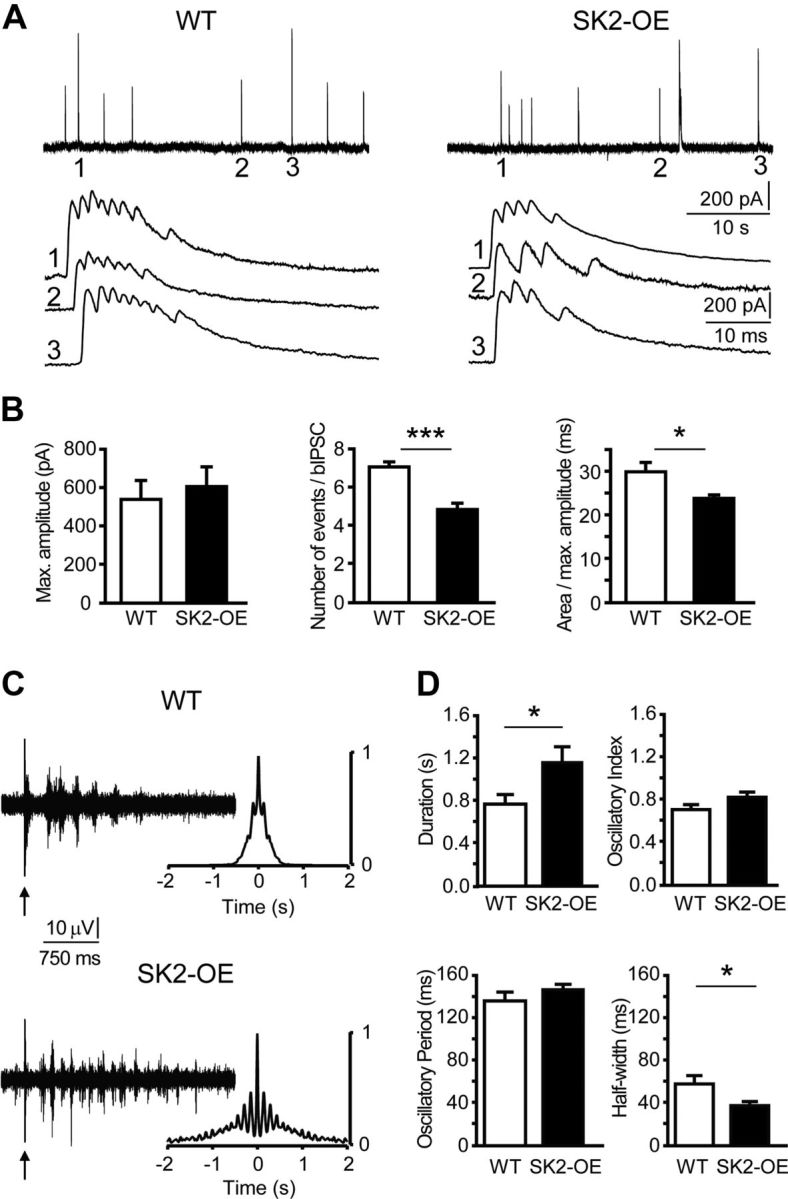
SK2 overexpression attenuates bIPSCs in TC cells, but prolongs thalamic network oscillations. A, Top, Example traces of bIPSCs for WT (left) and SK2-OE TC cells (right) at slow time scale, with labeled events (1–3) expanded below. B, Bar graphs of bIPSC parameters (n = 8 per genotype), including bIPSC peak amplitude (left, p > 0.05), number of temporally summating inhibitory events within bIPSC (middle, ***p < 0.001), and mean duration of bIPSCs (right, *p < 0.05). C, Left, Example traces of multiunit discharges recorded in nRt. The arrows mark the stimulation artifact. Right, Corresponding autocorrelograms. D, Bar graphs of parameters characteristic for network oscillations, calculated as described previously (Astori et al., 2011). Note that oscillations persisted for a longer time in SK2-OE slices (WT: n = 11; SK2-OE: n = 14; *p < 0.05) and the cycle half-width was shorter (*p < 0.05), whereas oscillatory period and strength were comparable (p > 0.05).
Polysomnographic recordings and analyses.
Surgery for combined EEG/electromyographic (EMG) recordings and data scoring were performed on male WT (n = 10) and SK2-OE (n = 12) mice as previously described (Franken et al., 1998). At the time of surgery, mice had similar body weights (WT: 26.1 ± 0.6 g; SK2-OE: 26.2 ± 0.3 g; p > 0.05). After 5–7 d of recovery, animals were tethered to a counterbalanced custom-made swivel contact and an additional 5–6 d were allowed for habituation.
For determining power spectra, EEG recordings were subject to discrete-Fourier transformation between 0.25 and 90 Hz (0.25 Hz bins, 4 s epoch time resolution, window function hamming). Activity in the 50 Hz band was removed from analysis due to power line artifacts observed in some animals. If a 4 s epoch of one behavioral state was adjacent to an epoch scored as a different state, it was excluded from spectral analysis. The same was true if epochs contained or were adjacent to epochs containing artifacts in the EEG signal. On average, a total of 14824 ± 300 epochs of NREMS time and 1585 ± 74 epochs for REMS were included in the spectral analysis, corresponding to 88 and 73% of total NREMS and REMS, respectively. To correct for interindividual variations in overall EEG signal amplitude, absolute spectral values were expressed relative to a reference, which was the mean total EEG power for all frequency bins across the three behavioral states, weighted by the number of epochs included in the spectral analysis of each state.
Sleep consolidation refers to the ability to maintain sleep continuously with minimal interruption and was quantified here by measuring the distribution of episode durations for NREMS and REMS. Data are presented as cumulative distributions of episode number and as binned bar graphs of time spent in episodes of a distinct duration (see Fig. 5B,C).
Figure 5.

SK2-OE mice show consolidated NREMS without alterations in EEG δ power. A, Time spent in wake, NREMS (NREM), and REMS (REM) separated for the 12 h light/dark periods (WT: n = 10; SK2-OE: n = 12). Repeated-measures ANOVA revealed significant genotype × behavioral state interaction for the light (F(2,40) = 6.6, p < 0.01), but not for the dark (F(1.0,20.2) = 0.4, p > 0.05) phase. In the light period, SK2-OE mice spent similar amounts of time in NREMS (p > 0.05, post hoc t test), while REMS was reduced (*p < 0.05) and waking increased (**p < 0.01). B, C, Cumulative distributions of NREMS (B) and REMS (C) episode durations during light phase only. Insets show the time spent in short, intermediate, and long episodes per hour of corresponding sleep (*p < 0.05). Top left inset in C indicates that cumulative distributions for REMS episodes run in a nonparallel fashion for very short durations only, leading to the selective reduction of time spent in short (<32 s) REMS episodes. D, Representative hypnograms for three WT and three SK2-OE mice across the first 24 h of EEG recordings. Gray shaded area represents the dark/active phase of the animals. E, Average EEG δ power (0.75–4 Hz) time course across 48 h, measured in undisturbed mice (WT: n = 10; SK2-OE: n = 12) entrained on a 12 h light/dark cycle. Gray boxes mark the dark/active phase of the mice. Values are expressed relative to the average EEG δ power during hours 8–12. Repeated-measures ANOVA indicated no genotype × time interaction (F(0.15, 5.22) = 1.12, p > 0.05). F, G, Example EEG (top) and EMG (bottom) traces for NREMS (F) and REMS (G). Average relative EEG spectra for NREMS and REMS between 0.75 and 20 Hz (in 1 Hz bins, to allow for repeated-measures ANOVA) are shown in the corresponding graphs. Repeated-measures ANOVA indicated no genotype × frequency interaction in the NREMS EEG power spectrum up to 20 Hz (F(1.7, 33.5) = 1.2, p > 0.05), but significance was reached for the REMS spectrum (F(1.3, 25.9) = 7.4, p < 0.01). Asterisk indicates points with significant genotype difference (p < 0.05, post hoc t test).
The EEG spectral dynamics at NREM–REMS and NREMS–wake transitions was determined for the frequency range between 0.75 and 25 Hz (0.25 Hz resolution), thereby including the two major frequency bands (δ and σ) well described for NREMS exit (Benington et al., 1994; Franken et al., 1998). Briefly, a transition was identified as a period of ≥8 consecutive 4 s epochs of NREMS followed by ≥3 consecutive 4 s epochs of REMS or waking. The average time course for each frequency bin was constructed for each mouse by temporally aligning all selected transitions at wake or REMS onset (= time 0). All values were normalized to the corresponding EEG power density during minutes 2 and 3 preceding the transition. Sigma and δ power time courses were determined by averaging the frequency bins from 11 to 15 and 0.75 to 4 Hz, respectively. The maximal σ power at the transitions was obtained by determining the maximal average power value of three consecutive 4 s epochs within the last minute of NREMS preceding the transition. An average of three consecutive 4 s epochs was used because, at single transitions, power can fluctuate considerably from one 4 s epoch to the next. The mean time point obtained from the maximal σ power was used to compute the time interval to REMS or wake onset. For calculating the duration of the δ power decrease, we defined the time elapsed between the last time point exceeding the 100% δ power baseline and REMS or wake onset. For both σ and δ ranges, peak and time values were first calculated for every single transition, followed by averaging within and then between animals of one genotype.
Acoustic arousal.
Thirteen WT and 12 SK2-OE mice (7–9 weeks old) were implanted with EEG and EMG electrodes (see above). Sleep–wake behavior was recorded during 2 undisturbed days before the experiment and during the 3–5 d of acoustic stimulation. During recovery from surgery, mice were habituated to the noise stimuli by repeated exposure to white noise ramps at varying times of day. Arousal was tested within the first 100 min of the light phase, and mice exposed to 6.6 ± 0.3 trials/d. This time period was chosen since consolidated NREMS is most frequent and differences in NREMS consolidation between genotypes are minimal. White noise was generated by custom software developed in the LabVIEW 2009 environment (National Instruments) and delivered through a loud speaker system (Magna 2.1; Trust). Mice were tested four at a time and experiments were scheduled counterbalanced for cage position and genotype. Only trials where mice showed continuous NREMS for 40 s before noise onset were considered for analysis. Wake-up was defined as clear EEG desynchronization accompanied by explicit EMG activity for at least one 4 s epoch. One WT animal had to be excluded from analysis due to unstable EMG signals. In 16.6 ± 2.9% of the trials, mice woke up within 30 s after noise onset in the ramp experiment, resulting in trial rejection.
Statistics.
In both text and figures, data are presented as means ± SEM. Paired or unpaired two-tailed Student's t tests were used as appropriate for in vitro data. Cumulative distributions were compared with Kolmogorov–Smirnov (KS) statistics. Repeated-measures ANOVA was used for analysis of EEG data followed by post hoc Student's t test. Greenhouse–Geisser correction was applied to account for violation of sphericity (Mauchly's test) where necessary. Alpha level for all tests was 0.05; with *p < 0.05, **p < 0.01, and ***p < 0.001.
Results
SK2 overexpression potentiates burst discharge in nRt cells
To test whether enhancing SK2-channel activity promotes nRt bursting, we examined SK2-OE mice (Hammond et al., 2006). In these animals, the SK2 (or Kcnn2) promoter drives expression of a tetracycline transactivator protein that controls transcription of SK2 mRNA from a tet-sensitive cytomegalovirus promoter (Hammond et al., 2006). Overexpression in the nRt was demonstrated through quantitative RT-PCR, which showed increased SK2 mRNA levels compared with WT by 2.4 ± 0.2-fold (n = 5 per group, p < 0.005; Table 1), while SK1 and SK3 mRNA levels were unaltered (p > 0.05).
Table 1.
Relative expression levels for mRNA of SK-channel subtypes in nRt
| SK1 | SK2 | SK3 | |
|---|---|---|---|
| WT | 1.23 ± 0.14 | 1.03 ± 0.11 | 0.57 ± 0.14 |
| SK2-OE | 1.01 ± 0.13 | 2.43 ± 0.34** | 0.30 ± 0.05 |
Expression levels of SK-channel mRNA obtained by qRT-PCR analysis in nRt of WT and SK2-OE mice. Values are normalized to 18S RNA of each sample and shown relative to mRNA levels obtained from whole brain samples. Per genotype, five animals were used. MANOVA for factor “genotype” indicated significant differences in the dataset (F(3,6) = 12.01; p < 0.006). Asterisks denote p < 0.005, as obtained by post hoc univariate testing for each SK gene within nRt.
Whole-cell voltage-clamp recordings from visually identified nRt neurons in acute brain slices were obtained to quantify SK2-currents. At the offset of a hyperpolarizing voltage command (from −60 to −110 mV), large inward T-type Ca2+ (T)-currents were followed by SK2-channel-mediated outward currents (Fig. 1A). When the duration of the hyperpolarizing voltage step was varied (from 20 to 240 ms), greater T-current activation caused a dose-dependent increase in SK2-currents (Fig. 1A), which was quantified by a sigmoidal dose–response curve with half-maximal T-current amplitude of −422 ± 34 pA (WT, n = 11; Fig. 1B). In SK2-OE cells, SK2-current amplitudes reached 2- to 3-fold greater values throughout the T-current range tested (p < 0.05), while half-maximal T-current amplitudes were comparable to those of the WT cells (−498 ± 27 pA, n = 13; p > 0.05; Fig. 1B).
Figure 1.
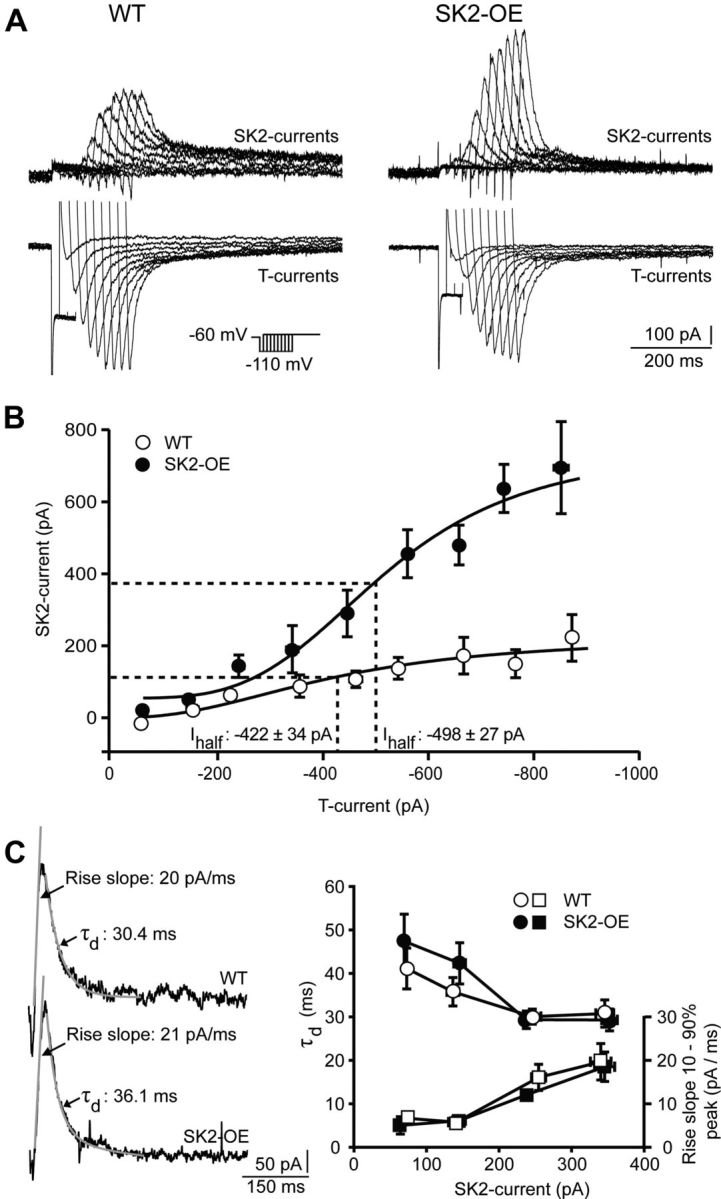
SK2 overexpression potentiates SK2-currents in nRt cells. A, Overlaid SK2-currents (top) and T-currents (bottom) from WT and SK2-OE nRt cells, elicited at the offset of hyperpolarizing steps to −110 mV lasting 20–180 ms (protocol in inset). SK2-currents shown here are apamin-sensitive currents obtained by digital subtraction. Current responses during hyperpolarization are truncated except for those lasting 20–60 ms. B, Dose–response relations between T- and SK2-currents, plotted for 100 pA bins of T-current amplitudes (WT: n = 11; SK2-OE: n = 13; p < 0.05 for all bins, except −300 to −399 pA). Half-maximal dose (Ihalf) was estimated from sigmoidal fit (black lines), with dashed lines highlighting Ihalf. SEs of T-currents are all < dot size. C, Example traces of SK2-currents from WT (top) and SK2-OE mice (bottom) showing linear fit of the rise slope for 10–90% peak and mono-exponential fit to determine decay time constant (τd) (gray overlaid traces indicated by arrows). Rise slope (squares, right axis) and τd (dots, left axis) across the range of SK2-current amplitudes generated in both genotypes (WT: n = 11; SK2-OE: n = 13; p > 0.05) are shown to the right.
SK2-currents in nRt cells from both genotypes showed comparable kinetics across a range of amplitudes, including rising slope and mono-exponential decay time constant (WT: n = 11; SK2-OE: n = 13; p > 0.05; Fig. 1C). Also, passive cellular properties such as input resistance (WT: 161 ± 22 MΩ, n = 19; SK2-OE: 236 ± 36 MΩ, n = 19), membrane capacitance (WT: 78.1 ± 6.6 pF, n = 18; SK2-OE: 59.6 ± 5.8 pF, n = 18), and resting membrane potential (WT: −65.0 ± 2.1 mV, n = 21; SK2-OE: −59.1 ± 1.9 mV, n = 14) did not differ (p > 0.05 in all cases). Finally, T-current inactivation characteristics were comparable between genotypes (WT: −94.9 ± 1.5 mV, n = 8; SK2-OE: −94.4 ± 2.4 mV, n = 10; p > 0.05). Synchronous activity within nRt circuits strongly depends on lateral synaptic inhibition between nRt cells (Beenhakker and Huguenard, 2009). Analysis of pharmacologically isolated sIPSCs in nRt cells revealed no differences in amplitude (WT: 26.3 ± 4.0 pA; SK2-OE: 22.9 ± 2.4 pA) and frequency (WT: 2.0 ± 0.3 Hz; SK2-OE: 2.5 ± 0.4 Hz) for the two genotypes (WT: n = 5; SK2-OE: n = 7; p > 0.05).
Greater SK2-currents are expected to cause larger postburst AHPs and to facilitate repetitive bursting. To test this, hyperpolarizing currents (−500 pA, 400 ms) were injected into nRt cells from different membrane potentials. Bursting in WT nRt cells had a bell-shaped dependence on membrane potential with an average maximum of 3.8 ± 0.4 repetitive bursts (n = 8) at −67.5 mV (Fig. 2A,B). In contrast, SK2-OE cells had peak levels of 6.2 ± 0.9 bursts (n = 9) in this voltage bin. Potentiated bursting persisted up to membrane potentials as depolarized as −45 mV (WT: 2.0 ± 0.4 bursts; SK2-OE: 4.0 ± 0.7 bursts; p < 0.05; Fig. 2B). For membrane potentials ≤−70 mV, cells from both genotypes showed comparable bursting propensity (p > 0.05), presumably due to the decreased driving force for K+ ions at these potentials that limits K+ currents.
The overexpression of SK2 channels did not alter the timing of bursts (Fig. 2C). However, the duration of individual Ca2+ spikes was shortened in SK2-OE cells, presumably due to accelerated AHP onset. Counting action potentials (APs) in the first burst of the oscillatory discharge in SK2-OE cells yielded a mean of 3.8 ± 0.3 APs (n = 9) at potentials eliciting maximal bursting, while WT cells produced 6.0 ± 0.9 APs (n = 8; p < 0.05; Fig. 2D). Therefore, larger SK2-currents strengthen nRt oscillatory discharge at the expense of decreased AP output per burst.
SK2 overexpression prolongs synchronized thalamic network oscillations in vitro but attenuates bIPSCs
Since high-frequency burst discharge facilitates GABA release from nRt-TC synapses (Kim et al., 1997), we examined inhibitory transmission by recording from TC cells of the ventrobasal thalamic nucleus, which lies adjacent to the nRt. There were no differences between genotypes when assessing phasic single AP-mediated (Fig. 3A,B) or tonic inhibition in TC cells (Fig. 3C). Next, blockers for glutamatergic transmission were omitted to promote synaptic excitation of nRt cells and inhibitory outward currents were monitored at −30 mV (see Materials and Methods). Under these conditions, large-amplitude, gabazine-sensitive IPSCs appeared that were composed of multiple peaks occurring at intervals < 5 ms, suggesting that these were bIPSCs (Fig. 3D). Indeed, the time intervals between the first three IPSC peaks were comparable to those between the first three ACs of spontaneously bursting nRt cells held in cell-attached mode (Fig. 3E,G). Moreover, intervals measured from both, bIPSCs and ACs, shortened during a burst, consistent with the accelerando firing pattern of bursting nRt cells (Fig. 3F,G) (Domich et al., 1986). Comparison of bIPSCs between TC cells from WT and SK2-OE mice revealed that peak amplitudes of bIPSCs were unchanged (WT: 539 ± 99 pA, n = 8; SK2-OE: 543 ± 94 pA, n = 8; p > 0.05), but there were less temporally summating IPSCs contributing to a bIPSC (WT: 7.0 ± 0.3; SK2-OE: 5.0 ± 0.3; p < 0.001), resulting in a decreased mean bIPSC duration (WT: 30.0 ± 2.1 ms; SK2-OE: 23.8 ± 0.8 ms; p < 0.05; Fig. 4A,B). Greater SK2-currents thus attenuated synaptic output due to curtailed burst discharge.
We next studied synchronized oscillations in nRt-TC networks in vitro, which depend on the strength by which nRt cells inhibit TC cells (Huntsman et al., 1999; Astori et al., 2011). Single shocks to the internal capsule evoked robust multiunit activity at a frequency ∼8 Hz in WT slices that lasted 0.76 ± 0.09 s (n = 11; Fig. 4C,D) and that was absent when GABAA- and GABAB-receptor-mediated synaptic transmission was blocked (data not shown), consistent with a dependence on reciprocal interactions with TC cells. Under similar recording conditions, multiunit activity in SK2-OE networks showed a comparable oscillatory period (WT: 136 ± 8 ms; SK2-OE: 146 ± 5 ms, n = 14; p > 0.05) and oscillatory strength (WT: 0.70 ± 0.05; SK2-OE: 0.82 ± 0.05; p > 0.05), but persisted for a longer duration (1.15 ± 0.15 s; p < 0.05; Fig. 4C,D). The half-width of multiunit discharges was shorter in SK2-OE circuits (WT: 57 ± 8 ms; SK2-OE: 37 ± 4 ms; p < 0.05; Fig. 4D), reflecting the curtailed burst discharge of individual nRt cells. SK2-OE nRt cells thus maintain and prolong the oscillatory capacity of intrathalamic networks, even though the impact of unitary bIPSCs is attenuated.
Sleep duration and low-frequency EEG power are unaffected in SK2-OE mice
To assess the consequences of elevated SK2-channel expression on sleep, we performed polysomnographic recordings in chronically implanted, undisturbed mice. First, we analyzed sleep–wake architecture and the overall EEG power spectra. EEG recordings did not show signs of epileptiform activity, notably including the absence of spike-wave-discharges. Both genotypes showed the sleep–wake distribution typical for nocturnal rodents with high and low sleep times during the light and the dark phase, respectively (Fig. 5A). There were no genotypic differences in total NREMS time during either light or dark phase (light phase: WT: 403 ± 8 min, n = 10; SK2-OE: 381 ± 7 min, n = 12; repeated-measures ANOVA followed by post hoc t test, p > 0.05; dark phase: WT: 166 ± 14 min; SK2-OE: 179 ± 15 min; p > 0.05). Total wake and REMS times across 24 h were also unchanged, although SK2-OE mice spent more time (∼32 min) in wake and less time (∼11 min) in REMS during the 12 h light phase (wake: WT: 255 ± 6 min; SK2-OE: 287 ± 8 min; p < 0.01; REMS: WT: 63 ± 3 min; SK2-OE: 52 ± 3 min; p < 0.05). The durations of waking and REMS in the dark phase were unaltered.
Sleep is not only characterized by its total duration, but also by its architecture, which includes the duration of individual episodes (bouts) spent in NREMS or REMS (Franken et al., 1999). During the light phase, SK2-OE mice spent more of their NREMS in long episodes and less in shorter ones compared with WT animals (KS test: p < 0.01; Fig. 5B). Bout length binning showed that WT mice spent 10 ± 1 min/h of NREMS in bouts >252 s, whereas SK2-OE mice spent 17 ± 2 min in these long episodes (p < 0.05; Fig. 5B). Conversely, NREMS time spent in shorter bouts lasting 32–252 s was decreased (p < 0.05). For REMS episode durations, short REMS episodes (4–32 s) were less frequent (KS test: p < 0.01), with equal time spent in the majority (>89%) of REMS episodes > 32 s (Fig. 5C). The more prominent occurrence of longer NREMS episodes with fewer interruptions by REMS or waking was evident from hypnograms, which depict the sequence of behavioral states across 24 h (Fig. 5D). Together, these data demonstrate that NREMS in SK2-OE mice occurred preferentially in longer episodes. Therefore, NREMS in SK2-OE mice was more consolidated.
Because higher NREMS consolidation is typically accompanied by greater δ (0.75 Hz) power in the NREMS EEG (Franken et al., 1991), and because nRt bursting has been implied in δ power (Cueni et al., 2008; Espinosa et al., 2008; Ochoa-Sanchez et al., 2011), we analyzed the spectral content of the sleep EEG. Surprisingly, the sleep–wake-dependent changes in EEG δ power across the light/dark cycle were similar in both genotypes (Fig. 5E). Moreover, the prominent peak in the δ range of the NREMS power spectrum was unaltered, both in absolute strength (WT: 14.2 ± 2.7 μV2; SK2-OE: 13.2 ± 3.3 μV2; p > 0.05) and in its relative contribution to the entire EEG spectrum (Fig. 5F). However, a suppression of the θ band (6–10 Hz) was found for the REMS EEG spectrum (Fig. 5G), likely reflecting the involvement of SK2 channels in hippocampal excitability (Pedarzani et al., 2005). Together, these spectral analyses indicated that the observed consolidation of NREMS was caused by previously undescribed mechanisms that are independent of a δ power increase during NREMS.
Transitions out of NREMS are prolonged in SK2-OE mice
Next, we focused specifically on spindle generation, which is reflected by the EEG σ (σ, 11–15 Hz) power (Vyazovskiy et al., 2004) and known to depend on nRt bursting (Astori et al., 2011). In the mouse NREMS EEG, nRt bursting dominates spindle activity at the transitions out of NREMS into waking or REMS, but is minor in the overall sleep EEG (Astori et al., 2011). At these ∼1 min long periods of NREMS exit, σ power rises to develop a prominent peak (Franken et al., 1998). Both genotypes showed a σ power surge before REMS onset, followed by a rapid decrease to minimal levels in REMS (Fig. 6A–C). However, in WT animals, this surge peaked ∼15–30 s before the start of REMS, while SK2-OE animals showed a protracted onset of σ power (Fig. 6B,C). On average, σ power peaked at 27.3 ± 0.8 s before REMS (Fig. 6C,D) and reached a maximum of 145 ± 8% of background values in WT (n = 10; average NREMS σ power in minute −3 to −1 before transition; Fig. 6C). In contrast, SK2-OE mice required a longer time to transition from the surge in σ power into REMS (33.2 ± 1.2 s; n = 12; p < 0.001), and the σ power peak was broadened and lower values were reached than in WT mice (122 ± 4%; p < 0.05; Fig. 6C,D). SK2-OE animals also showed a precocious decrease from baseline δ power levels until REMS onset (WT: 20 ± 1 s; SK2-OE: 28 ± 2 s; p < 0.05; Fig. 6C,D), consistent with the idea that σ power rise often depends on δ power decrease (Uchida et al., 1991; Nuñez et al., 1992, Vyazovskiy et al., 2004; Dijk et al., 1993). Absolute baseline values for both σ and δ power did not differ between genotypes (σ power, WT: 2.6 ± 0.4 μV2; SK2-OE: 2.1 ± 0.3 μV2; p > 0.05; δ power, WT: 15.5 ± 2.3 μV2; SK2-OE: 16.3 ± 2.4 μV2; p > 0.05). In summary, the duration of the transitional periods between NREMS and REMS, as quantified from σ power peak to REMS onset, were prolonged in SK2-OE mice.
Figure 6.

SK2 overexpression impedes transitions out of NREMS. A, Example traces of raw EEG recordings at the transition from NREMS to REMS for WT (top) and SK2-OE (bottom). For better comparison, epochs marked by numbers (1–4) are shown in the middle at an expanded time scale. B, Same example NREMS–REMS transitions as in A, bandpass filtered at 11–15 Hz to reveal activity in the σ frequency band. Vertical dashed line denotes REMS onset, as determined by the appearance of EEG θ activity (together with the absence of muscle tone, data not shown). Horizontal lines on top of the traces indicate the 4 s epoch containing the peak in σ power for all individual NREMS–REMS transitions of the mouse from which the representative trace was selected. Arrows mark the horizontal line corresponding to the data trace shown. C, Average EEG σ (11–15 Hz, left y-axis) and δ (0.75–4 Hz, right y-axis) power time course at NREMS–REMS transitions (WT: n = 10; SK2-OE: n = 12). Data are expressed as percentage baseline values during minutes −3 to −1 (−2 to −1 min are shown). Time points (4 s epochs) with significant genotype differences are indicated by an asterisk. Dashed line marks REMS onset, while dotted lines denote the average time point of peak σ values and last δ power > 100% obtained from the averaged datasets. Arrows indicate the shift to longer transition times. To further demonstrate this prolongation of transition periods, the inset indicates mean latencies to REMS for individual mice, calculated from the σ band peak (top) or from the δ band (bottom). D, Bar graphs comparing the mean latencies from the NREMS σ peak to REMS onset (left, ***p < 0.001) and the time needed to downregulate δ power from 100% baseline levels to the beginning of REMS (right, *p < 0.05) based on single-transition analysis.
A similar prolongation of the dynamic changes in σ power of SK2-OE mice was found at transitions from NREMS into waking (WT: 28.7 ± 0.9 s; SK2-OE: 32.1 ± 1.2 s; p < 0.05), while δ power dynamics did not differ with genotype.
SK2 overexpression promotes burst mode persistence during depolarization
When exiting from NREMS, nRt cells transit from burst to tonic discharge (Mukhametov et al., 1970; Marks and Roffwarg, 1993). To compare the ease with which WT and SK2-OE nRt neurons undergo this switch, we quantified discharge properties of cells in response to hyperpolarizing followed by depolarizing ramp currents in vitro to mimic gradual increases in depolarizing drive from ascending arousal systems (Fig. 7A,B) (el Mansari et al., 1989; McCormick and Wang, 1991; Kayama et al., 1992). In WT cells, ramps reliably resulted in tonic discharge that increased linearly up to ∼150 Hz (Pearson's correlation coefficient r = 0.83 ± 0.06, n = 9; Fig. 7B). In contrast, in SK2-OE cells, tonic discharge was not elicited even with high-amplitude ramps (r = −0.22 ± 0.21, n = 8; p < 0.01 compared with WT; Fig. 7A,B), and cells remained in burst mode. Ramps without preceding hyperpolarization elicited similar responses in both genotypes (Fig. 7C,D). The transition of SK2-OE nRt cells from repetitive bursting to tonic firing is thus hampered and could contribute to prolong exit from NREMS.
Figure 7.

SK2 overexpression hampers switching from burst to tonic discharge in nRt cells. A, Voltage responses elicited by ramps of currents applied at the offset of hyperpolarizing steps (protocol in inset). Oscillatory discharge was elicited with a 400 ms hyperpolarizing step from −60 to −110/−120 mV. After 100 ms, a depolarizing ramp of 100 ms was applied, followed by a repolarizing ramp of 500 ms. Ramp peaks were increased in 100 pA steps. B, The number of APs within a 200 ms window after ramp peak (gray box underlying the traces) increased linearly with the peak values of the applied current ramps in WT cells (n = 8), but not in SK2-OE cells (n = 11), indicating hampered burst-tonic switch of SK2-OE cells. For each cell, the resulting input–output curve was tested for linearity by calculating the Pearson's correlation coefficient (r). Average values of r significantly differed between genotypes (**p < 0.01). C, D, Analogous experiments as in A and B, except that no hyperpolarization preceded the ramps.
SK2-OE mice have an elevated auditory arousal threshold
More consolidated sleep together with higher δ power leads to elevated arousal threshold in rodents and humans (Blake and Gerard, 1937; Neckelmann and Ursin, 1993). To test whether this was also the case in SK2-OE mice that show more consolidated sleep with prolonged σ activity at NREMS exit, we woke up mice using ramps (60–90 dB, 2 dB steps every 30 s; Fig. 8A,B) or brief pulses (90 dB, 20 s; Fig. 8C) of white noise. Ramps served to quantify arousal thresholds, whereas loud pulses were used to assess the efficiency of wake-up. These experiments were performed in the first 100 min of the light phase, during which average relative EEG δ power was indistinguishable between WT and SK2-OE mice (WT: 4.1 ± 0.1%, n = 12; SK2-OE: 3.9 ± 0.2%; n = 12; p > 0.05). Moreover, during this period, latency to sleep onset (WT: 26.9 ± 3.5 min; SK2-OE: 20.5 ± 3.0 min; p > 0.05) and number of consolidated sleep epochs (WT: 18.4 ± 1.3; SK2-OE: 17.9 ± 1.0; p > 0.05) were equal between genotypes. WT mice woke up at 124.2 ± 9.9 s after ramp onset, corresponding to a noise level of 67.0 ± 0.4 dB (Fig. 8A,B). Both measures were increased in SK2-OE mice (149.8 ± 9.6 s; 68.5 ± 0.4 dB; p < 0.05 in both cases; Fig. 8A,B). Moreover, loud pulses of 90 dB were almost only half as efficient in waking up SK2-OE compared with WT mice (Fig. 8C). Therefore, SK2-OE mice showed both an increased auditory arousal threshold as well as reduced efficiency to wake up in response to brief noise exposure.
Figure 8.

Higher auditory arousal threshold in SK2-OE mice. A, Representative example traces of EEG and EMG recordings in a WT (top) and a SK2-OE mouse (bottom) during an arousal experiment using noise ramps. After 40 s of baseline (BL) NREMS, mice were exposed to increasing levels of white noise (60–90 dB, 2 dB increase in steps of 30 s, illustrated on top). Periods of wake-up are marked by numbers and shown enlarged to the right. B, Bar graph displaying the latency to arousal (left y-axis) and the corresponding noise intensity at wake-up (right y-axis) during ramp experiments (n = 12 for each genotype; *p < 0.05). C, Bar graph comparing the success rate of short duration (20 s) high intensity (90 dB) pulses to induce wake-up (n = 7 for each genotype; *p < 0.05).
Discussion
Recent insights into the ionic mechanisms underlying sleep-related cellular and circuit rhythms (Lee et al., 2004; Anderson et al., 2005; Cueni et al., 2008; Espinosa et al., 2008; Astori et al., 2011) identified candidate ion channels that may be targeted to modify distinct frequency bands of the NREMS EEG. Here, we found that overexpressing SK2 channels strengthened intrinsic oscillations of the nRt and prolonged spindle power at NREMS exit. Additionally, NREMS was more consolidated and auditory arousal threshold elevated. Altogether, our study delineates a molecular target via which spindle dynamics during natural sleep can be modified, and it proposes previously unrecognized roles for spindles in sleep architecture and acoustic arousal threshold in mice.
At the cellular level, SK2 channels present compelling advantages to modulate sleep spindles. When overexpressed, these channels selectively regulate the strength of repetitive nRt bursting within thalamic circuits, while preserving burst rate and thus intrathalamic rhythmicity. Presumably, curtailing bursts reduces inactivation of CaV3.3 channels in SK2-OE cells, thereby facilitating generation of the next spike in synergy with the enlarged AHP. Importantly, intrathalamic network rhythmicity was also prolonged by SK2 overexpression. Synchronously discharging SK2-OE nRt cells, each establishing multisite synapses onto several dendritic trees (Wanaverbecq et al., 2008), were capable of more efficiently recruiting TC cells through bIPSC-mediated rebound bursting, even though bIPSCs from single cells were shortened.
At the level of TC circuits, two important results suggest that increasing SK2-channel activity is a promising strategy to regulate spindles and sleep. First, SK2-OE mice did not show epileptic spike-wave-discharges in the EEG, which are accompanied by hypersynchronicity in intrathalamic circuits (Steriade, 2006; Beenhakker and Huguenard, 2009). Enhanced nRt excitability figures as a prominent cause for this pathology, as prolonged burst discharge boosts GABA release and provokes hypersynchronous rebound recruitment of TC cells (Beenhakker and Huguenard, 2009). In marked contrast to this well documented thalamic hyperexcitability, overexpression of SK2 channels increased burst rhythmicity but simultaneously shortened, rather than lengthened, the duration of individual bursts. Thus, GABA-ergic signaling at nRt-TC synapses remains confined, thereby limiting excessive activation of GABAergic receptors. Moreover, lateral inhibition, which most powerfully constrains thalamic oscillations (Beenhakker and Huguenard, 2009), is left intact in SK2-OE mice. Strengthening SK2-channel activity appears to be an effective means to potentiate nRt oscillatory propensity without the risk of hypersynchrony.
Second, overexpressing SK2 channels did not augment EEG δ power. Since greater NREMS δ power is tightly linked to enhanced sleep consolidation (Franken et al., 1999), the shift toward longer NREMS episodes in SK2-OE mice in conjunction with conserved δ power is unexpected and suggests previously unrecognized mechanisms involved in NREMS consolidation. The result also agrees with the finding that sleep–wake architecture in SK2-OE mice is comparatively normal, while it is typically disrupted in mouse models with more consolidated sleep and elevated δ power, for example, by a decreased ability to maintain the wake state (Wisor et al., 2002b; Ouyang et al., 2004). Nevertheless, enhanced nRt bursting has been previously associated with greater δ power (Huntsman et al., 1999; Wisor et al., 2002a; Ochoa-Sanchez et al., 2011). A probable reason for the lack of change in SK2-OE mice is that elevated burst propensity occurs within a limited voltage range > −70 mV. In contrast, low-frequency (≤4 Hz) EEG waves are accompanied by rhythmic discharge of nRt neurons starting from ∼−80 mV (Contreras and Steriade, 1995; Bazhenov et al., 2000). At this voltage, the effects of SK2 overexpression on nRt burst mode were minor and thus consistent with unaltered EEG δ power.
The observed delay in the decay of the σ power band at phases of exit from NREMS not only underscores the important role of nRt bursting at these transitional phases in mouse (Wisor et al., 2002a; Cueni et al., 2008; Astori et al., 2011), but could contribute to the improved NREMS consolidation in SK2-OE mice. Spectral analyses of these distinct NREMS periods have mainly been performed at low temporal resolution and/or on averaged datasets comprising many transitions, thereby largely ignoring the dynamic aspects of the σ power surge. Here, using a high-resolution back-calculation to assess EEG spectral changes at the level of individual transitions, we found that overexpressing SK2 channels increased the temporal spread of the σ surge, thereby lengthening the time window over which EEG activity in the σ band decayed and delaying exit from NREMS. The associated decrease in the peak amplitude of σ power in SK2-OE mice could be a consequence of this spread, but may also be caused in part by curtailed nRt burst duration and shortened multiunit discharge. Moreover, mutual antagonism between δ power decrease and σ power surge (Uchida et al., 1991; Nuñez et al., 1992; Vyazovskiy et al., 2004) may have modified surge amplitudes. The greater NREMS exit latencies in SK2-OE mice seem small compared with the increased durations of their NREMS episodes. However, because over the course of an NREMS episode attempts to transition into REMS increase (Benington et al., 1994; Franken, 2002), even a small reduction in the success rate of these attempts could underlie the substantial shift toward longer NREMS bout durations in SK2-OE mice. Also, it appears unlikely that altered activity from monoaminergic or cholinergic wake-promoting centers could contribute, since this would modify NREMS δ power (e.g., Espinosa et al., 2008). Alternatively, cortically expressed SK2 channels could contribute (Stocker and Pedarzani, 2000). However, various alterations in K+ channel expression in cortical circuits invariably affected low-frequency EEG power during NREMS (Vyazovskiy et al., 2002; Douglas et al., 2007; Espinosa et al., 2008), whereas SK2 overexpression left the NREMS spectral profile intact. This suggests that SK2-dependent modifications of cortical activity had a minor impact on NREMS, while strengthened bursting at the level of nRt acts as a prime regulator of the ease by which NREMS is terminated.
A possible mechanism through which SK2 overexpression delays exit from NREMS concerns the gradual changes of nRt cells from a burst-dominated to a largely tonic firing mode that accompany NREMS exit (Mukhametov et al., 1970; Marks and Roffwarg, 1993), caused by membrane depolarization due to gradual activation of subcortical arousal centers (el Mansari et al., 1989; Kayama et al., 1992). As demonstrated by the cellular responses to ramp currents, SK2 overexpression renders such a gradual depolarizing input less efficient. The dynamics of the spectral changes at periods of exit from NREMS are thus presumably linked to the propensity of nRt cells to exit from burst mode.
SK2-OE mice required stronger acoustic stimuli to wake-up and had a higher arousal threshold, underscoring at the behavioral level that exit from consolidated sleep was retarded. When awake, SK2-OE mice are not hearing impaired between 60 and 100 dB (Hammond et al., 2006), therefore, auditory transmission through the thalamic medial geniculate body, to which nRt bursting contributes (Yu et al., 2009), cannot account for arousal delay. Moreover, similar sleep onset latencies and EEG δ power compared with WT indicate comparable homeostatic sleep pressure during the early light phase. Finally, SK2-OE and WT mice had equal numbers of consolidated sleep epochs, suggesting that the increased arousal threshold for SK2-OE mice did not result from genotype differences in spontaneous arousal. Therefore, a plausible explanation is that SK2-OE mice differ in how acoustic stimuli drive the TC system out of its synchronized state during NREMS. For example, altered EEG power dynamics at NREMS exit could retard the arousal induced by noise. In support of this, it has recently been found that acoustic stimuli fail to reach auditory cortex selectively during spindle phases in human NREMS, but not during spindle-free sleep epochs (Dang-Vu et al., 2011).
In summary, this work provides a mechanistic link from the molecular kernels of sleep spindles to their role in sleep. As also demonstrated recently (Girardeau et al., 2009), the distinct roles of sleep EEG oscillations are becoming accessible since methods are being developed that permit them to be individually modified. Here, we used previously defined read-outs for nRt-dependent sleep spindle activity at the circuit and at the EEG levels to demonstrate that potentiated nRt bursting strengthens sleep spindle persistence and consolidates NREMS. These observations correlate with enhanced resistance to noise of sleeping SK2-OE mice. The study motivates further exploration of nRt function as a locus for improving sleep, including in the context of some neuropsychiatric conditions associated with decreased spindle activity (Ferrarelli et al., 2007).
Footnotes
This work was supported by Etat de Vaud, the Swiss National Science Foundation (31003A-135720 to J.-Y.C., 31003A-130825 and 31003A-111974 to P.F, and 31003A-129810 to A.L.), the Synapsis Foundation (S.A. and A.L.), the Foundation du 450ème and the Sciex Foundation (Z.R. and A.L.), and National Institutes of Health (NS038880 to J.P.A.).We thank all members of the Lüthi lab for helpful comments in the course of the study and for critical reading of the manuscript. We are grateful to Y. Emmenegger for help with EEG recordings and scoring, and Dr. R. Kraftsik for assistance with statistical analysis. The excellent animal caretaking by Momirka Trenkoska-Olmo is highly appreciated.
The authors declare no competing financial interest.
References
- Anderson MP, Mochizuki T, Xie J, Fischler W, Manger JP, Talley EM, Scammell TE, Tonegawa S. Thalamic CaV3.1 T-type Ca2+ channel plays a crucial role in stabilizing sleep. Proc Natl Acad Sci U S A. 2005;102:1743–1748. doi: 10.1073/pnas.0409644102. [DOI] [PMC free article] [PubMed] [Google Scholar]
- Astori S, Wimmer RD, Prosser HM, Corti C, Corsi M, Liaudet N, Volterra A, Franken P, Adelman JP, Lüthi A. The CaV3.3 calcium channel is the major sleep spindle pacemaker in thalamus. Proc Natl Acad Sci U S A. 2011;108:13823–13828. doi: 10.1073/pnas.1105115108. [DOI] [PMC free article] [PubMed] [Google Scholar]
- Bazhenov M, Timofeev I, Steriade M, Sejnowski T. Spiking-bursting activity in the thalamic reticular nucleus initiates sequences of spindle oscillations in thalamic networks. J Neurophysiol. 2000;84:1076–1087. doi: 10.1152/jn.2000.84.2.1076. [DOI] [PubMed] [Google Scholar]
- Beenhakker MP, Huguenard JR. Neurons that fire together also conspire together: is normal sleep circuitry hijacked to generate epilepsy? Neuron. 2009;62:612–632. doi: 10.1016/j.neuron.2009.05.015. [DOI] [PMC free article] [PubMed] [Google Scholar]
- Benington JH, Kodali SK, Heller HC. Scoring transitions to REM sleep in rats based on the EEG phenomena of pre-REM sleep: an improved analysis of sleep structure. Sleep. 1994;17:28–36. doi: 10.1093/sleep/17.1.28. [DOI] [PubMed] [Google Scholar]
- Blake H, Gerard RW. Brain potentials during sleep. Am J Physiol. 1937;119:692–703. [Google Scholar]
- Contreras D, Steriade M. Cellular basis of EEG slow rhythms: a study of dynamic corticothalamic relationships. J Neurosci. 1995;15:604–622. doi: 10.1523/JNEUROSCI.15-01-00604.1995. [DOI] [PMC free article] [PubMed] [Google Scholar]
- Crandall SR, Govindaiah G, Cox CL. Low-threshold Ca2+ current amplifies distal dendritic signaling in thalamic reticular neurons. J Neurosci. 2010;30:15419–15429. doi: 10.1523/JNEUROSCI.3636-10.2010. [DOI] [PMC free article] [PubMed] [Google Scholar]
- Cueni L, Canepari M, Luján R, Emmenegger Y, Watanabe M, Bond CT, Franken P, Adelman JP, Lüthi A. T-type Ca2+ channels, SK2 channels and SERCAs gate sleep-related oscillations in thalamic dendrites. Nat Neurosci. 2008;11:683–692. doi: 10.1038/nn.2124. [DOI] [PubMed] [Google Scholar]
- Dang-Vu TT, McKinney SM, Buxton OM, Solet JM, Ellenbogen JM. Spontaneous brain rhythms predict sleep stability in the face of noise. Curr Biol. 2010;20:R626–R627. doi: 10.1016/j.cub.2010.06.032. [DOI] [PubMed] [Google Scholar]
- Dang-Vu TT, Bonjean M, Schabus M, Boly M, Darsaud A, Desseilles M, Degueldre C, Balteau E, Phillips C, Luxen A, Sejnowski TJ, Maquet P. Interplay between spontaneous and induced brain activity during human non-rapid eye movement sleep. Proc Natl Acad Sci U S A. 2011;108:15438–15443. doi: 10.1073/pnas.1112503108. [DOI] [PMC free article] [PubMed] [Google Scholar]
- Diekelmann S, Born J. The memory function of sleep. Nat Rev Neurosci. 2010;11:114–126. doi: 10.1038/nrn2762. [DOI] [PubMed] [Google Scholar]
- Dijk DJ, Hayes B, Czeisler CA. Dynamics of electroencephalographic sleep spindles and slow wave activity in men: effect of sleep deprivation. Brain Res. 1993;626:190–199. doi: 10.1016/0006-8993(93)90579-c. [DOI] [PubMed] [Google Scholar]
- Domich L, Oakson G, Steriade M. Thalamic burst patterns in the naturally sleeping cat: a comparison between cortically projecting and reticularis neurones. J Physiol. 1986;379:429–449. doi: 10.1113/jphysiol.1986.sp016262. [DOI] [PMC free article] [PubMed] [Google Scholar]
- Douglas CL, Vyazovskiy V, Southard T, Chiu SY, Messing A, Tononi G, Cirelli C. Sleep in Kcna2 knockout mice. BMC Biol. 2007;5:42. doi: 10.1186/1741-7007-5-42. [DOI] [PMC free article] [PubMed] [Google Scholar]
- el Mansari M, Sakai K, Jouvet M. Unitary characteristics of presumptive cholinergic tegmental neurons during the sleep-waking cycle in freely moving cats. Exp Brain Res. 1989;76:519–529. doi: 10.1007/BF00248908. [DOI] [PubMed] [Google Scholar]
- Eschenko O, Mölle M, Born J, Sara SJ. Elevated sleep spindle density after learning or after retrieval in rats. J Neurosci. 2006;26:12914–12920. doi: 10.1523/JNEUROSCI.3175-06.2006. [DOI] [PMC free article] [PubMed] [Google Scholar]
- Espinosa F, Torres-Vega MA, Marks GA, Joho RH. Ablation of KV3.1 and KV3.3 potassium channels disrupts thalamocortical oscillations in vitro and in vivo. J Neurosci. 2008;28:5570–5581. doi: 10.1523/JNEUROSCI.0747-08.2008. [DOI] [PMC free article] [PubMed] [Google Scholar]
- Ferrarelli F, Huber R, Peterson MJ, Massimini M, Murphy M, Riedner BA, Watson A, Bria P, Tononi G. Reduced sleep spindle activity in schizophrenia patients. Am J Psychiatry. 2007;164:483–492. doi: 10.1176/ajp.2007.164.3.483. [DOI] [PubMed] [Google Scholar]
- Fogel SM, Smith CT. The function of the sleep spindle: a physiological index of intelligence and a mechanism for sleep-dependent memory consolidation. Neurosci Biobehav Rev. 2011;35:1154–1165. doi: 10.1016/j.neubiorev.2010.12.003. [DOI] [PubMed] [Google Scholar]
- Franken P. Long-term vs. short-term processes regulating REM sleep. J Sleep Res. 2002;11:17–28. doi: 10.1046/j.1365-2869.2002.00275.x. [DOI] [PubMed] [Google Scholar]
- Franken P, Dijk DJ, Tobler I, Borbély AA. Sleep deprivation in rats: effects on EEG power spectra, vigilance states, and cortical temperature. Am J Physiol. 1991;261:R198–R208. doi: 10.1152/ajpregu.1991.261.1.R198. [DOI] [PubMed] [Google Scholar]
- Franken P, Malafosse A, Tafti M. Genetic variation in EEG activity during sleep in inbred mice. Am J Physiol. 1998;275:R1127–R1137. doi: 10.1152/ajpregu.1998.275.4.R1127. [DOI] [PubMed] [Google Scholar]
- Franken P, Malafosse A, Tafti M. Genetic determinants of sleep regulation in inbred mice. Sleep. 1999;22:155–169. [PubMed] [Google Scholar]
- Girardeau G, Benchenane K, Wiener SI, Buzsáki G, Zugaro MB. Selective suppression of hippocampal ripples impairs spatial memory. Nat Neurosci. 2009;12:1222–1223. doi: 10.1038/nn.2384. [DOI] [PubMed] [Google Scholar]
- Halassa MM, Siegle JH, Ritt JT, Ting JT, Feng G, Moore CI. Selective optical drive of thalamic reticular nucleus generates thalamic bursts and cortical spindles. Nat Neurosci. 2011;14:1118–1120. doi: 10.1038/nn.2880. [DOI] [PMC free article] [PubMed] [Google Scholar]
- Hammond RS, Bond CT, Strassmaier T, Ngo-Anh TJ, Adelman JP, Maylie J, Stackman RW. Small-conductance Ca2+-activated K+ channel type 2 (SK2) modulates hippocampal learning, memory, and synaptic plasticity. J Neurosci. 2006;26:1844–1853. doi: 10.1523/JNEUROSCI.4106-05.2006. [DOI] [PMC free article] [PubMed] [Google Scholar]
- Hanlon EC, Vyazovskiy VV, Faraguna U, Tononi G, Cirelli C. Synaptic potentiation and sleep need: clues from molecular and electrophysiological studies. Curr Top Med Chem. 2011;11:2472–2482. doi: 10.2174/156802611797470312. [DOI] [PubMed] [Google Scholar]
- Huntsman MM, Porcello DM, Homanics GE, DeLorey TM, Huguenard JR. Reciprocal inhibitory connections and network synchrony in the mammalian thalamus. Science. 1999;283:541–543. doi: 10.1126/science.283.5401.541. [DOI] [PubMed] [Google Scholar]
- Kayama Y, Ohta M, Jodo E. Firing of ‘possibly’ cholinergic neurons in the rat laterodorsal tegmental nucleus during sleep and wakefulness. Brain Res. 1992;569:210–220. doi: 10.1016/0006-8993(92)90632-j. [DOI] [PubMed] [Google Scholar]
- Khazipov R, Sirota A, Leinekugel X, Holmes GL, Ben-Ari Y, Buzsáki G. Early motor activity drives spindle bursts in the developing somatosensory cortex. Nature. 2004;432:758–761. doi: 10.1038/nature03132. [DOI] [PubMed] [Google Scholar]
- Kim U, Sanchez-Vives MV, McCormick DA. Functional dynamics of GABAergic inhibition in the thalamus. Science. 1997;278:130–134. doi: 10.1126/science.278.5335.130. [DOI] [PubMed] [Google Scholar]
- Lee J, Kim D, Shin HS. Lack of delta waves and sleep disturbances during non-rapid eye movement sleep in mice lacking α1G-subunit of T-type calcium channels. Proc Natl Acad Sci U S A. 2004;101:18195–18199. doi: 10.1073/pnas.0408089101. [DOI] [PMC free article] [PubMed] [Google Scholar]
- Longordo F, Kopp C, Mishina M, Luján R, Lüthi A. NR2A at CA1 synapses is obligatory for the susceptibility of hippocampal plasticity to sleep loss. J Neurosci. 2009;29:9026–9041. doi: 10.1523/JNEUROSCI.1215-09.2009. [DOI] [PMC free article] [PubMed] [Google Scholar]
- Marks GA, Roffwarg HP. Spontaneous activity in the thalamic reticular nucleus during the sleep/wake cycle of the freely-moving rat. Brain Res. 1993;623:241–248. doi: 10.1016/0006-8993(93)91434-t. [DOI] [PubMed] [Google Scholar]
- McCormick DA, Wang Z. Serotonin and noradrenaline excite GABAergic neurones of the guinea-pig and cat nucleus reticularis thalami. J Physiol. 1991;442:235–255. doi: 10.1113/jphysiol.1991.sp018791. [DOI] [PMC free article] [PubMed] [Google Scholar]
- Miyamoto H, Hensch TK. Reciprocal interaction of sleep and synaptic plasticity. Mol Interv. 2003;3:404–417. doi: 10.1124/mi.3.7.404. [DOI] [PubMed] [Google Scholar]
- Mölle M, Eschenko O, Gais S, Sara SJ, Born J. The influence of learning on sleep slow oscillations and associated spindles and ripples in humans and rats. Eur J Neurosci. 2009;29:1071–1081. doi: 10.1111/j.1460-9568.2009.06654.x. [DOI] [PubMed] [Google Scholar]
- Mukhametov LM, Rizzolatti G, Tradardi V. Spontaneous activity of neurones of nucleus reticularis thalami in freely moving cats. J Physiol. 1970;210:651–667. doi: 10.1113/jphysiol.1970.sp009233. [DOI] [PMC free article] [PubMed] [Google Scholar]
- Neckelmann D, Ursin R. Sleep stages and EEG power spectrum in relation to acoustical stimulus arousal threshold in the rat. Sleep. 1993;16:467–477. [PubMed] [Google Scholar]
- Nuñez A, Curró Dossi R, Contreras D, Steriade M. Intracellular evidence for incompatibility between spindle and delta oscillations in thalamocortical neurons of cat. Neuroscience. 1992;48:75–85. doi: 10.1016/0306-4522(92)90339-4. [DOI] [PubMed] [Google Scholar]
- Ochoa-Sanchez R, Comai S, Lacoste B, Bambico FR, Dominguez-Lopez S, Spadoni G, Rivara S, Bedini A, Angeloni D, Fraschini F, Mor M, Tarzia G, Descarries L, Gobbi G. Promotion of non-rapid eye movement sleep and activation of reticular thalamic neurons by a novel MT2 melatonin receptor ligand. J Neurosci. 2011;31:18439–18452. doi: 10.1523/JNEUROSCI.2676-11.2011. [DOI] [PMC free article] [PubMed] [Google Scholar]
- Ouyang M, Hellman K, Abel T, Thomas SA. Adrenergic signaling plays a critical role in the maintenance of waking and in the regulation of REM sleep. J Neurophysiol. 2004;92:2071–2082. doi: 10.1152/jn.00226.2004. [DOI] [PubMed] [Google Scholar]
- Pedarzani P, McCutcheon JE, Rogge G, Jensen BS, Christophersen P, Hougaard C, Strøbaek D, Stocker M. Specific enhancement of SK channel activity selectively potentiates the afterhyperpolarizing current IAHP and modulates the firing properties of hippocampal pyramidal neurons. J Biol Chem. 2005;280:41404–41411. doi: 10.1074/jbc.M509610200. [DOI] [PubMed] [Google Scholar]
- Schiffelholz T, Aldenhoff JB. Novel object presentation affects sleep-wake behavior in rats. Neurosci Lett. 2002;328:41–44. doi: 10.1016/s0304-3940(02)00452-4. [DOI] [PubMed] [Google Scholar]
- Steriade M. Grouping of brain rhythms in corticothalamic systems. Neuroscience. 2006;137:1087–1106. doi: 10.1016/j.neuroscience.2005.10.029. [DOI] [PubMed] [Google Scholar]
- Stocker M, Pedarzani P. Differential distribution of three Ca2+-activated K+ channel subunits, SK1, SK2, and SK3, in the adult rat central nervous system. Mol Cell Neurosci. 2000;15:476–493. doi: 10.1006/mcne.2000.0842. [DOI] [PubMed] [Google Scholar]
- Uchida S, Maloney T, March JD, Azari R, Feinberg I. Sigma (12–15 Hz) and delta (0.3–3 Hz) EEG oscillate reciprocally within NREM sleep. Brain Res Bull. 1991;27:93–96. doi: 10.1016/0361-9230(91)90286-s. [DOI] [PubMed] [Google Scholar]
- Vyazovskiy VV, Deboer T, Rudy B, Lau D, Borbély AA, Tobler I. Sleep EEG in mice that are deficient in the potassium channel subunit K.v. 3.2. Brain Res. 2002;947:204–211. doi: 10.1016/s0006-8993(02)02925-6. [DOI] [PubMed] [Google Scholar]
- Vyazovskiy VV, Achermann P, Borbély AA, Tobler I. The dynamics of spindles and EEG slow-wave activity in NREM sleep in mice. Arch Ital Biol. 2004;142:511–523. [PubMed] [Google Scholar]
- Wanaverbecq N, Bodor AL, Bokor H, Slézia A, Lüthi A, Acsády L. Contrasting the functional properties of GABAergic axon terminals with single and multiple synapses in the thalamus. J Neurosci. 2008;28:11848–11861. doi: 10.1523/JNEUROSCI.3183-08.2008. [DOI] [PMC free article] [PubMed] [Google Scholar]
- Wisor JP, DeLorey TM, Homanics GE, Edgar DM. Sleep states and sleep electroencephalographic spectral power in mice lacking the β3 subunit of the GABAA receptor. Brain Res. 2002a;955:221–228. doi: 10.1016/s0006-8993(02)03467-4. [DOI] [PubMed] [Google Scholar]
- Wisor JP, O'Hara BF, Terao A, Selby CP, Kilduff TS, Sancar A, Edgar DM, Franken P. A role for cryptochromes in sleep regulation. BMC Neurosci. 2002b;3:20. doi: 10.1186/1471-2202-3-20. [DOI] [PMC free article] [PubMed] [Google Scholar]
- Yu XJ, Xu XX, He S, He J. Change detection by thalamic reticular neurons. Nat Neurosci. 2009;12:1165–1170. doi: 10.1038/nn.2373. [DOI] [PubMed] [Google Scholar]