

Abstract
Background and Aims
We sought to explore associations between serum 25-hydroxyvitamin D [25(OH)D] levels and non-alcoholic fatty liver disease [NAFLD] in an integrated healthcare delivery system in the U.S.
Methods and Results
607 NAFLD cases were randomly matched 1:1 with controls for age, sex, race and season of measurement. Conditional logistic regression was used to evaluate if serum 25(OH)D levels were associated with increased odds of NAFLD (diagnosed by ultrasound) after adjusting for body mass index and history of diabetes, renal, peripheral vascular and liver diseases (model 1) and also for hypertension (model 2). Mean (SD) serum 25(OH)D level was significantly lower in the group with NAFLD as compared with that in the matched control group (75±17 vs. 85±20 nmol/L [30±7 vs. 34±8 ng/mL], P<0.001). Inadequate 25(OH)D status progressively increased the odds of NAFLD when classified categorically as sufficient (25(OH)D 75 nmol/L [>30 ng/mL], reference group), insufficient (37–75 nmol/L [15–30 ng/mL]; adjusted odds ratio [OR]: 2.40, 95% confidence interval [CI]: 0.90–6.34) or deficient (<37 nmol/L [<15 ng/mL]; adjusted OR: 2.56, 95% CI: 1.27–5.19). When modeled as a continuous variable, increased log10 25(OH)D was inversely associated with the risk of prevalent NAFLD (adjusted OR: 0.25, 95% CI: 0.064–0.96, P=0.02).
Conclusion
Compared with matched controls, patients with NAFLD have significantly decreased serum 25(OH)D levels, suggesting that low 25(OH)D status might play a role in the development and progression of NAFLD.
Keywords: inflammation, fatty liver, NAFLD, risk factors, vitamin D, 25(OH)D
INTRODUCTION
Non-alcoholic fatty liver disease [NAFLD] has reached epidemic proportions in Western societies such as the United States, affecting approximately 20 to 30% of adults [1–3], with frequency increasing to ~70–80% in type 2 diabetes [4] and ~90% in severe obesity [5]. As these frequencies are largely based upon diagnosis by liver ultrasound, which is not (totally) sensitive when liver fat infiltration is <30% [6], the actual prevalence of NAFLD is likely even greater. NAFLD encompasses a spectrum of liver diseases, ranging from pure steatosis (fatty liver) to non-alcoholic steatohepatitis (NASH; characterized by liver inflammation and fibrosis) and cirrhosis, and represents the most common cause of chronic liver disease in adults in Western societies [6].
In parallel, vitamin D3 insufficiency or deficiency, as indicated by low circulating levels of serum 25-hydroxyvitamin D [25(OH)D)], is a highly prevalent pathologic condition across various populations, and is associated with increased systemic markers of inflammation [7–10], which may be at least partially reduced by vitamin D3 supplementation [11–14]. Systemic, chronic inflammation appears also to be central in the pathogenesis of NAFLD, as it may promote the development of intra-hepatic necro-inflammation [5]. NAFLD may, in turn, exacerbate the systemic, chronic inflammatory state by releasing several pro-inflammatory factors from the steatotic and inflamed liver, thus perpetuating a vicious cycle [15]. Thus, it is also plausible to speculate that circulating serum 25(OH)D levels might play a role in the development and/or progression of NAFLD via its potentially anti-inflammatory properties. Indeed, rodent models support that 25(OH)D deficiency plays a role in the progression of NAFLD [16, 17]. There is, however, limited quantitative evidence regarding the relation between low serum 25(OH)D levels and NAFLD (as diagnosed by either ultrasound or biopsy) in large samples of individuals, including U.S. cohorts, as the few existing studies have been conducted in limited Italian patient populations [18, 19].
The aim of this study was to examine the association between serum 25(OH)D levels and NAFLD as diagnosed by liver ultrasound (the most widely used imaging test for detecting hepatic steatosis in clinical practice) using a matched cohort for age, sex, race and season of blood draw. We hypothesized that inadequate 25(OH)D status would be associated with increased odds of NAFLD, after adjustment for important clinical risk factors.
METHODS
Data source
A retrospective cohort study was performed using the Intermountain Healthcare Enterprise Data Warehouse, which incorporates comprehensive electronic health and administrative data. Intermountain Healthcare is a non-profit organization with 23 hospitals and over 150 outpatient clinics and averages 130,000 admissions annually. Its facilities range from major adult tertiary-level care centers to small clinics and hospitals that are the only source of care in rural communities.
Study Population
The study sample included all adult patients who had a serum 25(OH)D measurement and a diagnosis of NAFLD between January 1, 1999 to December 31, 2009. We matched 607 patients with NAFLD (cases) 1:1 with healthy controls for age, sex, race and season of blood draw. Of note, the 607 control participants were chosen from 62,757 adults randomly selected without a diagnosis of NAFLD by ICD9 code, but did not have a liver ultrasound examination to exclude hepatic steatosis. All participants (controls and cases) were required to have administrative and clinical data in the Intermountain Healthcare system at least 3 months prior to the measurement of serum 25(OH)D level. We excluded patients who were <18 years old, pregnant, end-stage renal disease patients on dialysis, and individuals with an outpatient or inpatient diagnosis by ICD9 code of liver disease secondary to alcohol abuse that included: alcoholic liver disease, alcoholic cirrhosis and unspecified alcoholic liver damage (571.0; 571.2; 571.3). The Institutional Review Board at Intermountain Healthcare System and University of Colorado approved the project.
Primary predictor and outcome
The primary predictor was serum 25(OH)D level, which was measured in all participants using an INCSTAR 25(OH)D two step assay procedure with a coefficient of variation of less than 10%. The same methodology for the measurement of serum 25(OH)D was employed during the entire 10-year period (1999–2009). The first step in the procedure involves the rapid extraction of 25(OH)D from the serum using acetonitrile. Following extraction, the treated sample is assayed by using an equilibrium radioimmunoassay procedure. This method is based on an antibody with specificity to 25(OH)D. The sample, antibody, and tracer are incubated at 20–25°C for ninety minutes. A second antibody-precipitating complex is used to achieve phase separation. The radioimmunoassay method tends to overestimate the level of 25(OH)D because the antibody recognizes all forms of dihydroxy-vitamin D and D steroids.
The outcome of interest was the presence of NAFLD. All cases of NAFLD were identified by having an ICD9 code for NAFLD (571.8 and 571.9) in an outpatient or inpatient claim and by having hepatic steatosis on ultrasound within 3–15 months of the assessment of subject characteristics and measurement of serum 25(OH)D levels. Liver ultrasonography was performed through longitudinal and transverse scanning of the right upper quadrant with the patient in both the supine and left lateral decubitus positions. A single expert radiologist reviewed the video recordings of these ultrasounds evaluating the liver imaging for evidence of hepatic steatosis based on standard criteria (i.e., liver parenchymal brightness, liver-to-kidney contrast, deep beam attenuation, brightness of vessel walls, and definition of the gallbladder wall) [22–24]. The intra-observer variability for the ultrasound diagnosis of steatosis was within 3% [25].
Statistical analyses
All statistical analyses were performed with SAS software, version 9.13 (SAS Institute, Cary, NC). Cases were matched 1:1 with controls on age, sex, race and season of blood drawn. Chi Square test of independence was used to test the distribution of categorical variables between cases and controls. Wilcoxon Rank Sum test was used to test for differences in age, body mass index (BMI), serum 25(OH)D level and serum aminotransferases. Race was reduced to non-Hispanic white, Hispanic, and other due to low frequencies in some of the categories. Season was classified as winter, spring, summer and fall. Serum 25(OH)D levels were logarithmically transformed to improve the normality of the distribution. Serum 25(OH)D levels were classified as <37, 37–75 and >75 nmol/L [<15, 15–30 and >30 ng/mL]. These thresholds were chosen in keeping with the definition of 25(OH) D deficiency and insufficiency published in previous reports [26]. Serum 25(OH)D levels were also evaluated continuously as log10 25(OH)D.
Two conditional logistic regression models were used to evaluate if serum 25(OH)D levels, which were included as either a categorical or continuous variable, were associated with increased odds of NAFLD. Model 1 was adjusted for BMI, history of diabetes mellitus, renal disease, peripheral vascular disease and liver diseases. Since cases were matched to controls for age, sex, race and season of blood drawn, it was unnecessary to adjust for these variables. Since the presence or absence of hypertension was available only in a sub-sample of subjects (n=390 cases and n=258 controls), a second model was also performed including hypertension as a covariate (model 2; all covariates above plus hypertension). Of note, all confounding variables were part of the Charlson Comorbidity Index score [27]. All P values presented are two-sided.
RESULTS
Clinical characteristics
The clinical characteristics of NAFLD cases and control subjects are shown in Table 1. Since the experimental design matched cases and controls for age, sex, race and season, these variables were almost identical between the groups. BMI and the prevalences of diabetes mellitus, peripheral vascular disease and liver diseases were significantly higher in cases than controls (P < 0.005 for all), whereas the frequency of renal disease did not significantly differ between the groups. Compared with controls, cases also had significantly higher serum aminotransferase levels (P < 0.0001 for both). Hypertension diagnosis was not different between cases and controls in the sub-group of patients (n=390 cases and n=258 controls) in which these data were available.
Table 1.
Clinical Characteristics
| Variable | N (case/ctrl) | Cases | Controls | P-value |
|---|---|---|---|---|
| Age (years) | 607/607 | 55.75 ± 4.19 | 55.75 ± 14.27 | 0.99 |
| Sex (% Female) | 607/607 | 450 (74.14%) | 450 (74.14%) | 1.0000 |
| Race (% Hispanic) | 607/607 | 47 (7.86%) | 47 (7.86%) | 1.0000 |
| Race (% Other) | 607/607 | 12 (2.01%) | 12 (2.01%) | 1.0000 |
| Race (% White) | 607/607 | 539 (90.13%) | 539 (90.13%) | 1.0000 |
| BMI (kg·m−2) | 406/478 | 33.4 ± 8.3 | 29.6 ± 7.3 | < 0.0001 |
| Diabetes (%) | 607/607 | 216 (35.58%) | 151 (24.88%) | < 0.0001 |
| Renal Disease (%) | 607/607 | 65 (10.71%) | 61 (10.05%) | 0.70 |
| Peripheral Vascular Disease (%) | 607/607 | 74 (12.19%) | 43 (7.08%) | 0.0029 |
| Liver Diseases (%) | 607/607 | 97 (15.98%) | 49 (8.07%) | < 0.0001 |
| Hypertension (%) | 390/258 | 296 (75.90%) | 214 (82.95%) | 0.1613 |
| ALT (U·L−1) | 381/411 | 33 (24–50) | 29 (22–37) | < 0.0001 |
| AST (U·L−1) | 382/413 | 33 (26–44) | 28 (24–35) | < 0.0001 |
| 25(OH)D (nmol·L−1) | 607/607 | 65 (45–88) | 73 (53–95) | 0.0003 |
| 25(OH)D < 75 nmol·L−1 (%) | 607/607 | 369 (60.79%) | 326 (53.71%) | 0.0097 |
| 25(OH)D < 37 nmol·L−1 (%) | 607/607 | 95 (15.65%) | 65 (10.71%) | 0.015 |
ALT, alanine aminotransferase; AST, asparate aminotransferase; BMI, body mass index; 25(OH)D, 25-hydroxyvitamin D. Data are mean (SD) or mean (% of total), except ALT, AST and 25(OH)D, which are median (interquartile range).
Notably, serum 25(OH)D levels were significantly lower in the group of NAFLD patients as compared to controls (Figure 1; P = 0.0003). When serum 25(OH)D level was characterized as either <75 or <37 nmol/L [<30 ng/mL or <15 ng/mL], the prevalence of vitamin D insufficiency or deficiency was greater in cases than in controls (P = 0.001 and 0.02, respectively).
Figure 1. Circulating 25(OH)D Levels in Cases vs. Controls.
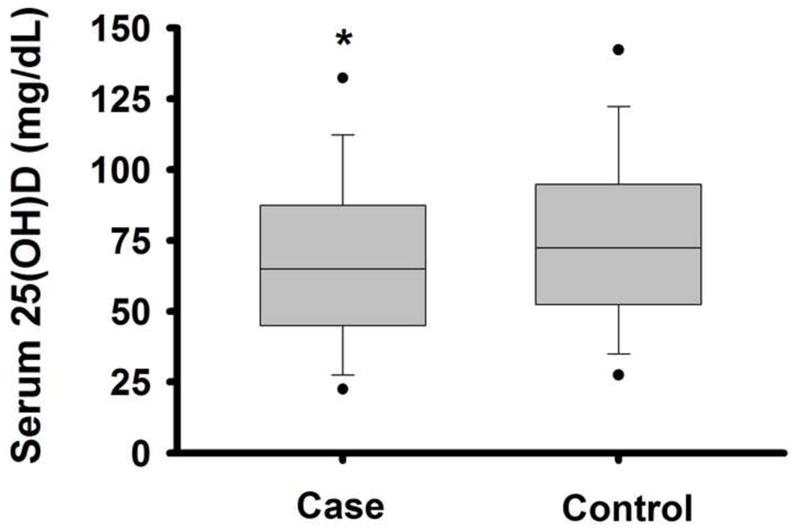
Box-plots of serum 25-hydroxyvitamin D [25(OH)D] levels in non-alcoholic fatty live disease (NAFLD) cases vs. controls. Middle line indicates median, borders of the box indicate the 25th to 75th percentile, whiskers indicate the 10th and 90th percentile, and dots indicate 5th and 95th percentile. * P < 0.0005 vs. control.
Relation between low vitamin D and NAFLD
Serum 25(OH)D level was categorized as deficient (<37 nmol/L [<15 ng/mL]), insufficient (37–75 nmol/L [15–30 ng/mL]) or sufficient (>75 nmol/L [>30 ng/mL]). As shown in Figure 2, insufficient (37–75 nmol/L [15–30 ng/mL]) or deficient (<37 nmol/L [<15 ng/mL]) serum 25(OH)D levels were associated with a significantly increased odds of NAFLD in the unadjusted regression model compared to the reference group of those with a serum 25(OH)D level >75 nmol/L [>30 ng/mL]. After adjusting for BMI, history of diabetes, renal disease, peripheral vascular disease and liver diseases (model 1), the lowest two serum 25(OH)D groups still were associated with an increased odds of NAFLD compared to the reference (vitamin D sufficient) group. Almost identical results were obtained even when hypertension was added to the multivariate regression model (model 2).
Figure 2. Odds Ratios of NAFLD.
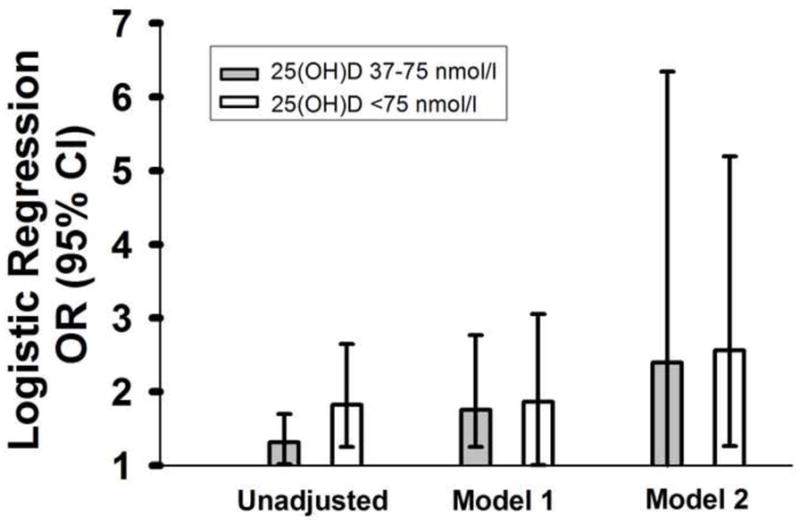
Logistic regression odds ratios (OR; 95% confidence interval [CI]) of non-alcoholic fatty liver disease [NAFLD] according to serum 25-hydroxyvitamin D [25(OH)D] level compared to sufficient (>75 nmol/L [>30 ng/mL]) reference group (gray bars: insufficient (37–75 nmol/L [15–30 ng/mL]); white bars: deficient (<37 nmol/L [<15 ng/mL]). Regression model 1 is adjusted for BMI and history of diabetes, renal disease, peripheral vascular disease and liver disease. Regression model 2 is further adjusted for hypertension.
As shown in Table 2, when serum 25(OH)D level was evaluated linearly there was a significant, inverse relation between serum 25(OH)D level and the odds of NAFLD [OR: 0.35; 95% CI: 0.21–0.60, P = 0.0001 for every log10 increase in 25(OH)D]. This relation remained essentially unchanged after adjustment for BMI, history of diabetes, renal disease, peripheral vascular disease and liver diseases [adjusted OR: 0.43; 95% CI: 0.20–0.93; P = 0.03 for every log10 increase in 25(OH)D] and even after additional adjustment for hypertension (adjusted OR: 0.25; 95% CI: 0.10–0.96; P = 0.02). Results were similar when we excluded patients with liver diseases [model 2 adjusted OR: 0.21; 95% CI: 0.04–0.96, P = 0.04 for every log10 increase in 25(OH)D]. In addition, there was no interaction effect of 25(OH)D * renal disease on NAFLD (p=0.24 [model 1]), indicating that patients with renal disease did not respond differently to 25(OH)D with regard to NAFLD risk compared to the overall cohort.
Table 2.
Logistic Regression
| Model | OR | 95% CI | P-value |
|---|---|---|---|
| Unadjusted | 0.35 | 0.21–0.60 | 0.0001 |
| Model 1: adjusted for BMI, history of diabetes, renal disease, peripheral vascular disease and liver diseases | 0.43 | 0.20–0.93 | 0.031 |
| Model 2: Model 1 + adjustment for hypertension | 0.25 | 0.10–0.96 | 0.022 |
BMI, body mass index; CI, confidence interval; OR, odds ratio.
DISCUSSION
In this case-control study, we have demonstrated for the first time that a lower serum 25(OH)D level is associated with the presence of NAFLD on ultrasound, independently of age, sex, race, season, BMI, history of diabetes mellitus, renal disease, peripheral vascular disease, liver diseases and hypertension in a large sample of U.S. adults. Whether evaluated as either a continous variable or categorized in clinically significant cut-offs, lower serum 25(OH)D level was independently associated with an increased odds of NAFLD. While the present study cannot draw any firm conclusions regarding causality, the association of lower serum 25(OH)D levels with NAFLD independent of numerous confounding factors suggests that inadequate 25(OH)D status might play a role in the development and/or progression of NAFLD.
Our results are consistent with recent observations of some smaller studies performed in Italy demonstrating that patients with NAFLD (as diagnosed by either ultrasound or biopsy) have significantly lower serum 25(OH)D levels than control subjects without steatosis [18] [19]. In fact, serum 25(OH)D level was inversely associated with NAFLD on ultrasound in 262 consecutive patients referred to the Diabetes and Metabolic Diseases clinics for metabolic evaluation, independent of metabolic syndrome features [18]. Furthermore, in 60 consecutive patients with biopsy-proven NAFLD (the majority of them with NASH) serum 25(OHD) level was significantly lower than in healthy controls matched for age, sex and BMI, and the histological severity of NAFLD was inversely associated with serum 25(OHD) levels, independent of potential confounding factors [19]. Our results extend these previous findings by demonstrating a strong, inverse relation between NAFLD and serum 25(OH)D levels: a) in a U.S. population derived from an integrated healthcare delivery system; b) in patients not being evaluated for the metabolic syndrome; c) in patients with less severe NAFLD, and d) in the largest sample size to date with NAFLD diagnosis by ICD9 code and liver ultrasound.
The underlying mechanisms accounting for the relation between low serum 25(OH)D levels and NAFLD have still not been fully elucidated. A plausible explanation for our findings is that the low levels of 25(OH)D found in NAFLD may simply reflect an ‘unhealthy’ lifestyle (inadequate diet or poor sunlight exposure), which itself promotes the development and progression of NAFLD, or, alternatively, the close association of NAFLD with age, obesity and diabetes, which also relate to severity of hypovitaminosis D. However, since serum 25(OH)D level was inversely associated with NAFLD, independently of these shared risk factors, it could also be hypothesized that inadequate vitamin D status might, at least in part, contribute to the development and progression of NAFLD.
Preliminary experimental evidence in rodents suggests that vitamin D deficiency may promote the development of NAFLD through increased inflammation. In fact, vitamin D deficiency in obese rats fed a Western diet exacerbates the development of NAFLD in part by increasing inflammation [28]. In contrast, when serum 25(OH)D levels are increased using UV light therapy, the progression of NAFLD in rats is slowed, as indicated by reduced histological evidence of inflammation [17]. Thus, experimental animal data are consistent with the possibility that a low serum 25(OH)D level might play a role in NAFLD pathogenesis, possibly via suppression of its anti-inflammatory properties. Indeed, chronic inflammation is considered a key factor in NAFLD progression [22, 24], with the severity of the hepatic disease relating to both circulating and intra-hepatic mRNA expression of several pro-inflammatory factors [5]. It has been hypothesized that increased visceral adiposity promotes the release of both free fatty acids and pro-inflammatory cytokines [15]. In turn, this causes activation of inflammation within the liver, possibly via increased nuclear factor κ B (NFκB) activity, thus promoting downstream transcription of pro-inflammatory cytokines and ultimately perpetuating a vicious cycle [2]. Increased levels of serum 25(OH)D might act to reduce the development/progression of NAFLD by countering these inflammatory processes.
Across various adult populations, lower serum 25(OH)D levels are associated with higher circulating markers of inflammation [7–10, 29], and vitamin D3 supplementation can effectively reduce these inflammatory markers, including C-reactive protein [9, 13, 30, 31], tumor necrosis factor-α [12] and interleukin-6 [31], and increase some anti-inflammatory cytokines, such as interleukin-10 [12]. In-vitro studies support the possibility that the anti-inflammatory effect of vitamin D3 may be mainly mediated by inhibition of the pro-inflammatory transcription factor NFκB [32–34]. This is consistent with the finding that inadequate 25(OH)D status in healthy adults is associated with increases in both vascular endothelial cell NFκB protein expression and vascular NFκB signaling [35]. Hence, low serum 25(OH)D levels may promote these inflammatory processes that are also involved in the development and progression of NAFLD.
An alternative explanation for our findings is that serum 25(OH)D level is possibly low in the presence of NAFLD due to impaired liver hydroxylation of vitamin D3 to 25(OH)D. However, recent findings support that CYP27A1 and CYP2R1 enzyme expression, as well as the ability to hydroxylize vitamin D3, are well persevered in NASH and do not contribute to lowered serum 25(OH)D levels [36]. Thus, it is unlikely that abnormal hepatic metabolism of vitamin D has any major contribution to our findings.
The present study has several strengths and limitations. While the results cannot show causality, they demonstrate a strong relation between lower serum 25(OH)D levels and the presence NAFLD diagnosed by ICD9 code and confirmed by liver ultrasound. These results are strengthened by the facts that the sample size was relatively large, cases and controls were well matched for age, sex, race and season of blood drawn (which are among the strongest determinants of serum 25(OH)D levels), and additional important confounding factors were included in our modeling. We recognize that we do not have complete data for the diagnosis of the metabolic syndrome in our multivariate regression models. However, the inclusion of BMI, diabetes and hypertension as covariates largely reflects the major components of the syndrome. While BMI and the prevalence of diabetes were significantly greater in NAFLD cases than matched controls, the prevalence of hypertension did not differ from cases. This is likely due to the high prevalence of hypertension in the controls, which would make it difficult to detect a difference from cases, who had a similar prevalence of hypertension to reports in other studies [37, 38].
Last, while liver biopsy is the gold standard for diagnosing NAFLD, it is not feasible to perform regularly in large epidemiological studies. As was the case in this study, liver ultrasound is most commonly used in clinical practice and has good sensitivity and specificity for detecting hepatic steatosis in individuals with moderate to severe NAFLD (>30% liver fat infiltration). Thus, some cases of NAFLD may have been misclassified as controls. In addition, since controls were selected on the basis of not having a diagnosis of NAFLD by ICD9 code and liver ultrasound was not performed in these patients to completely exclude hepatic steatosis, some additional cases of NAFLD may have been misclassified as controls. However, in both scenarios, the possible inclusion of some controls with NAFLD might have led to underestimation of the differences in serum 25(OH)D levels between cases and controls rather than the opposite, and therefore, we believe that it does not detract from the significance of our findings. We also acknowledge that previously recorded liver ultrasounds were analyzed by a single expert radiologist, rather than the original operator, which could potentially have limited accuracy. We do not feel that this is a significant limitation as this methodology is frequently employed in large population studies such as NHANES [39, 40], and ICD9 codes were used in addition to the diagnosis of NAFLD by liver ultrasound.
In conclusion, our results indicate that low serum 25(OH)D levels are associated with NAFLD, independent of age, sex, race, season of measurement, BMI, history of diabetes, renal disease, peripheral vascular disease, liver diseases and hypertension. Future studies are needed to prospectively determine if vitamin D supplementation reduces the development and progression of NAFLD, as well as the physiological mechanisms mediating any effects.
Acknowledgments
Source of Funding: This work was supported by the National Institute of Diabetes and Digestive and Kidney Diseases and the American Heart Association. MC and JK are supported by the National Institute of Diabetes and Digestive and Kidney Diseases (MC: 1R01 DK081473-01A, 1R01DK078112-01A2; JK: K23DK087859-01A1). KJ is supported by the American Heart Association (12POST11920023).
Footnotes
Publisher's Disclaimer: This is a PDF file of an unedited manuscript that has been accepted for publication. As a service to our customers we are providing this early version of the manuscript. The manuscript will undergo copyediting, typesetting, and review of the resulting proof before it is published in its final citable form. Please note that during the production process errors may be discovered which could affect the content, and all legal disclaimers that apply to the journal pertain.
References
- 1.Sung K, Kim S. Interrelationship between fatty liver and insulin resistance in the development of type 2 diabetes. J Clin Endocrinol Metab. 2011;96:1093–7. doi: 10.1210/jc.2010-2190. [DOI] [PMC free article] [PubMed] [Google Scholar]
- 2.Targher G, Chonchol M, Zoppini G, Abaterusso C, Bonora E. Risk of chronic kidney disease in patients with non-alcoholic fatty liver disease: Is there a link? J Hepatol. 2011;54:1020–9. doi: 10.1016/j.jhep.2010.11.007. [DOI] [PubMed] [Google Scholar]
- 3.Targher G, Day CP, Bonora E. Risk of cardiovascular disease in patients with nonalcoholic fatty liver disease. N Eng J Med. 2010;363:1341–50. doi: 10.1056/NEJMra0912063. [DOI] [PubMed] [Google Scholar]
- 4.Targher G, Marra F, Marchesini G. Increased risk of cardiovascular disease in non-alcoholic fatty liver disease: Causal effect or epiphenomenon? Diabetologia. 2008;51:1947–53. doi: 10.1007/s00125-008-1135-4. [DOI] [PubMed] [Google Scholar]
- 5.Targher G. Non-alcoholic fatty liver disease and cardiovascular disease risk. Curr Cardiovasc Risk Rep. 2010;4:32–9. [Google Scholar]
- 6.de Alwis N, Day C. Non-alcoholic fatty liver disease: The mist gradually clears. J Hepatol. 2008;48 (Suppl 1):S104–12. doi: 10.1016/j.jhep.2008.01.009. [DOI] [PubMed] [Google Scholar]
- 7.Ngo DT, Sverdlov AL, McNeil JJ, Horowitz JD. Does vitamin D modulate asymmetric dimethylarginine and C-reactive protein concentrations? Am J Med. 2010;123:335–41. doi: 10.1016/j.amjmed.2009.09.024. [DOI] [PubMed] [Google Scholar]
- 8.Dobnig H, Pilz S, Scharnagl H, Renner W, Seelhorst U, Wellnitz B, et al. Independent association of low serum 25-hydroxyvitamin d and 1,25-dihydroxyvitamin D levels with all-cause and cardiovascular mortality. Arch Intern Med. 2008;168:1340–9. doi: 10.1001/archinte.168.12.1340. [DOI] [PubMed] [Google Scholar]
- 9.Timms PM, Mannan N, Hitman GA, Noonan K, Mills PG, Syndercombe-Court D, et al. Circulating MMP9, vitamin D and variation in the TIMP-1 response with VDR genotype: Mechanisms for inflammatory damage in chronic disorders? QJM. 2002;95:787–96. doi: 10.1093/qjmed/95.12.787. [DOI] [PubMed] [Google Scholar]
- 10.Richards JB, Valdes AM, Gardner JP, Paximadas D, Kimura M, Nessa A, et al. Higher serum vitamin D concentrations are associated with longer leukocyte telomere length in women. Am J Clin Nutr. 2007;86:1420–5. doi: 10.1093/ajcn/86.5.1420. [DOI] [PMC free article] [PubMed] [Google Scholar]
- 11.Van den Berghe G, Van Roosbroeck D, Vanhove P, Wouters PJ, De Pourcq L, Bouillon R. Bone turnover in prolonged critical illness: effect of vitamin D. J Clin Endocrinol Metab. 2003;88:4623–32. doi: 10.1210/jc.2003-030358. [DOI] [PubMed] [Google Scholar]
- 12.Schleithoff S, Zittermann A, Tenderich G, Berthold H, Stehle P, Koerfer R. Vitamin D supplementation improves cytokine profiles in patients with congestive heart failure: a double-blind, randomized, placebo-controlled trial. Am J Clin Nutr. 2006;83:754–9. doi: 10.1093/ajcn/83.4.754. [DOI] [PubMed] [Google Scholar]
- 13.Matias PJ, Jorge C, Ferreira C, Borges M, Aires I, Amaral T, et al. Cholecalciferol supplementation in hemodialysis patients: effects on mineral metabolism, inflammation, and cardiac dimension parameters. Clin J Am Soc Nephrol. 2010;5:905–11. doi: 10.2215/CJN.06510909. [DOI] [PMC free article] [PubMed] [Google Scholar]
- 14.Cigolini M, Lagulli MP, Miconi V, Galiotto M, Lombardi S, Targher G. Serum 25-hydroxyvitamin D3 concentrations and prevalence of cardiovascular disease among type 2 diabetic patients. Diabetes Care. 2006;29:722–4. doi: 10.2337/diacare.29.03.06.dc05-2148. [DOI] [PubMed] [Google Scholar]
- 15.Targher G, Chonchol M, Miele L, Zoppini G, Pichiri I, Muggeo M. Nonalcoholic fatty liver disease as a contributor to hypercoagulation and thrombophilia in the metabolic syndrome. Semin Thromb Hemost. 2009;35:277–87. doi: 10.1055/s-0029-1222606. [DOI] [PubMed] [Google Scholar]
- 16.Roth CL, Elfers CT, Figlewicz DP, Melhorn SJ, Morton GJ, Hoofnagle A, et al. Vitamin D deficiency in obese rats exacerbates nonalcoholic fatty liver disease and increases hepatic resistin and toll-like receptor activation. Hepatology. 2011 doi: 10.1002/hep.24737. [DOI] [PubMed] [Google Scholar]
- 17.Barchetta I, Angelico F, Del Ben M, Baroni MG, Pozzilli P, Morini S, et al. Strong association between non alcoholic fatty liver disease (NAFLD) and low 25(OH) vitamin D levels in an adult population with normal serum liver enzymes. BMC Med. 2011;9:85. doi: 10.1186/1741-7015-9-85. [DOI] [PMC free article] [PubMed] [Google Scholar]
- 18.Targher G, Bertolini L, Scala L, Cigolini M, Zenari L, Falezza G, et al. Associations between serum 25-hydroxyvitamin D3 concentrations and liver histology in patients with non-alcoholic fatty liver disease. Nutr Metab Cardiovasc Dis. 2007;17:517–24. doi: 10.1016/j.numecd.2006.04.002. [DOI] [PubMed] [Google Scholar]
- 19.Intermountain Healthcare. [Accessed September 12, 2012];Annual Report. 2009 Available at: http://intermountainhealthcare.org/about/overview/annualreport2009.pdf.
- 20.Clinical Modification Codes. 2009. Medical Association Hospital International Classification of Diseases, 9th Revision. [Google Scholar]
- 21.Adams LA, Angulo P, Lindor KD. Nonalcoholic fatty liver disease. CMAJ. 2005;172:899–905. doi: 10.1503/cmaj.045232. [DOI] [PMC free article] [PubMed] [Google Scholar]
- 22.Targher G, Bertolini L, Poli F, Rodella S, Scala L, Tessari R, et al. Nonalcoholic fatty liver disease and risk of future cardiovascular events among type 2 diabetic patients. Diabetes. 2005;54:3541–6. doi: 10.2337/diabetes.54.12.3541. [DOI] [PubMed] [Google Scholar]
- 23.Day CP. Non-alcoholic fatty liver disease: current concepts and management strategies. Clin Med. 2006;6:19–25. doi: 10.7861/clinmedicine.6-1-19. [DOI] [PMC free article] [PubMed] [Google Scholar]
- 24.Targher G, Bertolini L, Padovani R, Zenari L, Zoppini G, Falezza G. Relation of nonalcoholic hepatic steatosis to early carotid atherosclerosis in healthy men: role of visceral fat accumulation. Diabetes Care. 2004;27:2498–500. doi: 10.2337/diacare.27.10.2498. [DOI] [PubMed] [Google Scholar]
- 25.Mehrotra R, Kermah DA, Salusky IB, Wolf MS, Thadhani RI, Chiu YW, et al. Chronic kidney disease, hypovitaminosis D, and mortality in the United States. Kidney Int. 2009;76:977–83. doi: 10.1038/ki.2009.288. [DOI] [PMC free article] [PubMed] [Google Scholar]
- 26.Charlson M, Szatrowski TP, Peterson J, Gold J. Validation of a combined comorbidity index. J Clin Epidemiol. 1994;47:1245–51. doi: 10.1016/0895-4356(94)90129-5. [DOI] [PubMed] [Google Scholar]
- 27.Pequeriaux NC, Fijnheer R, Gemen EF, Barendrecht AD, Dekker FW, Krediet RT, et al. Plasma concentration of von Willebrand factor predicts mortality in patients on chronic renal replacement therapy. Nephrol Dial Transplant. 2012;27:2452–7. doi: 10.1093/ndt/gfr735. [DOI] [PubMed] [Google Scholar]
- 28.Nakano T, Cheng YF, Lai CY, Hsu LW, Chang YC, Deng JY, et al. Impact of artificial sunlight therapy on the progress of non-alcoholic fatty liver disease in rats. J Hepatol. 2011;55:415–25. doi: 10.1016/j.jhep.2010.11.028. [DOI] [PubMed] [Google Scholar]
- 29.Bellia A, Garcovich C, D’Adamo M, Lombardo M, Tesauro M, Donadel G, et al. Serum 25-hydroxyvitamin D levels are inversely associated with systemic inflammation in severe obese subjects. Intern Emerg Med. 2011 doi: 10.1007/s11739-011-0559-x. [DOI] [PubMed] [Google Scholar]
- 30.Alborzi P, Patel NA, Peterson C, Bills JE, Bekele DM, Bunaye Z, et al. Paricalcitol reduces albuminuria and inflammation in chronic kidney disease: A randomized double-blind pilot trial. Hypertension. 2008;52:249–55. doi: 10.1161/HYPERTENSIONAHA.108.113159. [DOI] [PubMed] [Google Scholar]
- 31.Bucharles S, Barberato SH, Stinghen AE, Gruber B, Piekala L, Dambiski AC, et al. Impact of cholecalciferol treatment on biomarkers of inflammation and myocardial structure in hemodialysis patients without hyperparathyroidism. J Ren Nutr. 2012;22:284–91. doi: 10.1053/j.jrn.2011.07.001. [DOI] [PubMed] [Google Scholar]
- 32.Equils O, Naiki Y, Shapiro AM, Michelsen K, Lu D, Adams J, et al. 1,25-Dihydroxyvitamin D inhibits lipopolysaccharide-induced immune activation in human endothelial cells. Clin Exp Immunol. 2006;143:58–64. doi: 10.1111/j.1365-2249.2005.02961.x. [DOI] [PMC free article] [PubMed] [Google Scholar]
- 33.Suzuki Y, Ichiyama T, Ohsaki A, Hasegawa S, Shiraishi M, Furukawa S. Anti-inflammatory effect of 1alpha,25-dihydroxyvitamin D(3) in human coronary arterial endothelial cells: Implication for the treatment of Kawasaki disease. J Steroid Biochem Mol Biol. 2009;113:134–8. doi: 10.1016/j.jsbmb.2008.12.004. [DOI] [PubMed] [Google Scholar]
- 34.Tan X, Wen X, Liu Y. Paricalcitol inhibits renal inflammation by promoting vitamin D receptor-mediated sequestration of NF-kappaB signaling. Journal of the American Society of Nephrology: JASN. 2008;19:1741–52. doi: 10.1681/ASN.2007060666. [DOI] [PMC free article] [PubMed] [Google Scholar]
- 35.Jablonski KL, Chonchol M, Pierce GL, Walker AE, Seals DR. 25-Hydroxyvitamin D deficiency is associated with inflammation-linked vascular endothelial dysfunction in middle-aged and older adults. Hypertension. 2011;57:63–9. doi: 10.1161/HYPERTENSIONAHA.110.160929. [DOI] [PMC free article] [PubMed] [Google Scholar]
- 36.Barchetta I, Carotti S, Labbadia G, Vespasiani G, Onetti Muda A, Angelico F, et al. Liver VDR, CYP2R1 and CYP27A1 expression: relationship with liver histology and vitamin D3 levels in patients with NASH or HCV hepatitis. Hepatology. 2012 doi: 10.1002/hep.25930. [DOI] [PubMed] [Google Scholar]
- 37.Kirovski G, Schacherer D, Wobser H, Huber H, Niessen C, Beer C, et al. Prevalence of ultrasound-diagnosed non-alcoholic fatty liver disease in a hospital cohort and its association with anthropometric, biochemical and sonographic characteristics. Int J Clin Exp Med. 2010;3:202–10. [PMC free article] [PubMed] [Google Scholar]
- 38.Williams CD, Stengel J, Asike MI, Torres DM, Shaw J, Contreras M, et al. Prevalence of nonalcoholic fatty liver disease and nonalcoholic steatohepatitis among a largely middle-aged population utilizing ultrasound and liver biopsy: a prospective study. Gastroenterology. 2011;140:124–31. doi: 10.1053/j.gastro.2010.09.038. [DOI] [PubMed] [Google Scholar]
- 39.Younossi ZM, Otgonsuren M, Venkatesan C, Mishra A. In patients with Non-Alcoholic Fatty Liver Disease (NAFLD), metabolically abnormal individuals are at a higher risk for mortality while metabolically normal individuals are not. Metabolism. 2012 doi: 10.1016/j.metabol.2012.08.005. [DOI] [PubMed] [Google Scholar]
- 40.Younossi ZM, Stepanova M, Negro F, Hallaji S, Younossi Y, Lam B, et al. Nonalcoholic fatty liver disease in lean individuals in the United States. Medicine. 2012;91:319–27. doi: 10.1097/MD.0b013e3182779d49. [DOI] [PubMed] [Google Scholar]