Abstract
The prevalence of childhood obesity has risen dramatically and coincident with this upsurge is a growth in adverse childhood psychological conditions including impulsivity, depression, anxiety and attention deficit/hyperactive disorder (ADHD). Due to confounds that exist when determining causality of childhood behavioral perturbations, controversy remains as to whether overnutrition and/or childhood obesity is important. Therefore, we examined juvenile mice to determine if biobehaviors were impacted by a short-term feeding (1–3 wks) of a high-fat diet (HFD). After 1 wk of a HFD feeding, mouse burrowing and spontaneous wheel running were increased while mouse exploration of the open quadrants of a zero maze, perfect alternations in a Y-maze and recognition of a novel object were impaired. Examination of mouse cortex, hippocampus and hypothalamus for dopamine and its metabolites demonstrated increased homovanillic acid (HVA) concentrations in the hippocampus and cortex that were associated with decreased cortical BDNF gene expression. In contrast, pro-inflammatory cytokine gene transcripts and serum IL-1α, IL-1β, TNF-α and IL-6 were unaffected by the short-term HFD feeding. Administration to mice of the psychostimulant methylphenidate prevented HFD-dependent impairment of learning/memory. HFD learning/memory impairment was not inhibited by the anti-depressants desipramine or reboxetine nor was it blocked in IDO or IL-1R1 knockout mice. In sum, a HFD rapidly impacts dopamine metabolism in the brain appearing to trigger anxiety-like behaviors and learning/memory impairments prior to the onset of weight gain and/or pre-diabetes. Thus, overnutrition due to fats may be central to childhood psychological perturbations such as anxiety and ADHD.
Keywords: catechol-O-methyltransferase; indoleamine 2,3 dioxygenase; monoamine oxidase; type 2 diabetes; forced swim test; depressive-like behavior
Introduction
In humans, obesity impacts a variety of biobehaviors especially mood and cognition (Elias et al., 2003; Elias, et al., 2005; Bruce-Keller et al., 2009; Cserjesi et al., 2009) but how obesity impairs these brain-based functions remains unclear. What is known is that intake of excess dietary fat is coupled to overnutrition which predisposes to the development of obesity and its complications (Lissner and Heitmann 1995; Astrup 1999). In mice, high fat diet (HFD) feeding has been extensively used to model the human diet-induced obese state (Surwit et al., 1988; Buettner et al., 2007) and, as in humans, a key outcome of mouse HFD feeding is inflammation in liver and adipose tissue (Li et al., 2008). This HFD-dependent pro-inflammatory state has been postulated to cause many of the adverse biobehaviors seen in obesity/diabesity, but brain-based inflammation caused by a HFD has been very difficult to demonstrate outside of the hypothalamus (Soczynska et al., 2011). Furthermore, cytokine-related sickness symptoms like reduced social exploration, loss of appetite with weight loss and depressive-like behaviors are not clearly seen in obese/diabese humans or rodents (Lavin et al., 2011; Soczynska et al., 2011). Therefore, mechanisms distinct from the brain-cytokine system may be responsible for the mood and cognitive dysfunctions associated with the obese state.
Previously, obesity-associated brain-based disorders were thought to be a consequence of type 2 diabetes (T2D) and, as with T2D-linked cognitive decline, take significant time to manifest often blending with age-related and/or Alzheimer-like neurodegeneration (Arvanitakis et al., 2004; Hassing et al., 2004). However, very recent studies in human adults indicate that short-term feedings of a HFD can impair attention (Edwards et al., 2011) and visual memory (Bayer-Carter et al., 2011). Furthermore, epidemiologic studies have identified childhood obesity as a risk factor for psychological maladies such as, attention deficit hyperactivity disorder (ADHD), impulsivity, depression and anxiety (Bazar et al., 2006; Cortese and Morcillo Penalver 2010; Davis 2010; Puder and Munsch 2010; Smith et al., 2011). These studies have also found a negative association between childhood obesity and performance on tests of executive function and attention (Smith et al., 2011).
Common to both ADHD and the overweight/obese state is altered dopaminergic signaling in the brain. In general, brain biochemistry associated with overeating is not well understood, but in humans body mass index inversely correlates with brain dopamine 2 receptor (D2R) availability (Wang et al., 2001). In rats, a down-regulation of striatal DR2s is linked to compulsive eating and generates a phenotype similar to addiction-like neuroadaptation (Johnson and Kenny 2010). Similarly, ADHD is allied with perturbed brain-based dopaminergic signaling in children (Nieoullon 2002; Guxens et al., 2009). Thus, stimulants like methylphenidate which increase catecholamines in the brainstem, midbrain and cortex appear critical to the increased attention span and concentration afforded children treated for ADHD (Rapport et al., 1994; Wolraich et al., 2001). Due to the epidemiologic overlap between ADHD and the development of the childhood obese state, we examined the short-term behavioral impact of a HFD on young mice and explored the mechanism by which a HFD perturbed behavior.
Methods
Materials
All reagents and chemicals were purchased from Sigma-Aldrich (St Louis, MO) except as noted. All primers were purchased from Applied Biosystems (Foster City, CA).
Animals
Animal use was conducted in accordance with Institutional Animal Care and Use Committee approved protocols at the University of Illinois. C57BL/6J male mice (3-wk old) were purchased from Jackson Laboratories (Bar Harbor, ME). IL1R1 knockout (KO) and indoleamine 2,3 dioxygenase (IDO) KO male mice were bred in house and weaned at 3 wks of age. Mice were group-housed (4–8 per cage) in large standard shoebox cages (length 28 cm; width 17 cm; height 12.5 cm) and allowed free access to food and water. Housing temperature (72°F) and humidity (45–55%) were controlled, as was a 12/12 h reversed dark-light cycle (2200-1000 h). All behavioral studies except for elevated zero-maze were conducted under red light. All behavioral, biochemical and genomic experiments were performed on separate cohorts of mice that were examined at either 1 wk or 3 wks of diet with the following exceptions. The diet switching study was performed on a single cohort. Body weight and blood glucose were performed on a single cohort. Serum cytokines and brain MAO-A/-B activity both used the same1 wk and 3 wk cohort. The total number of mice utilized was 200.
Diets, weight and fasting blood glucose
From weaning (3 wks of age), mice were fed open source uniform-base diets containing either 10% calories from fat (LFD) (D12450B, Research Diets, New Brunswick, NJ) or 60% calories from fat (HFD) (D12492, Research Diets, New Brunswick, NJ) (Lavin, et al 2011). Both diets contained 20% kcal from protein (casein). The LFD contained 70% kcal from carbohydrates (corn starch) and 10% calories from fat (soybean oil + lard). The HFD contained 20% kcal from carbohydrates (corn starch) and 60% calories from fat (soybean oil + lard). Mouse weight was recorded weekly using an Adventurer Pro digital scale (Ohaus, Parsippany, NJ). Tail (12 h) blood glucose testing was recorded weekly using an Abbott FreeStyle Freedom blood glucose monitor (Abbott Park, IL) (Lavin et al., 2011).
Injectables
Reboxetine (1 mg/kg/mouse), desipramine (1 mg/kg/mouse) or methylphenidate (2.5 mg/kg/mouse) (Medisca, Quebec, Canada) were administered IP 45 min prior to novel object training. The injectables were administered 45 min prior to training based on our previous work with similar antidepressants and catecholamines (Park et al., 2011).
Locomotion
At the times indicated, spontaneous locomotor activity was measured by video recording mice in their home cage for 5 min (York et al., 2012a). Distance and velocity moved was quantified using EthoVision XT 7 video tracking software (Noldus Information Technology, Leesburg, VA)
Burrowing
Mice were individually housed overnight in the presence of a burrow (20 cm long polyvinyl chloride (PVC) piping capped at one and raised 1.3 cm at the open end) (Lavin et al., 2011). Testing was initiated by adding 100 g of food pellets to the burrow. Water was provided ad libitum, but food was only available from the burrow. Mice were allowed to interact with the filled burrow for 30 min. Amount burrowed was determined from weight of burrow + food before and after burrowing.
Wheel running
Spontaneous wheel running was measured as we have described (York et al., 2012a). At the times indicated, mice were individually housed in standard sized cages containing a stainless steel running wheel (Mini-Mitter, Bend, OR). Wheel turn data were collected telemetrically using VitalView Software (Mini-Mitter). Data were collected for 24 h. Data are presented as total wheel turns/day.
Novel Object Recognition
Mice were individually housed overnight in a home cage-sized acclimation arena containing two identical objects (acclimation). Mice were then individually transferred from the acclimation arena to a large rat cage-sized memory arena (26 cm × 48 cm × 21 cm) containing 2 objects identical to those used during acclimation (training). Investigative behavior of the objects was video recorded for 5 min. Mice were then returned to the acclimation arena sans objects for 1 hr. Mice (individually) were transferred back to the memory arena now containing one familiar object and one unfamiliar object (novel object) (testing). Investigative behavior of the objects was video recorded for 5 min and evaluated by hand scoring. Percent investigation was calculated by dividing the time spent examining each object by the total time spent investigating both object (York et al., 2012a).
Spontaneous Alternation (Y-maze)
Mice were individually housed overnight. Testing was initiated by placing the subject mouse into one of the 3 maze arms. The Y-maze used was symmetrical, clear and Plexiglas (arms = 40 cm in length × 9 cm in width × 16 cm in wall height with an arm angle of 120°). Maze bottom was blue and side walls were decorated with black triangles, black circles, or black diagonal lines. Movement was video recorded for 5 min. Arm entry required all 4 legs of the subject mouse to enter an arm. Perfect alternations were defined as exploration of all three arms sequentially given 3 opportunities independent of a right or left arm choice at initiation. Imperfect alternations were defined as entry into all three arms in 4 opportunities. Results were calculated as the number of perfect or imperfect alternations divided by total opportunities (York et al., 2012a).
Elevated Zero-Maze
Mice were transferred from their home cage to the high wall section of a zero maze (maze dimensions: 40 cm inner diameter, 6 cm track, 72 cm from the floor). The maze was equally divided into 4 quadrants, 2 of which had high walls (14 cm). Movement was video recorded for 5 min. Exploratory behavior was considered as time spent in the non-high wall area including stretch-attend postures (Park et al., 2011; York et al., 2012a).
Forced swim test
The subject mouse was transferred from its home cage to a clean white cylindrical PVC container (diameter 16 cm; height 31 cm) containing 15 cm of water maintained at 25 ± 1° C. Total swim duration was 6 minutes, and immobility was evaluated from the video record by hand scoring from the final 5 min of the test (Park et al., 2011).
Quantitative PCR (qPCR)
Brain regions were dissected from PBS perfused whole brains and RNA was isolated (York et al., 2012b). RNA was reverse transcribed using the High-Capacity cDNA Reverse Transcription Kit (PN 4368813) (Applied Biosystems). The TaqMan Gene Expression primers used were: F4/80 (Mm00802529_m1), IL-1α (Mm99999060_m1), IL-1β (Mm99999061_mH), IL1R1 (Mm00434237_m1), IL1R2 (Mm00439622_m1), IL1RA (Mm01337566_m1), IL-6 (Mm01210733_m1), CD11b (Mm00434455_m1), tumor necrosis factor-α (TNF-α) (Mm00443258_m1), CD45 (Mm00448490_m1), brain derived neurotrophic factor (BDNF) (MM01334042_m1), nerve growth factor (NGF) (Mm00443039_m1), catechol-O-methyltransferase (COMT) Mm00514377_m1, monoamine oxidase-A (MAO-A) Mm00558004_m1 and MAO-B, Mm00555412_m1. qPCR was performed on a 7900 HT Fast Real-Time PCR System (Applied Biosystems) using TaqMan Universal PCR Master Mix (Applied Biosystems). To compare gene expression, a parallel amplification of endogenous RPS3 (Mm00656272_m1) was performed. Reactions with no reverse transcription and no template were included as negative controls. Relative quantitative evaluation of target gene to RPS3 was performed by comparing ΔCts, where Ct is the threshold concentration.
Dopamine (DA), dihydroxyphenylacetic acid (DOPAC) and homovanillic acid (HVA) HPLC
Similar to methods we have described (O'Connor et al., 2009b), mouse brain regions were solubilized in extraction buffer (0.1 N HClO4 and 25 µM ascorbate) using an ultrasonic tissue disruptor (Sonics & Materials, Inc., Newtown, CT). Homogenized brains were centrifuged at 12,000 × g for 5 minutes at 4° C. Supernatants were then filtered at 12,000 × g for 5 minutes at 4° C using Costar Spin-X centrifuge tube filters (0.2 µm) (Corning, Corning, NY). Filtrates were diluted in 0.02 N HClO4. DA, DOPAC and HVA were analyzed by HPLC on an ESA Coulochem III detector with a 5041 Enhanced Analytical cell containing a glassy carbon electrode (+320 mV) (Thermo Scientific, Sunnyvale, CA). Mobile phase (pH = 3.0) consisted of 75 mM NaH2PO4, 25 µM EDTA (disodium salt), 0.45 mM octanesulfonic acid and triethylamine in acetonitrile:water (6:94 v:v). Protein concentrations were derived from the pellets from which the supernatants were used for HPLC. In brief, pellets were re-suspended in RIPA buffer (150 mM NaCl, 5 mM EDTA, 0.1% SDS, 1% Triton and 10 mM Tris, pH 7.4) using a 60 Sonic Dismembrator (Fisher Scientific, Pittsburg, PA). Proteins were determined using a DC Protein Assay Kit (BioRad, Hercules, CA) and an ELx800 Absorbance Microplate Reader (BioTek, Winooski, VT). Results were expressed as ng DA, DOPAC and HVA/mg brain region protein.
MAO activity
PBS perfused brain regions (as indicated) were frozen in liquid nitrogen then freeze fractured in reaction buffer containing 50 mM NaCl (Fisher Scientific, Fair Lawn, NJ), 10% glycerol, 1 mM EDTA, 50 mM HEPES, pH 7.4 (USB Corporation, Cleveland, OH) using the TissueLyser II (Qiagen, Valencia, CA) at a rotational frequency of 30/sec for 2 min. Lysates were clarified at 16,000 × g for 15 min at 4° C and the supernatant protein concentrations determined using the DC Protein Assay (Bio-Rad, Hercules, CA) and a ELx800 Absorbance Microplate Reader (BioTek Instrument, Winooski, VT). Supernatant protein concentrations were normalized within regions with reaction buffer. MAO activity was determined utilizing the MAO-Glo Assay System (Promega, Madison, WI). In brief, samples were incubated with the kit-provided substrate for 1 hr and the methyl ester luciferin/luciferase reaction was quantified using an ImageQuant LAS-4000 CCD camera quantitative imager (GE Healthcare, Piscataway, NJ) coupled to Multi Guage Software (GE Healthcare, Piscataway, NJ).
Serum cytokines
IL-1α, IL-1β, TNF-α and IL-6 were measured in 25 µL of serum using a Millipore Milliplex MAP kit (Billerica, MA) following manufactures instructions. Antibody immobilized beads were detected on a Luminex 100 System (Austin, TX).
Statistical analysis
Data analysis was conducted using Sigma Plot 11.2 (Systat Software, Chicago, IL). Body weight, blood glucose, and behavioral data were subjected to 1-way analysis of variance (ANOVA) to determine the main effects of diet (LFD or HFD) followed by Tukey adjustment. When normality failed (P<0.05), the Kruskal-Wallis 1-way analysis of variance or Friedman’s 2-way ANOVA were performed followed by a Tukey adjustment when group size was equal and a Dunn’s adjustment in cases where group size was not equal. Novel object recognition involving knockout mice or drug injections were subjected to a 2-way analysis of variance to test for the main effects of diet and treatment (phenotype or drug) followed by a Tukey adjustment. qPCR data were analyzed using a 2-way ANOVA. Statistical significance was assumed at P<0.05 and all data are presented as means ± SEM.
Results
HFD feeding for 1 wk causes anxiety-like behaviors and impaired memory without impacting blood glucose or body weight
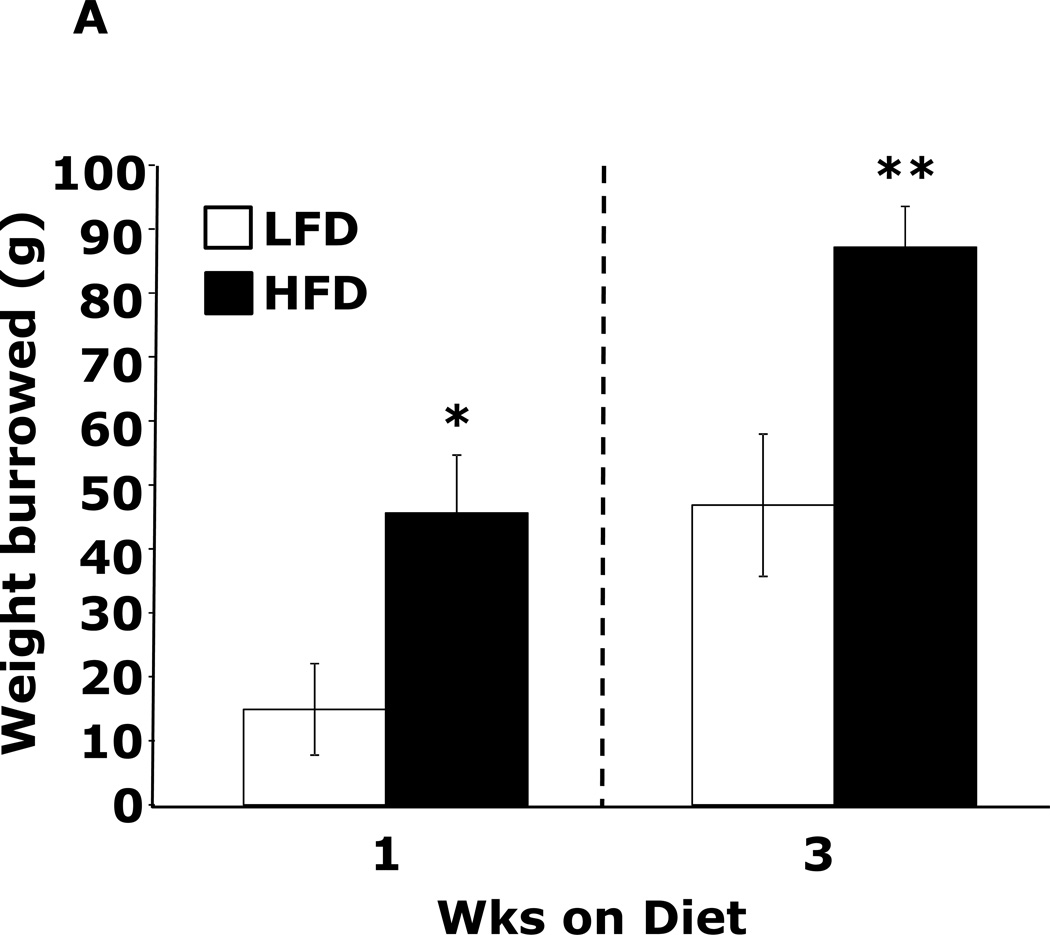
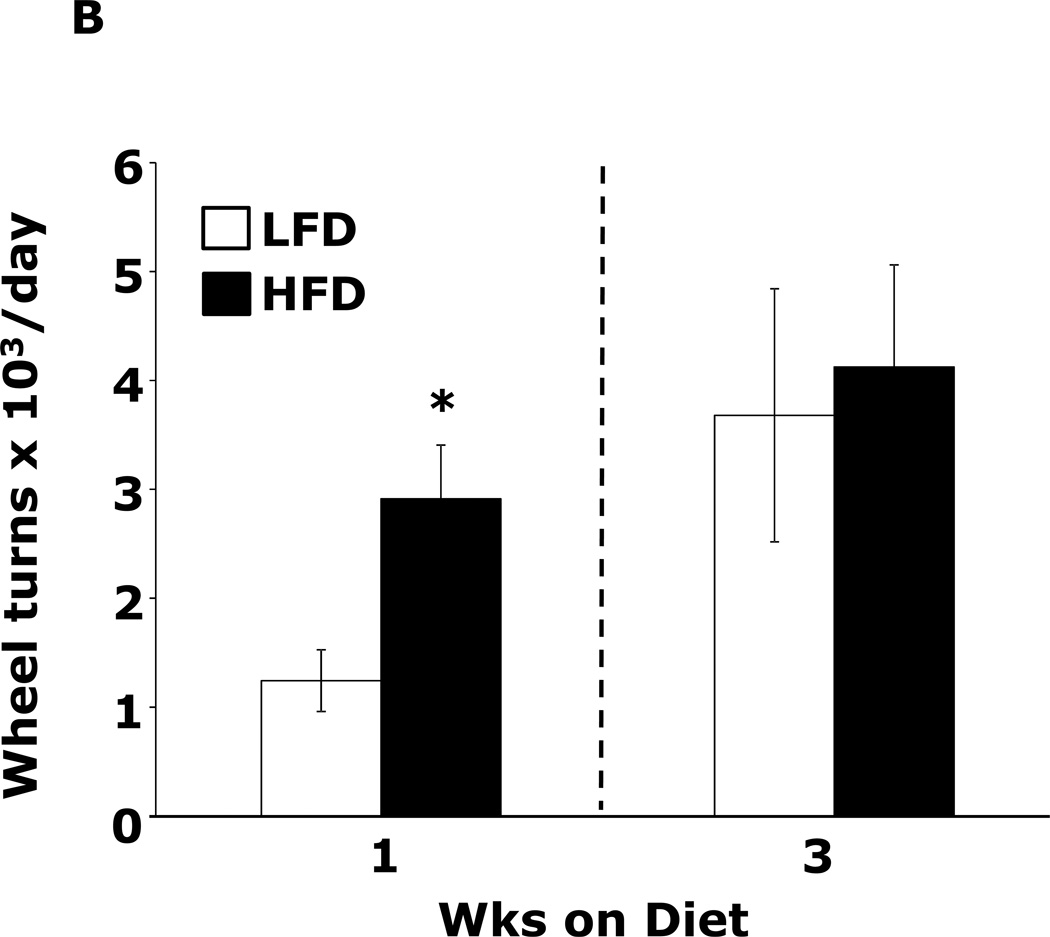
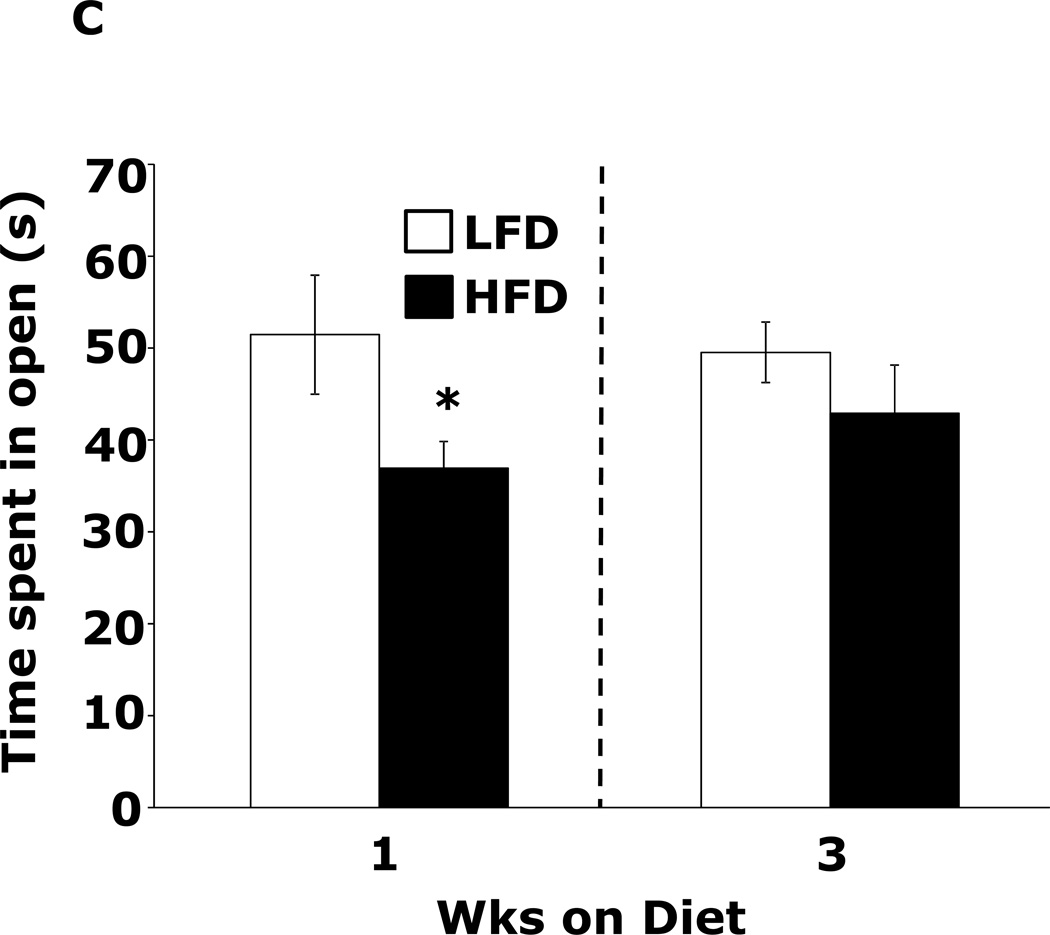
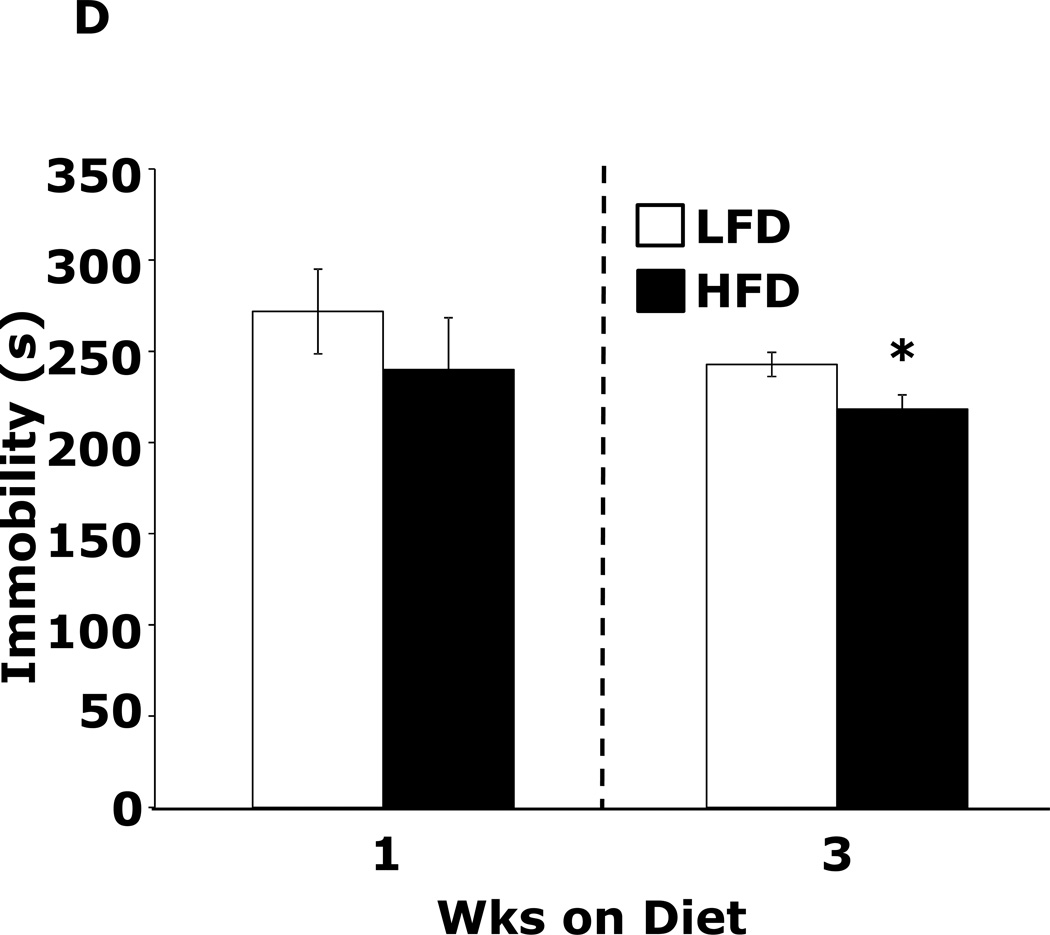
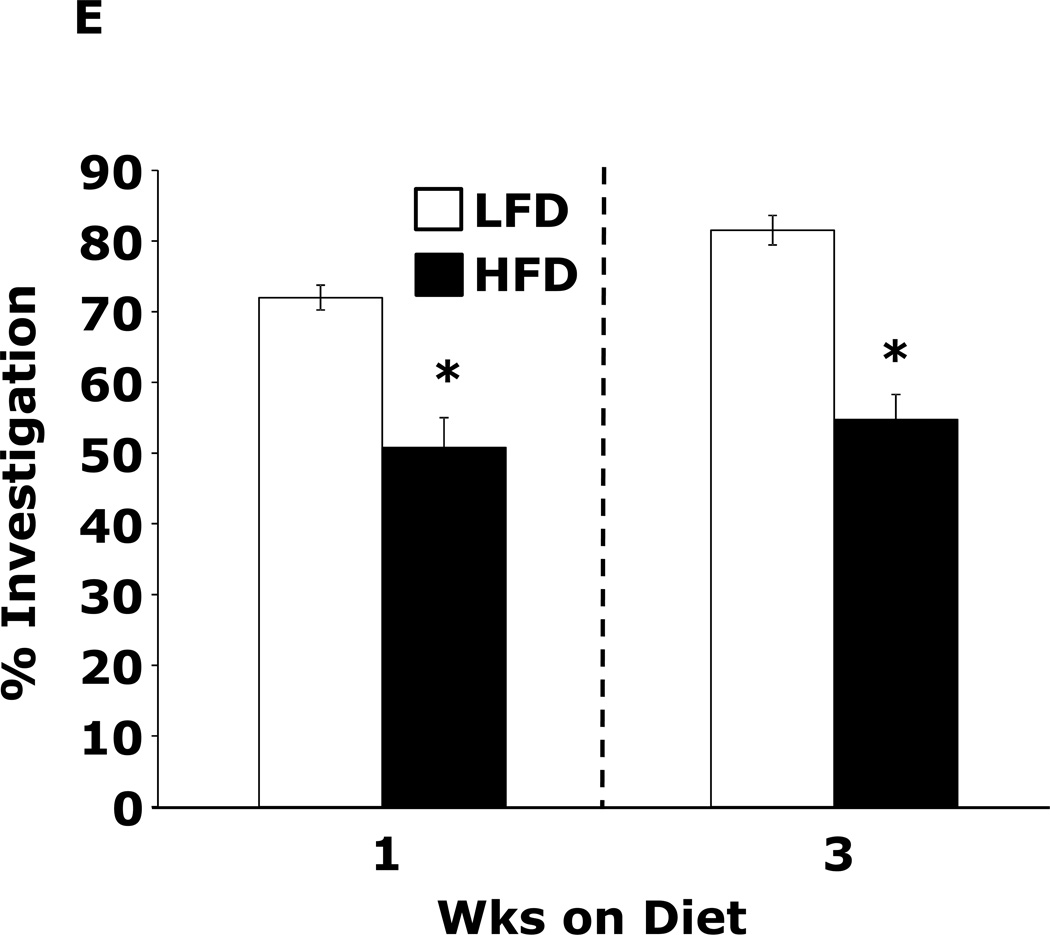
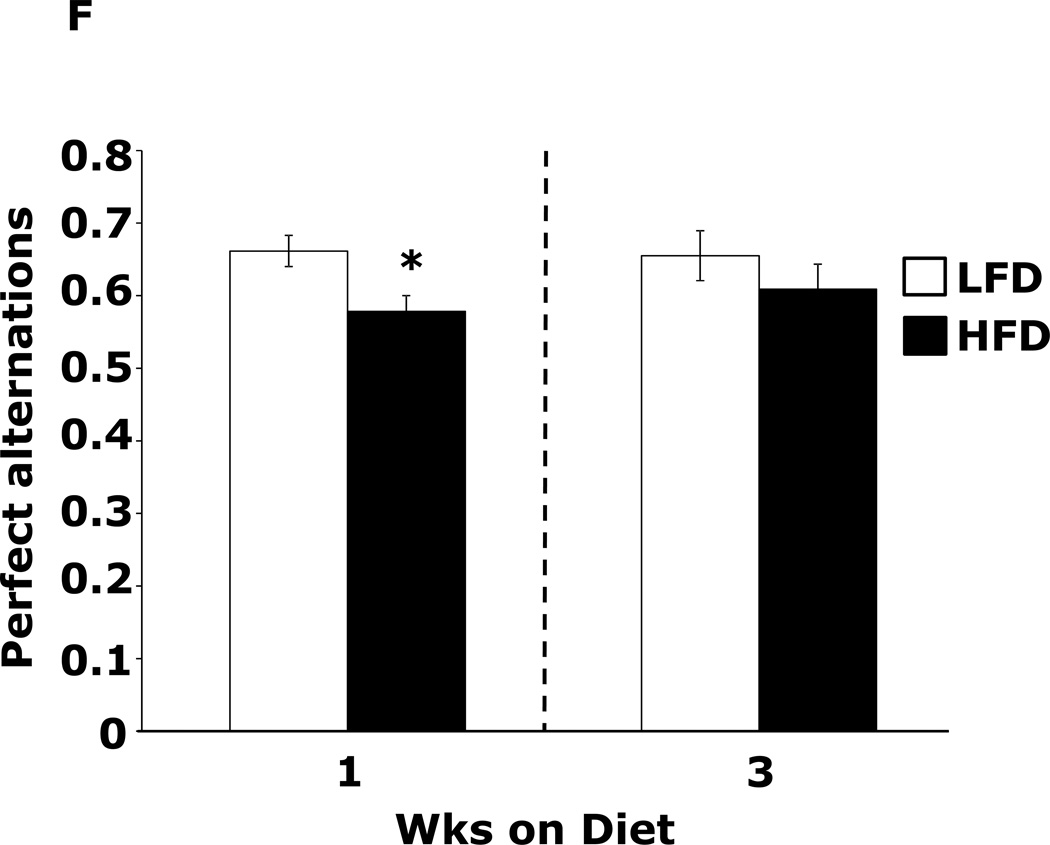
Table 1 demonstrates that mice fed a HFD vs. a LFD for 2 and 3 wks had, respectively, a 35% and 54% increase in fasting blood glucose. HFD feeding for 1 wk did not impact blood glucose. After 3 wks of a HFD, mice body weights were increased 13%. At 1 wk and 2 wks days, body weight was not significantly different between HFD- and LFD-fed mice. Fig.1A shows that mice fed a HFD vs. a LFD for 1 and 3 wks had, respectively, a 200% (45.61 ± 9.04 g vs. 14.91 ± 7.15 g, p ≤ 0.01) and 86% (87.19 ± 6.35 g vs. 46.83 ± 11.12 g, p ≤ 0.03) increase in burrowing behavior. Spontaneous locomotor activity (distance moved or velocity) was not affected by feeding mice a HFD vs. a LFD at 1 or 3 wks (data not shown). Spontaneous wheel running (Fig.1B) was increased 134% in mice fed a HFD for 1 wk (2914 ± 492 wheel turns vs. 1242 ± 283 wheel turns, p ≤ 0.001) but not after 3 wks. Fig.1C demonstrates that mice fed a LFD vs. a HFD for 1 wk had a 30% (52.46 ± 6.48 sec vs. 36.91±2.90 sec, p ≤ 0.05) decrease in time spent in the open areas of an elevated zero maze. After 3 wks, HFD- and LFD-fed mice were comparable. Fig.1D shows that a HFD feeding for 1 wk did not impact performance in the forced swim test. However, mice fed a HFD for 3 wks were 12.5% less immobile (243.11 ± 19.85 sec vs. 212.82 ± 14.8 sec, p ≤ 0.02). Fig.1E demonstrates that exploration of a novel object over a familiar object was absent in mice fed a HFD vs. a LFD at both 1 and 3 wks (72.00 ± 1.75% and 81.50 ± 22.09% vs. 50.80 ± 4.21% and 54.76 ± 3.55%, p ≤ 0.001). Fig.1F demonstrates that mice fed a HFD vs. a LFD for 1 wk had a 13% decrease in Y-maze perfect alternations (0.58 ± 0.03 vs. 0.66 ± 0.02, p ≤ 0.02) but, after 3 wks of feeding, Y-maze performance between diet groups was comparable. HFD-feeding had no impact on total arm entries or imperfect alternations at either 1 or 3 wks (data not shown).
Table 1.
Body weight (g) and fasting blood glucose (mg/dL) of mice fed a low-fat (LFD) or high-fat (HFD) diet
| Time on diet | ||||||
|---|---|---|---|---|---|---|
| 1 week | 2 weeks | 3 weeks | ||||
| Diet | weight | glucose | weight | glucose | weight | glucose |
| LFD | 17.2 ± 0.6 | 105.6 ± 9.2 | 18.2 ± 0.6 | 109.7 ± 11.6a | 19.8 ± 0.6a | ×95.2 ± 8.6a |
| HFD | 18.6 ± 0.9 | 108.9 ± 5.4 | 20.2 ± 0.8 | 148.4 ± 7.9b | 22.3 ± 0.1b | 147.2 ± 9.7b |
Results are expressed as mean ± SEM, n=8 per group. One-way ANOVA revealed main effect of diet (P<0.001). Letters within columns indicate significant differences.
Figure.1. HFD feeding for 1 wk causes anxiety-like behaviors and impaired memory.
Wild type mice were fed a LFD or HFD for 1 or 3 wks. (A) Burrowing behavior was measured for 30 min. Results are expressed as amount of material removed from the burrow, means ± SEM; n = 8–11. *P ≤ 0.01, **P ≤ 0.03. (B) Voluntary wheel running was measured for 24 h. Results are expressed as wheel turns, means ± SEM; n = 16. *P ≤ 0.001. (C) Exploration of an elevated zero maze was measured for 5 min. Results are expressed as time spent in the open areas of the maze, means ± SEM; n = 15–16. *P ≤ 0.05. (D) Movement during the forced swim test was measured for 5 min. Results are expressed as time spent immobile, means ± SEM; n = 16. *P ≤ 0.02. (E) Exploration of a familiar and novel object were measured for 5 min. Results are expressed as % investigation of the novel object compared to the familiar object, means ± SEM; n = 16. *P ≤ 0.001. (F) Exploration in a Y maze was measured for 5 min. Results are expressed as perfect alternation, means ± SEM; n = 16. *P ≤ 0.02.
Switching HFD-fed mice to a LFD restores memory
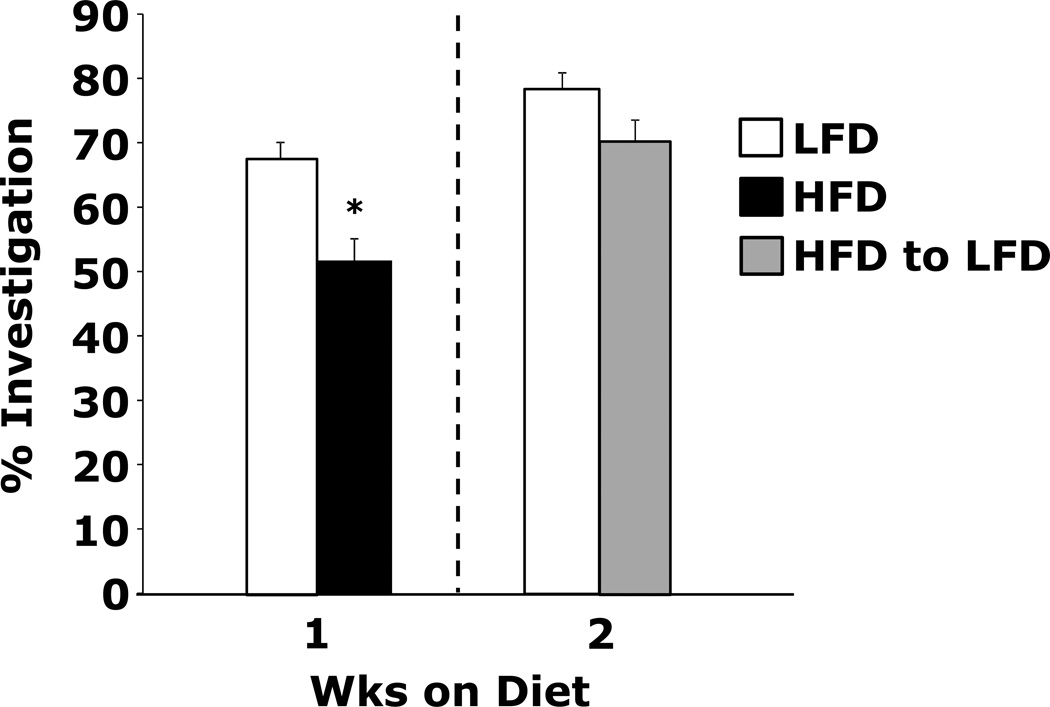
Fig.2 shows that mice fed a HFD vs. a LFD for 1 wk did not preferentially explore a novel object (51.50 ± 3.57% vs. 67.21 ± 2.82%, p ≤ 0.001). However, when these mice were switched to a LFD for 1 wk, novel object recognition was restored as compared to mice fed a LFD for 2 wks (70.05 ± 3.26% vs. 78.78 ± 2.82%).
Figure.2. Switching HFD-fed mice to a LFD restores memory.
Wild type mice were fed a LFD or HFD for 1 wk. After 1 wk, HFD-fed mice were switched to a LFD for 1 wk. Exploration of a familiar and novel object were measured for 5 min. Results are expressed as % investigation of the novel object compared to the familiar object, means ± SEM; n = 16. *P ≤ 0.001.
Short-term HFD feeding impacts brain DA, HVA and MAO activity but not pro-inflammatory cytokines
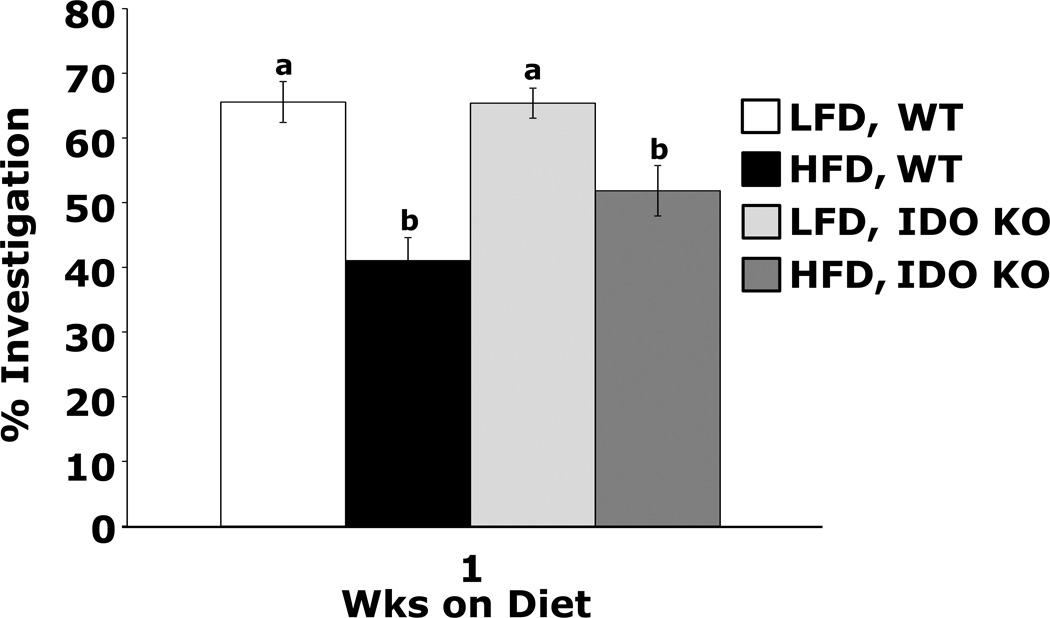
Table 2 shows that mice fed a HFD vs. a LFD for 1 wk have an 18% and 26% increase in HVA concentration in the cortex and hippocampus, respectively. The hypothalamus exhibits a 39% reduction in DA. Table 3 demonstrates that mice fed a HFD vs. a LFD for 3 wks have no difference in brain region DA, DOPAC or HVA. Table 4 shows that 1 wk of a HFD feeding does not affect gene expression of MAO-A, MAO-B or COMT in the hippocampus, hypothalamus and cortex. After 3 wks, a HFD increases hippocampal MAO-B gene expression while blunting time-associated increases in COMT gene expression in the hypothalamus and cortex and MAO-A gene expression in the hypothalamus. Table 5 shows that MAO-A and -B activity in the hippocampus, hypothalamus and cortex are not impacted by a 1 wk HFD feeding. At 3 wks, however, a HFD increases hippocampal and hypothalamic MAO-B activity (p=0.035 and 0.013, respectively) and hypothalamic MAO-A activity (p=0.006). Table 6 illustrates that serum IL-1α, IL-1β, TNF-α and IL-6 are unaffected by a 7 or 21 day HFD feeding. Table 7 demonstrates that mice fed a HFD vs. a LFD for 1 and 3 wks had no up-regulation of IL-1, IL-6 or TNFα in the hippocampus, hypothalamus and cortex. Mice fed a HFD for 1 wk had reduced expression of BDNF in the cortex. Fig.3 shows that IDO KO mice fed a HFD vs. a LFD for 1 wk did not prefer to explore a novel object over a familiar object (Main effects of diet (p<0.001), phenotype (p=0.099), diet × phenotype interaction (p=0.088), HFD WT vs HFD IDO KO, 51.8 ± 3.9 vs. 41.0 ± 3.6, p = 0.02; HFD WT vs. LFD WT, 41.0 ± 3.6 vs. 65.5 ± 3.2, p < 0.001; HFD IDO KO vs. LFD IDO KO, 51.8 ± 3.9 vs 65.4 ± 2.3, p = 0.004; LFD WT vs. LFD IDO KO, 65.6 ± 3.2 vs. 65.4 ± 2.3, p = 0.968). IL-1R1 KO mice fed either a LFD or HFD for 1 wk showed no novel object preference (data not shown).
Table 2.
Levels of (ng/mg) dopamine (DA), 3,4-dihydroxyphenylacetic acid (DOPAC) and homovanillic acid (HVA) in the cortex, hippocampus and hypothalamus of brain after a 1 week low-fat (LFD) or high-fat (HFD) diet feeding
| Cortex | |||
| Diet | DA | DOPAC | HVA |
| LFD | 1.27 ± 0.06 | 0.09 ± 0.01 | 0.11 ± 0.01a |
| HFD | 1.30 ± 0.05 | 0.10 ± 0.01 | 0.13 ± 0.01b |
| Hippocampus | |||
| Diet | DA | DOPAC | HVA |
| LFD | 0.75 ± 0.11 | 0.18 ± 0.03 | 0.78 ± 0.06a |
| HFD | 0.99 ± 0.16 | 0.26 ± 0.06 | 0.98 ± 0.07b |
| Hypothalamus | |||
| Diet | DA | DOPAC | HVA |
| LFD | 5.22 ± 0.69a | 1.14 ± 0.16 | 1.32 ± 0.13 |
| HFD | 3.17 ± 0.66b | 0.79 ± 0.19 | 1.81 ± 0.79 |
Results are expressed as mean ± SEM, n=10 per group. One-way ANOVA revealed main effect of diet (p<0.05). Letters within columns indicate significant differences. (HVA, cortex p=0.028; HVA, hippocampus p=0.039; DA, hypothalamus p=0.045)
Table 3.
Levels of (ng/mg) dopamine (DA), 3,4-dihydroxyphenylacetic acid (DOPAC) and homovanillic acid (HVA) in the cortex, hippocampus and hypothalamus of brain after a 3 week low-fat (LFD) or high-fat (HFD) diet feeding
| Cortex | |||
| Diet | DA | DOPAC | HVA |
| LFD | 0.57 ± 0.15 | 0.11 ± 0.02 | 0.18 ± 0.03 |
| HFD | 0.29 ± 0.07 | 0.08 ± 0.01 | 0.11 ± 0.01 |
| Hippocampus | |||
| Diet | DA | DOPAC | HVA |
| LFD | 0.47 ± 0.17 | 0.10 ± 0.04 | 0.28 ± 0.10 |
| HFD | 0.45 ± 0.08 | 0.06 ± 0.01 | 0.15 ± 0.04 |
| Hypothalamus | |||
| Diet | DA | DOPAC | HVA |
| LFD | 2.75 ± 0.56 | 0.88 ± 0.14 | 1.25 ± 0.17 |
| HFD | 2.89 ± 0.26 | 1.04 ± 0.06 | 1.36 ± 0.11 |
Results are expressed as mean ± SEM, n=6–8 per group.
Table 4.
Impact of LFD or HFD feeding on gene expression in cerebral hippocampus, hypothalamus and cortex after 1 or 3 weeks of feeding.
| 1 week | 3 weeks | ||||
|---|---|---|---|---|---|
| Gene | LFD | HFD | LFD | HFD | |
| MAO-A | 1.000 ± 0.033 | 1.078 ± 0.218 | 0.876 ± 0.018 | 1.134 ± 0.064 | |
| Hippocampus | MAO-B# | 1.000 ± 0.036a | 1.187 ± 0.195a | 0.946 ± 0.026a | 1.304 ± 0.142b |
| COMT | 1.000 ± 0.050 | 1.055 ± 0.169 | 1.070 ± 0.037 | 1.405 ± 0.153 | |
| MAO-A*#+ | 1.000 ±0.068a | 1.036 ± 0.108a | 1.624 ± 0.232b | 0.977± 0.053a | |
| Hypothalamus | MAO-B* | 1.000 ± 0.050a | 1.058 ± 0.138a,b | 1.855 ± 0.324b | 1.329 ± 0.174a,b |
| COMT*+ | 1.000 ± 0.050a | 1.107 ± 0.144a | 1.869 ± 0.326b | 1.255 ± 0.103a | |
| MAO-A | 1.000 ± 0.132 | 0.890 ± 0.028 | 1.166 ± 0.078 | 0.558 ± 0.495 | |
| Cortex | MAO-B* | 1.000 ± 0.074a | 1.017± 0.031a,b | 1.315 ± 0.104b | 1.137 ± 0.136a,b |
| COMT* | 1.000 ± 0.157a | 0.753 ± 0.089a | 1.271 ± 0.108a | 1.095 ± 0.120b | |
Results are expressed as relative fold change in mRNA expression (mRNA), means ± SEM.; n = 8. Results within individual rows without a common superscript letter are significantly different.
P < 0.05, significant main effect of time.
P < 0.05, significant main effect of diet.
P < 0.05, significant time-diet interaction.
Table 5.
MAO-A and MAO-B activity in brain regions of mice fed a low-fat (LFD) or high-fat (HFD) diet
| 1 Week on Diet | ||||||
| Cortex | Hippocampus | Hypothalamus | ||||
| Diet | MAO-A | MAO-B | MAO-A | MAO-B | MAO-A | MAO-B |
| LFD | 1.00 ± 0.03 | 1.00 ± 0.10 | 1.00 ± 0.04 | 1.00 ± 0.15 | 1.00 ± 0.06 | 1.00 ± 0.15 |
| HFD | 1.02 ± 0.05 | 1.24 ± 0.09 | 0.99 ± 0.09 | 1.19 ± 0.17 | 1.00 ± 0.04 | 1.11 ± 0.06 |
| 3 Weeks on Diet | ||||||
| Cortex | Hippocampus | Hypothalamus | ||||
| Diet | MAO-A | MAO-B | MAO-A | MAO-B | MAO-A | MAO-B |
| LFD | 1.00 ± 0.12 | 1.00 ± 0.06 | 1.00 ± 0.04 | 1.00 ± 0.05a | 1.00 ± 0.03a | 1.00 ± 0.07a |
| HFD | 0.88 ± 0.09 | 0.85 ± 0.07 | 0.91 ± 0.05 | 1.15 ± 0.05b | 1.12 ± 0.03b | 1.28 ± 0.08b |
Results are expressed as relative changes from LFD control, mean ± SEM, n=8 per group. Letters within columns indicate significant differences.
Table 6.
Concentration of pro-inflammatory cytokines (pg/mL) in mice fed a low-fat (LFD) or high fat diet (HFD)
| 1 Week on Diet | ||||
| Diet | IL-1α | IL-1β | IL-6 | TNF-α |
| LFD | 896.19 ± 155.28 | 4.17 ± 0.36 | ND | 8.96 ± 0.59 |
| HFD | 653.42 ± 092.63 | 3.67 ± 0.07 | ND | 7.80 ± 0.02 |
| 3 Weeks on Diet | ||||
| Diet | IL-1α | IL-1β | IL-6 | TNF-α |
| LFD | 731.61 ± 136.85 | 06.85 ± 0.45 | 1.03 ± 0.40 | 1.39 ± 0.11 |
| HFD | 766.84 ± 066.88 | 10.82 ± 1.78 | 1.00 ± 0.22 | 2.13 ± 0.19 |
Results are expressed as mean ± SEM, n=6–10 per group. ND=not detected.
Table 7.
Impact of LFD or HFD feeding on gene expression in cerebral hippocampus, hypothalamus and cortex after 1 or 3 weeks of feeding.
| 1 week | 3 weeks | ||||
|---|---|---|---|---|---|
| Gene | LFD | HFD | LFD | HFD | |
| Hypothalamus | IL-1α* | 1.000 ± 0.161 | 0.955 ± 0.102 | 0.717 ± 0.151 | 0.865 ± 0.108 |
| IL-1β* | 1.000 ± 0.239 | 1.005 ± 0.154 | 0.744 ± 0.201 | 0.729 ± 0.186 | |
| IL-1R1* | 1.000 ± 0.143 | 0.915 ± 0.173 | 1.090 ± 0.189 | 1.420 ± 0.207 | |
| 1IL-1R2 | 1.000 ± 0.123 | 0.909 ± 0.185 | 1.101 ± 0.105 | 0.844 ± 0.215 | |
| IL-1RA | 1.000 ± 0.288 | 0.894 ± 0.124 | 0.984 ± 0.209 | 1.235 ± 0.379 | |
| TNF-α | 1.000 ± 0.207 | 0.901 ± 0.126 | 0.867 ± 0.109 | 0.928 ± 0.177 | |
| IL-6# | 1.000 ± 0.114 | 0.942 ± 0.066 | 1.215 ± 0.071 | 0.963 ± 0.103 | |
| CD45* | 1.000 ± 0.096 | 1.006 ± 0.028 | 0.892 ± 0.080 | 0.859 ± 0.094 | |
| CD11b* | 1.000 ± 0.078 | 0.977 ± 0.045 | 0.832 ± 0.037 | 0.853 ± 0.065 | |
| F4/80* | 1.000 ± 0.065 | 0.947 ± 0.062 | 0.793 ± 0.072 | 0.721 ± 0.057 | |
| NGF* | 1.000 ± 0.081 | 1.006 ± 0.128 | 0.814 ± 0.070 | 0.839 ± 0.070 | |
| BDNF* | 1.000 ± 0.115 | 1.088 ± 0.133 | 0.746 ± 0.124 | 0.649 ± 0.109 | |
| Hypothalamus | IL-1α* | 1.000 ± 0.133 | 1.003 ± 0.114 | 0.743 ± 0.115 | 0.799 ± 0.106 |
| IL-1β | 1.000 ± 0.274 | 0.946 ± 0.143 | 0.771 ± 0.207 | 0.979 ± 0.073 | |
| 1IL-1R2 | 1.000 ± 0.951 | 0.729 ± 0.119 | 0.609 ± 0.724 | 0.724 ± 0.471 | |
| IL-1RA* | 1.000 ± 0.349 | 0.882 ± 0.249 | 0.632 ± 0.220 | 0.454 ± 0.125 | |
| TNF-α* | 1.000 ± 0.172 | 0.835 ± 0.212 | 0.649 ± 0.205 | 0.710 ± 0.126 | |
| 1IL-6+ | 1.000 ± 0.123a | 1.054 ± 0.161a,b | 1.298 ± 0.069b | 0.923 ± 0.109a | |
| CD45* | 1.000 ± 0.062 | 1.029 ± 0.072 | 0.850 ± 0.044 | 0.806 ± 0.049 | |
| CD11b* | 1.000 ± 0.081 | 1.031 ± 0.085 | 0.913 ± 0.059 | 0.909 ± 0.095 | |
| 1F4/80* | 1.000 ± 0.043 | 0.957 ± 0.060 | 0.736 ± 0.095 | 0.659 ± 0.043 | |
| NGF | 1.000 ± 0.216 | 0.768 ± 0.153 | 1.023 ± 0.288 | 0.800 ± 0.183 | |
| BDNF | 1.000 ± 0.100 | 0.891 ± 0.124 | 0.876 ± 0.055 | 0.914 ± 0.087 | |
| Cortex | IL-1α# | 1.000 ± 0.102 | 1.050 ± 0.069 | 0.844 ± 0.126 | 1.049 ± 0.084 |
| 1IL-1β | 1.000 ± 0.345 | 1.240 ± 0.077 | 1.083 ± 0.211 | 1.437 ± 0.131 | |
| IL-1R1 | 1.000 ± 0.255 | 1.069 ± 0.116 | 0.868 ± 0.278 | 1.208 ± 0.201 | |
| IL-1R2 | 1.000 ± 0.063 | 0.955 ± 0.064 | 0.976 ± 0.084 | 0.962 ± 0.103 | |
| IL-1RA# | 1.000 ± 0.178 | 1.153 ± 0.104 | 0.935 ± 0.115 | 1.212 ± 0.146 | |
| TNF-α | 1.000 ± 0.099 | 0.888 ± 0.104 | 0.903 ± 0.104 | 0.991 ± 0.150 | |
| 1IL-6 | 1.000 ± 0.139 | 1.042 ± 0.064 | 1.273 ± 0.120 | 1.068 ± 0.115 | |
| 1CD45 | 1.000 ± 0.071 | 1.115 ± 0.067 | 0.721 ± 0.629 | 1.069 ± 0.060 | |
| CD11b | 1.000 ± 0.079 | 1.056 ± 0.073 | 0.981 ± 0.050 | 1.050 ± 0.075 | |
| F4/80 | 1.000 ± 0.069 | 1.015 ± 0.071 | 0.960 ± 0.075 | 0.989 ± 0.076 | |
| NGF* | 1.000 ± 0.067 | 0.884 ± 0.051 | 0.765 ± 0.053 | 0.761 ± 0.071 | |
| BDNF+ | 1.000 ± 0.084a | 0.870 ± 0.037b | 0.830 ± 0.049b | 0.950 ± 0.063a | |
Results are expressed as relative fold change in mRNA expression (mRNA), means ± SEM.; n = 6–8. Results within individual rows without a common superscript letter are significantly different.
P < 0.05, significant main effect of time.
P < 0.05, significant main effect of diet.
P < 0.05, significant time-diet interaction.
Friedman’s two-way ANOVA for non-parametric data used for analysis.
Figure.3. HFD-fed IDO KO mice have impaired memory.
IDO KO and wild type (WT) mice were fed a LFD or HFD for 1 wk. Exploration of a familiar and novel object were measured for 5 min. Results are expressed as % investigation of the novel object compared to the familiar object, means ± SEM; n = 12. Bars without a common superscript are different (P < 0.05).
Methylphenidate corrects 1 wk HFD-dependent memory impairment
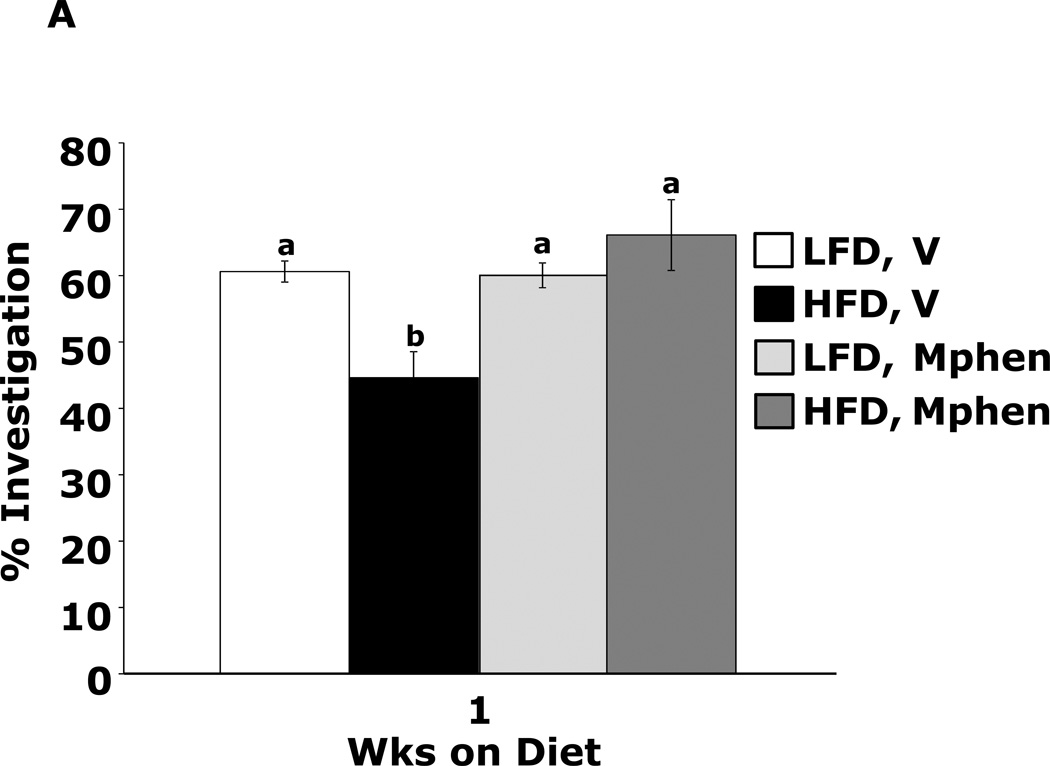
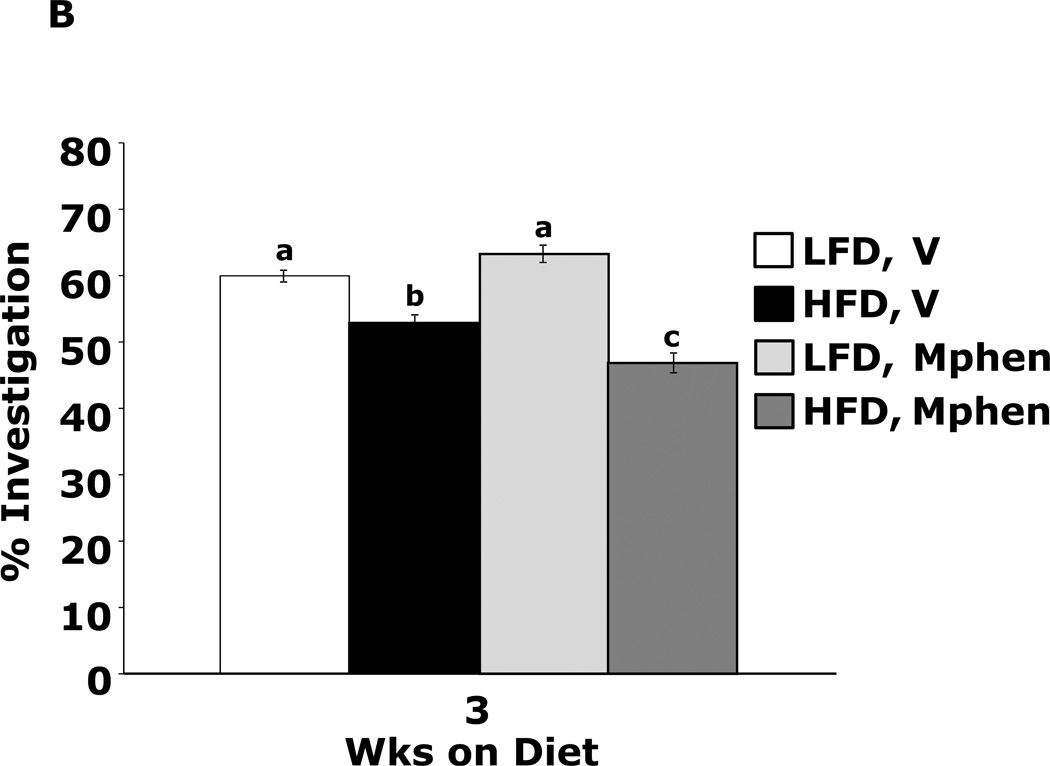
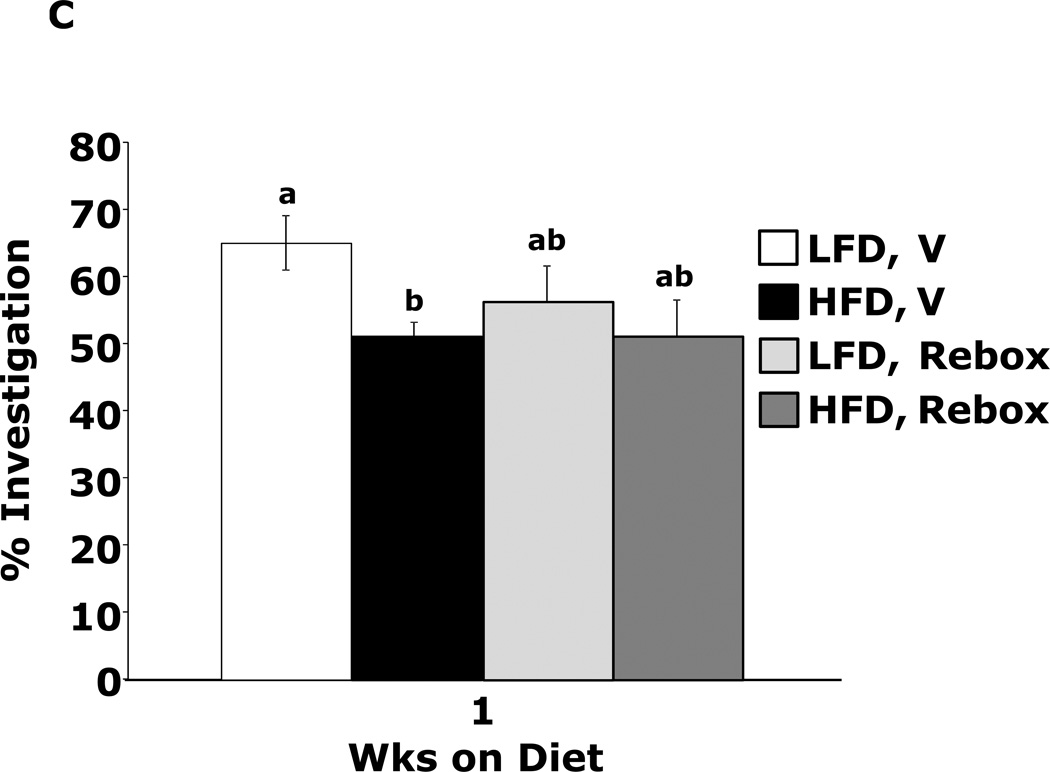
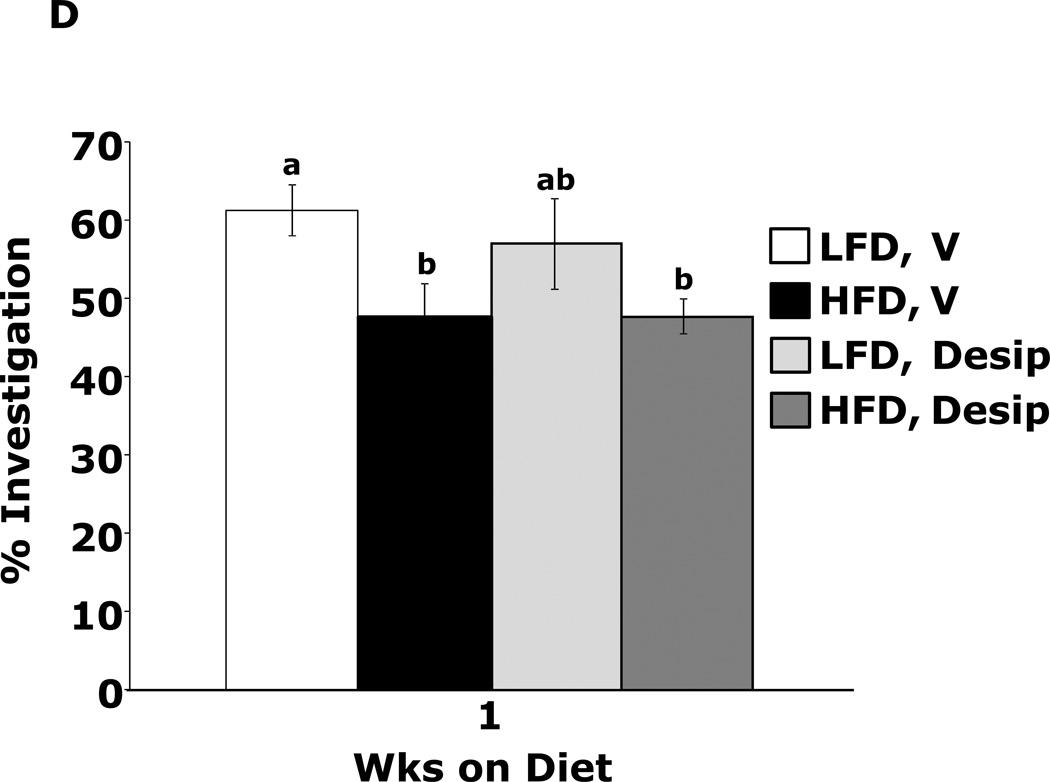
Fig.4A shows that mice fed a HFD vs. a LFD for 1 wk had impaired novel object recognition (44.6 ± 3.9% vs. 60.6 ± 1.6%, p = 0.002). However, when mice were administered methylphenidate, HFD-dependent memory impairment was corrected (66.2 ± 5.3% vs.60.0 ± 1.9%, p = 0.204) {main effects of diet (p=0.143), drug (p=0.004), diet × drug interaction (p=0.002); HFD methylphenidate vs HFD vehicle, 66.1 ± 5.3% vs 44.6 ± 3.9%, p < 0.001; LFD methylphenidate vs LFD vehicle, 60.0 ± 1.9% vs 60.6 ± 1.6%, p = 0.903; HFD methylphenidate vs LFD methylphenidate, 66.1 ± 5.3% vs 60.0 ± 1.9%, p = 0.204; HFD vehicle vs LFD vehicle, 44.6 ± 3.9% vs 60.6 ± 1.6%, p = 0.002}. In contrast, mice fed a HFD for 3 wks showed decreased novel object recognition performance when administered methylphenidate when compared to LFD-fed mice (Fig.4B) {main effects of diet (p<0.001), drug (p=0.32), diet × drug interaction (p=0.012); HFD methylphenidate vs HFD vehicle, 47.3 ± 1.5% vs 53.9 ± 1.2%, p = 0.014; LFD methylphenidate vs LFD vehicle, 63.4 ± 1.3% vs 60.4 ± 0.9%, p = 0.242; HFD methylphenidate vs LFD methylphenidate, 47.3 ± 1.5% vs 63.4 ± 1.3%, p < 0.001; HFD vehicle vs LFD vehicle, 53.9 ± 1.2% vs 60.4 ± 0.9%, p = 0.015}. Figs.4C and D show that the antidepressants reboxetine and desipramine did not correct HFD-dependent memory impairment {reboxetine: main effects of diet (p=0.024), drug (p=0.333), diet × drug interaction (p=0.276), HFD reboxetine vs. HFD vehicle, 51.3 ± 5.1% vs. 51.2 ± 2.0%, p = 0.93; LFD reboxetine vs. LFD vehicle, 56.5 ± 5.4% vs. 65.0 ± 4.1%, p = 0.149; HFD reboxetine vs. LFD reboxetine, 51.4 ± 5.2% vs. 56.5 ± 5.4%, p = 0.379; HFD vehicle vs. LFD vehicle, 51.2 ± 2.0% vs. 65.0 ± 4.1%, p = 0.02. Desipramine: main effects of diet (p=0.006), drug (p=0.594), diet × drug interaction (p=0.582), HFD desipramine vs HFD vehicle, 47.7 ± 2.2% vs. 47.6 ± 4.3%, p = 0.99; LFD desipramine vs LFD vehicle, 56.9 ± 5.8% vs. 61.2 ± 3.3%, p = 0.451; HFD desipramine vs. LFD desipramine,47.7 ± 2.2% vs. 56.9 ± 5.8%, p = 0.101; HFD vehicle vs. LFD vehicle,47.6 ± 4.3% vs. 61.2 ± 3.3%, p = 0.021}
Figure.4. Methylphenidate corrects 1 wk HFD-dependent memory impairment.
(A) Wild type mice were fed a LFD or HFD for 1 wk. Mice were treated with vehicle (V) or methylphenidate (Mphen). Exploration of a familiar and novel object were measured for 5 min. Results are expressed as % investigation of the novel object compared to the familiar object, means ± SEM; n = 8. Bars without a common superscript are different (P < 0.05). (B) Wild type mice were fed a LFD or HFD for 3 wks. Mice were treated with vehicle (V) or methylphenidate (Mphen). Exploration of a familiar and novel object were measured for 5 min. Results are expressed as % investigation of the novel object compared to the familiar object, means ± SEM; n = 8. Bars without a common superscript are different (P < 0.05). (C) Wild type mice were fed a LFD or HFD for 1 wk. Mice were treated with vehicle (V) or reboxetine (rebox). Exploration of a familiar and novel object were measured for 5 min. Results are expressed as % investigation of the novel object compared to the familiar object, means ± SEM; n = 8. Bars without a common superscript are different (P < 0.05). (D) Wild type mice were fed a LFD or HFD for 1 wk. Mice were treated with vehicle (V) or desipramine (desip). Exploration of a familiar and novel object were measured for 5 min. Results are expressed as % investigation of the novel object compared to the familiar object, means ± SEM; n = 8. Bars without a common superscript are different (P < 0.05).
Discussion
The main findings of the study were that a 1 wk HFD feeding increased anxiety like behavior and impaired memory and learning as evidenced by increased mouse burrowing and spontaneous wheel running and decreased mouse exploration of the open quadrants of a zero maze, perfect alternations in a Y-maze and recognition of a novel object. After a 3 wk HFD feeding, mouse burrowing and novel object recognition remained increased and impaired; respectively, while immobility in the forced swim test decreased. All other aforementioned behaviors examined normalized. Increases in blood glucose and weight due to a HFD occurred by 2 and 3 wks, respectively. Serum IL-1α, IL-1β, TNF-α and IL-6 were not impacted by a HFD-feeding. In the brain, only gene transcripts for IL-6 in the hypothalamus and BDNF in the cortex demonstrated a time-diet interaction. In contrast, HVA in the hippocampus and cortex were increased after a 1 wk HFD feeding as was DA in the hypothalamus. At 3 wks of feeding, no differences in HVA, DA or DOPAC were seen between HFD- and LFD-fed mice. MAO-B activity, however, was increased in the hippocampus and hypothalamus along with hypothalamic MAO-A. Finally, administration of methylphenidate prevented HFD-dependent impairment of novel object recognition in mice fed a HFD for 1 wk but impaired novel object recognition could not be corrected with methylphenidate in mice fed a HFD for 3 wks.
The prevalence of childhood obesity has risen dramatically (Karnik and Kanekar 2012) and coincident with this upsurge is an increase in adverse childhood psychological factors most notably ADHD, impulsivity, depression and anxiety (Puder and Munsch 2010). Due to the myriad of confounds that exist when determining causality of human psychological disorders, controversy remains as to whether overnutrition and/or childhood obesity is important to adverse behaviors especially ADHD (van Egmond-Frohlich et al. 2012). Therefore, we examined young mice fed a HFD to determine if biobehaviors were impacted. As an initial screening test for behavioral change, we utilized burrowing. Burrowing is very sensitive to the presence of abnormal behaviors (Deacon 2006; Deacon 2009), but its root cause and counterpart in human psychology is not yet agreed upon. Changes in burrowing have been equated to anxiety-like behavior, as burrowing is utilized in nature to hide from predators and to conceal food (Deacon 2006). However, in the laboratory setting, mice will burrow and/or remove substrate from a container in a fashion similar to the “spring cleaning” behavior seen in wild field mice (Deacon 2009). Thus, burrowing may represent a reward/pleasure behavior. Support for this contention is illustrated by the work of Sherwin et al. who demonstrated that mice can be motivated to burrow and taught to press a lever to access burrowing material, even when no immediate need to burrow is present (Sherwin and Sherwin 2004). In addition, dopamine antagonism reduces burrowing in mice (el-Kadi and Sharif 1998). Therefore, due to the presence of increased burrowing, juvenile mice fed a HFD for 1 or 3 wks may have heightened reward seeking and/or anxious behavior.
Voluntary wheel running can be viewed as a reward behavior (Meek et al., 2010) and we saw that mice fed a HFD for 1 wk had increased wheel running. Most previous studies have failed to demonstrate an increase in wheel running in rodents fed a HFD (Meek et al., 2010; Ma et al., 2011) unless mice were selectively bred for high voluntary wheel running (Meek et al., 2010). This phenotype is in contrast to spontaneous locomotion which is reduced in mice fed a HFD for 8 or more wks (Lavin et al., 2011). In this study, our wheel running approach differed from that used by others because we allowed mice only a single episode of wheel running in a manner similar to our burrowing experiments. Thus our approach may have evaluated anxiety as anxious mice wheel run more than non-anxious mice (Novak et al., 2012). Support for this interpretation is seen in our elevated plus maze data which demonstrated that mice were more anxious after being fed a HFD for one week. This behavior is not present after feeding a HFD for 3 wks. Correspondingly, wheel running normalized between HFD- and LFD-fed mice after 3 wks. The anxiety behaviors identified in juvenile mice were not coupled to depressive-like behavior in that mobility in the force swim test increased in mice fed a HFD for 3 wks. Improved performance in the forced swim test correlated with the presence of a significant weight differences between HFD- and LFD-fed mice at 3 wks and suggests that the inherent buoyancy and/or energy reserves of HFD-fed mice may allow for enhanced performance in a swim-dependent environment, as we have previously shown (Lavin et al., 2011). Taken together, anxiety appears to manifest early in HFD-fed juvenile mice. It then appears to resolve but recurs after 8–10 wks of continuous HFD-feeding (Lavin et al., 2011; Sharma and Fulton 2012).
HFD feeding negatively impacted learning and memory in juvenile mice. Amygdala-based memory, as examined using object recognition (Broadbent et al., 2004), was impacted at both 1 and 3 wks while hippocampal-based memory, as assessed using spatial-cued Y maze performance (Broadbent et al., 2004), was impacted for only 1 wk. Previously, Kanoski found that after feeding rats a HFD for 3 days spatial memory was impaired, while non-spatial memory remained intact (Kanoski and Davidson 2010). In their work, non-spatial memory became compromised after 30 days of HFD feeding (Kanoski and Davidson 2010). Since Kanoski used a radial arm maze to examine non-spatial learning, their test was more hippocampal-dependent than our use of novel object recognition which is markedly resistant to hippocampal injury (Broadbent et al., 2004). Importantly, the impact of a HFD on novel object recognition was reversible because if mice were switched from a HFD to LFD memory impairment resolved. Thus, the cognitive impairment caused by a short-term HFD feeding in juvenile mice is reversible and amenable to interventions.
As has been extensively described, HFDs are pro-inflammatory (Gregor and Hotamisligil 2011) and increased expression of inflammatory bioactives in the brain are postulated to cause the adverse behaviors and cognitive impairment associated with the diabese state (Dantzer et al., 2008). Unlike in liver and adipose tissue, diabesity is not associated with robust brain-based inflammation (Lavin et al., 2011). Long-term HFD feeding has been shown to increase brain IL-1α gene expression (Lavin et al., 2011) and excess IL-1 in the brain impairs memory (Yirmiya and Goshen 2011). Juvenile IL-1R1 KO mice fed a HFD were not protected from memory impairment demonstrating that IL-1 is not important to deficient novel object recognition. As a more generalized assessment of HFD-dependent neurotoxicity, we examined novel object recognition in IDO KO mice. IDO is the principal mediator of tryptophan metabolism in the body (Miura, et al 2008). IDO KO mice are resistant to inflammation-induced adverse behaviors (O'Connor et al., 2009a). Surprisingly, IDO KO mice were not protected from HFD-induced memory impairment. Protection was expected because IDO has been proposed as a key mediator of obesity-associated mood disturbances (Brandacher et al., 2007). Therefore, our data suggest that brain-based inflammation is not important to memory dysregulation after a short term HFD feeding.
Methylphenidate is a dopamine transporter inhibitor commonly used to treat ADHD (Rapport et al., 1994; Wolraich et al., 2001). By blocking monoamine transporters in the striatum, methylphenidate increases the synaptic concentration of dopamine and norepinephrine (Arnsten and Dudley 2005). While methylphenidate prevented 1 wk HFD-induced memory impairment, the norepinephrine/serotonin re-uptake inhibitor, desipramine (Staff 2011), and the selective norepinephrine re-uptake inhibitor, reboxetine (Staff 2011), did not improve memory. Interestingly, methylphenidate did not prevent memory impairment in 3 wk HFD-fed mice. In fact, mice feed a HFD for 3 wks were slightly adverse to the novel object with an interaction percentage below 50%. This finding suggests that mice fed a HFD for extended periods may be made anxious by the acute dosing of methylphenidate. While this methylphenidate/obesity interaction has not been previously reported, an anxious phenotype has been observed in chow-fed rats administered methylphenidate chronically (2 mg/kg IP; twice daily for 16 days) (Vendruscolo et al., 2008). Why methylphenidate works early in the course of a HFD and not later may be explained by the changes seen in the DA system during the progression of overnutrition to diabesity.
After a 1 wk HFD feeding, the dopamine metabolite HVA was increased in the cortex and hippocampus. In addition, DA was elevated in the hypothalamus. This was associated with decreased gene expression of BDNF in the cortex. Since infusion of BDNF into the brain increases brain HVA (Altar et al., 1992), it was not unexpected that gene expression of BDNF in the cortex would be reduced in mice with elevated brain HVA. After 3 wks of HFD feeding, however, DA and HVA levels in the brain were similar to those measured in LFD mice. These findings support the contention that a HFD can affect brain reward and impact the DA system which is activated by unexpected rewards and novelty (Reyes 2012). Chronic feeding of a HFD is associated with down-regulation of gene transcripts for the dopamine 1 and 2 receptors and the dopamine transporter, indicating that a HFD may eventually lead to a quieting of the DA system (Reyes 2012). We saw that gene expression of brain MAO and COMT increased from 4 (1 wk on diet) to 7 wks of age (3-wks on diet) with a HFD feeding preventing this age-associated up-regulation. The one exception was MAO-B in the hippocampus which was increased after 3 wks of a HFD. This increase was associated with enhanced MAO-B activity in the hippocampus as well as increased MAO-A and-B activity in the hypothalamus. Taken together it appears that a HFD rapidly boosts the DA system (especial in brain regions that regulate appetite) and that this up-regulation is closely followed by a homeostatic and/or compensation mechanism that likely accounts for the normalization of behavior that is seen during an extended HFD feeding. Additional support for this notion is seen in mice fed a HFD for 12 wks because these mice have normal novel object recognition and reduced burrowing (Lavin et al., 2011). Only after months of diabesity does inflammation-associated cognitive impairment generally occur, which appears linked to long-standing hyperglycemia and/or insulin resistance-mediated neurodegeneration (Umegaki 2012).
In summary, childhood obesity and ADHD share coincident clinical manifestations that include impaired executive function and increased impulsivity. Dopaminergic pathways appear impacted in both obesity and ADHD as do brain proteins like BDNF. Given our findings that juvenile mice fed a HFD develop adverse behaviors and impaired memory and learning prior to the onset of weight gain and pre-diabetes, overnutrition due to fats may be causative to childhood psychological factors such as anxiety and ADHD.
Acknowledgments
Support: This research was supported by the National Institutes of Health (DK064862, NS058525 and AA019357 to GGF) and Kraft Human Nutrition Endowed Fellowship to the Division of Nutritional Sciences (to M.M.K.)
Abbreviations
- ADHD
attention deficit/hyperactive disorder
- BDNF
brain derived neurotrophic factor
- COMT
catechol-O-methyltransferase
- DA
dopamine
- DOPAC
dihydroxyphenylacetic acid
- HFD
high-fat diet
- HVA
homovanillic acid
- HPLC
high-performance liquid chromatography
- IDO
indoleamine 2,3 dioxygenase
- IP
intraperitoneal
- KO
knockout
- LFD
low-fat diet
- MAO
monoamine oxidase
- NGF
nerve growth factor
- PBS
phosphate buffered saline
- WT
wild type
Footnotes
Publisher's Disclaimer: This is a PDF file of an unedited manuscript that has been accepted for publication. As a service to our customers we are providing this early version of the manuscript. The manuscript will undergo copyediting, typesetting, and review of the resulting proof before it is published in its final citable form. Please note that during the production process errors may be discovered which could affect the content, and all legal disclaimers that apply to the journal pertain.
Disclosures
All authors (Melissa M. Kaczmarczyk, Agnieszka S. Machaj, Gabriel S. Chiu, Marcus A. Lawson, Stephen J. Gainey, Jason M. York, Daryl D. Meling, Stephen A. Martin, Kristen A. Kwakwa, Andrew F. Newman, Jeffrey A. Woods, Keith W. Kelley, Yanyan Wang, Michael J. Miller, Gregory G. Freund) certify that there are no conflicts of interests.
Melissa M. Kaczmarczyk - designed experiments, performed behavioral experiments, wrote paper
Agnieszka S. Machaj - preformed memory experiments
Gabriel S. Chiu - performed MAO activity analysis, wrote revision
Marcus A. Lawson - performed dopamine analysis
Stephen J. Gainey - performed memory experiments and qPCR for revision
Jason M. York - performed qPCR statistical analysis
Daryl D. Meling - performed qPCR
Stephen A. Martin - performed wheel running experiments
Kristen A. Kwakwa - assisted with memory, qPCR and MOA experiments for revision
Andrew F. Newman – performed serum cytokine assay
Jeffrey A. Woods - designed wheel running experiments
Keith W. Kelley - designed dopamine analysis
Yanyan Wang - wrote paper
Michael J. Miller - wrote paper
Gregory G. Freund - designed experiments, wrote paper, wrote revision
References
- Altar CA, Boylan CB, Jackson C, Hershenson S, Miller J, Wiegand SJ, Lindsay RM, Hyman C. Brain-derived neurotrophic factor augments rotational behavior and nigrostriatal dopamine turnover in vivo. Proc. Natl. Acad. Sci. U.S.A. 1992;89:11347–11351. doi: 10.1073/pnas.89.23.11347. [DOI] [PMC free article] [PubMed] [Google Scholar]
- Arnsten AF, Dudley AG. Methylphenidate improves prefrontal cortical cognitive function through alpha2 adrenoceptor and dopamine D1 receptor actions: Relevance to therapeutic effects in Attention Deficit Hyperactivity Disorder. Behav. Brain. Funct. 2005;1:2. doi: 10.1186/1744-9081-1-2. [DOI] [PMC free article] [PubMed] [Google Scholar]
- Arvanitakis Z, Wilson RS, Bienias JL, Evans DA, Bennett DA. Diabetes mellitus and risk of Alzheimer disease and decline in cognitive function. Arch. Neurol. 2004;61:661–666. doi: 10.1001/archneur.61.5.661. [DOI] [PubMed] [Google Scholar]
- Astrup A. Macronutrient balances and obesity: the role of diet and physical activity. Public Health Nutr. 1999;2:341–347. doi: 10.1017/s1368980099000464. [DOI] [PubMed] [Google Scholar]
- Bayer-Carter JL, Green PS, Montine TJ, VanFossen B, Baker LD, Watson GS, Bonner LM, Callaghan M, Leverenz JB, Walter BK, Tsai E, Plymate SR, Postupna N, Wilkinson CW, Zhang J, Lampe J, Kahn SE, Craft S. Diet intervention and cerebrospinal fluid biomarkers in amnestic mild cognitive impairment. Arch. Neurol. 2011;68:743–752. doi: 10.1001/archneurol.2011.125. [DOI] [PMC free article] [PubMed] [Google Scholar]
- Bazar KA, Yun AJ, Lee PY, Daniel SM, Doux JD. Obesity and ADHD may represent different manifestations of a common environmental oversampling syndrome: a model for revealing mechanistic overlap among cognitive, metabolic, and inflammatory disorders. Med. Hypotheses. 2006;66:263–269. doi: 10.1016/j.mehy.2005.02.042. [DOI] [PubMed] [Google Scholar]
- Brandacher G, Hoeller E, Fuchs D, Weiss HG. Chronic immune activation underlies morbid obesity: is IDO a key player? Curr. Drug Metab. 2007;8:289–295. doi: 10.2174/138920007780362590. [DOI] [PubMed] [Google Scholar]
- Broadbent NJ, Squire LR, Clark RE. Spatial memory, recognition memory, and the hippocampus. Proc. Natl. Acad. Sci. U.S. A. 2004;101:14515–14520. doi: 10.1073/pnas.0406344101. [DOI] [PMC free article] [PubMed] [Google Scholar]
- Bruce-Keller AJ, Keller JN, Morrison CD. Obesity and vulnerability of the CNS. Biochim. Biophys. Acta. 2009;1792:395–400. doi: 10.1016/j.bbadis.2008.10.004. [DOI] [PMC free article] [PubMed] [Google Scholar]
- Buettner R, Scholmerich J, Bollheimer LC. High-fat diets: modeling the metabolic disorders of human obesity in rodents. Obesity (Silver Spring) 2007;15:798–808. doi: 10.1038/oby.2007.608. [DOI] [PubMed] [Google Scholar]
- Cortese S, Morcillo Penalver C. Comorbidity between ADHD and obesity: exploring shared mechanisms and clinical implications. Postgrad. Med. 2010;122:88–96. doi: 10.3810/pgm.2010.09.2205. [DOI] [PubMed] [Google Scholar]
- Cserjesi R, Luminet O, Poncelet AS, Lenard L. Altered executive function in obesity. Exploration of the role of affective states on cognitive abilities. Appetite. 2009;52:535–539. doi: 10.1016/j.appet.2009.01.003. [DOI] [PubMed] [Google Scholar]
- Dantzer R, O'Connor JC, Freund GG, Johnson RW, Kelley KW. From inflammation to sickness and depression: when the immune system subjugates the brain. Nat. Rev. Neurosci. 2008;9:46–56. doi: 10.1038/nrn2297. [DOI] [PMC free article] [PubMed] [Google Scholar]
- Davis C. Attention-deficit/hyperactivity disorder: associations with overeating and obesity. Curr. Psychiatry Rep. 2010;12:389–395. doi: 10.1007/s11920-010-0133-7. [DOI] [PubMed] [Google Scholar]
- Deacon RM. Burrowing in rodents: a sensitive method for detecting behavioral dysfunction. Nat. Protoc. 2006;1:118–121. doi: 10.1038/nprot.2006.19. [DOI] [PubMed] [Google Scholar]
- Deacon RM. Burrowing: a sensitive behavioural assay, tested in five species of laboratory rodents. Behav. Brain Res. 2009;200:128–133. doi: 10.1016/j.bbr.2009.01.007. [DOI] [PubMed] [Google Scholar]
- Edwards LM, Murray AJ, Holloway CJ, Carter EE, Kemp GJ, Codreanu I, Brooker H, Tyler DJ, Robbins PA, Clarke K. Short-term consumption of a high-fat diet impairs whole-body efficiency and cognitive function in sedentary men. FASEB. J. 2011;25:1088–1096. doi: 10.1096/fj.10-171983. [DOI] [PubMed] [Google Scholar]
- Elias MF, Elias PK, Sullivan LM, Wolf PA, D'Agostino RB. Lower cognitive function in the presence of obesity and hypertension: the Framingham heart study. Int. J. Obes. Relat. Metab. Disord. 2003;27:260–268. doi: 10.1038/sj.ijo.802225. [DOI] [PubMed] [Google Scholar]
- Elias MF, Elias PK, Sullivan LM, Wolf PA, D'Agostino RB. Obesity, diabetes and cognitive deficit: The Framingham Heart Study. Neurobiol. Aging. 2005;26(Suppl 1):11–16. doi: 10.1016/j.neurobiolaging.2005.08.019. [DOI] [PubMed] [Google Scholar]
- el-Kadi AO, Sharif SI. The role of dopamine in the expression of morphine withdrawal. Gen. Pharmacol. 1998;30:499–505. doi: 10.1016/s0306-3623(97)00286-3. [DOI] [PubMed] [Google Scholar]
- Gregor MF, Hotamisligil GS. Inflammatory mechanisms in obesity. Annu. Rev. Immunol. 2011;29:415–445. doi: 10.1146/annurev-immunol-031210-101322. [DOI] [PubMed] [Google Scholar]
- Guxens M, Mendez MA, Julvez J, Plana E, Forns J, Basagana X, Torrent M, Sunyer J. Cognitive function and overweight in preschool children. Am. J. Epidemiol. 2009;170:438–446. doi: 10.1093/aje/kwp140. [DOI] [PMC free article] [PubMed] [Google Scholar]
- Hassing LB, Hofer SM, Nilsson SE, Berg S, Pedersen NL, McClearn G, Johansson B. Comorbid type 2 diabetes mellitus and hypertension exacerbates cognitive decline: evidence from a longitudinal study. Age Ageing. 2004;33:355–361. doi: 10.1093/ageing/afh100. [DOI] [PubMed] [Google Scholar]
- Johnson PM, Kenny PJ. Dopamine D2 receptors in addiction-like reward dysfunction and compulsive eating in obese rats. Nat. Neurosci. 2010;13:635–641. doi: 10.1038/nn.2519. [DOI] [PMC free article] [PubMed] [Google Scholar]
- Kanoski SE, Davidson TL. Different patterns of memory impairments accompany short- and longer-term maintenance on a high-energy diet. J. Exp. Psychol. Anim. Behav. Process. 2010;36:313–319. doi: 10.1037/a0017228. [DOI] [PubMed] [Google Scholar]
- Karnik S, Kanekar A. Childhood obesity: a global public health crisis. Int. J. Pre.v Med. 2012;3:1–7. [PMC free article] [PubMed] [Google Scholar]
- Lavin DN, Joesting JJ, Chiu GS, Moon ML, Meng J, Dilger RN, Freund GG. Fasting induces an anti-inflammatory effect on the neuroimmune system which a high-fat diet prevents. Obesity (Silver Spring) 2011;19:1586–1594. doi: 10.1038/oby.2011.73. [DOI] [PMC free article] [PubMed] [Google Scholar]
- Li H, Lelliott C, Hakansson P, Ploj K, Tuneld A, Verolin-Johansson M, Benthem L, Carlsson B, Storlien L, Michaelsson E. Intestinal, adipose, and liver inflammation in diet-induced obese mice. Metabolism. 2008;57:1704–1710. doi: 10.1016/j.metabol.2008.07.029. [DOI] [PubMed] [Google Scholar]
- Lissner L, Heitmann BL. Dietary fat and obesity: evidence from epidemiology. Eur. J. Clin. Nutr. 1995;49:79–90. [PubMed] [Google Scholar]
- Ma H, Turpeinen T, Silvennoinen M, Torvinen S, Rinnankoski-Tuikka R, Kainulainen H, Timonen J, Kujala UM, Rahkila P, Suominen H. Effects of diet-induced obesity and voluntary wheel running on the microstructure of the murine distal femur. Nutr. Metab. (Lond.) 2011;8:1. doi: 10.1186/1743-7075-8-1. [DOI] [PMC free article] [PubMed] [Google Scholar]
- Meek TH, Eisenmann JC, Garland T., Jr Western diet increases wheel running in mice selectively bred for high voluntary wheel running. Int. J. Obes. (Lond.) 2010;34:960–969. doi: 10.1038/ijo.2010.25. [DOI] [PubMed] [Google Scholar]
- Miura H, Ozaki N, Sawada M, Isobe K, Ohta T, Nagatsu T. A link between stress and depression: shifts in the balance between the kynurenine and serotonin pathways of tryptophan metabolism and the etiology and pathophysiology of depression. Stress. 2008;11:198–209. doi: 10.1080/10253890701754068. [DOI] [PubMed] [Google Scholar]
- Nieoullon A. Dopamine and the regulation of cognition and attention. Prog. Neurobiol. 2002;67:53–83. doi: 10.1016/s0301-0082(02)00011-4. [DOI] [PubMed] [Google Scholar]
- Novak CM, Burghardt PR, Levine JA. The use of a running wheel to measure activity in rodents: relationship to energy balance, general activity, and reward. Neurosci. Biobehav. Rev. 2012;36:1001–1014. doi: 10.1016/j.neubiorev.2011.12.012. [DOI] [PMC free article] [PubMed] [Google Scholar]
- O'Connor JC, Lawson MA, Andre C, Briley EM, Szegedi SS, Lestage J, Castanon N, Herkenham M, Dantzer R, Kelley KW. Induction of IDO by bacille Calmette-Guerin is responsible for development of murine depressive-like behavior. J. Immunol. 2009a;182:3202–3212. doi: 10.4049/jimmunol.0802722. [DOI] [PMC free article] [PubMed] [Google Scholar]
- O'Connor JC, Lawson MA, Andre C, Moreau M, Lestage J, Castanon N, Kelley KW, Dantzer R. Lipopolysaccharide-induced depressive-like behavior is mediated by indoleamine 2,3-dioxygenase activation in mice. Mol. Psychiatry. 2009b;14:511–522. doi: 10.1038/sj.mp.4002148. [DOI] [PMC free article] [PubMed] [Google Scholar]
- Park MJ, Yoo SW, Choe BS, Dantzer R, Freund GG. Acute hypoglycemia causes depressive-like behaviors in mice. Metabolism. 2011;61:229–236. doi: 10.1016/j.metabol.2011.06.013. [DOI] [PMC free article] [PubMed] [Google Scholar]
- Puder JJ, Munsch S. Psychological correlates of childhood obesity. Int. J. Obes. (Lond.) 2010;34(Suppl 2):S37–S43. doi: 10.1038/ijo.2010.238. [DOI] [PubMed] [Google Scholar]
- Rapport MD, Denney C, DuPaul GJ, Gardner MJ. Attention deficit disorder and methylphenidate: normalization rates, clinical effectiveness, and response prediction in 76 children. J. Am. Acad. Child Adolesc. Psychiatry. 1994;33:882–893. doi: 10.1097/00004583-199407000-00015. [DOI] [PubMed] [Google Scholar]
- Reyes TM. High-fat diet alters the dopamine and opioid systems: effects across development. Int. J. Obes. Supplements. 2012;2:S25–S28. doi: 10.1038/ijosup.2012.18. [DOI] [PMC free article] [PubMed] [Google Scholar]
- Sharma S, Fulton S. Diet-induced obesity promotes depressive-like behaviour that is associated with neural adaptations in brain reward circuitry. Int. J. Obes. (Lond.) 2012 doi: 10.1038/ijo.2012.48. [DOI] [PubMed] [Google Scholar]
- Sherwin CM, Haug E, Terkelsen N, Vadgama M. Studies on the motivation for burrowing by laboratory mice. Appl. Anim. Behav. Sci. 2004;88:343–358. [Google Scholar]
- Smith E, Hay P, Campbell L, Trollor JN. A review of the association between obesity and cognitive function across the lifespan: implications for novel approaches to prevention and treatment. Obes. Rev. 2011;12:740–755. doi: 10.1111/j.1467-789X.2011.00920.x. [DOI] [PubMed] [Google Scholar]
- Soczynska JK, Kennedy SH, Woldeyohannes HO, Liauw SS, Alsuwaidan M, Yim CY, McIntyre RS. Mood disorders and obesity: understanding inflammation as a pathophysiological nexus. Neuromolecular Med. 2011;13:93–116. doi: 10.1007/s12017-010-8140-8. [DOI] [PubMed] [Google Scholar]
- Staff PDR. Physicians' Desk Reference. 66th Edition. PDR Network; 2011. [Google Scholar]
- Surwit RS, Kuhn CM, Cochrane C, McCubbin JA, Feinglos MN. Diet-induced type II diabetes in C57BL/6J mice. Diabetes. 1988;37:1163–1167. doi: 10.2337/diab.37.9.1163. [DOI] [PubMed] [Google Scholar]
- Umegaki H. Neurodegeneration in diabetes mellitus. Adv. Exp. Med. Biol. 2012;724:258–265. doi: 10.1007/978-1-4614-0653-2_19. [DOI] [PubMed] [Google Scholar]
- van Egmond-Frohlich AW, Widhalm K, de Zwaan M. Association of symptoms of attention-deficit/ hyperactivity disorder with childhood overweight adjusted for confounding parental variables. Int. J. Obes. (Lond.) 2012;36:963–968. doi: 10.1038/ijo.2012.78. [DOI] [PubMed] [Google Scholar]
- Vendruscolo LF, Izídio GS, Takahashi RN, Ramos A. Chronic methylphenidate treatment during adolescence increases anxiety-related behaviors and ethanol drinking in adult spontaneously hypertensive rats. Behav. Pharmacol. 2008;19:21–27. doi: 10.1097/FBP.0b013e3282f3cfbe. [DOI] [PubMed] [Google Scholar]
- Wang GJ, Volkow ND, Logan J, Pappas NR, Wong CT, Zhu W, Netusil N, Fowler JS. Brain dopamine and obesity. Lancet. 2001;357:354–357. doi: 10.1016/s0140-6736(00)03643-6. [DOI] [PubMed] [Google Scholar]
- Wolraich ML, Greenhill LL, Pelham W, Swanson J, Wilens T, Palumbo D, Atkins M, McBurnett K, Bukstein O, August G. Randomized, controlled trial of oros methylphenidate once a day in children with attention-deficit/hyperactivity disorder. Pediatrics. 2001;108:883–892. doi: 10.1542/peds.108.4.883. [DOI] [PubMed] [Google Scholar]
- Yirmiya R, Goshen I. Immune modulation of learning, memory, neural plasticity and neurogenesis. Brain. Behav. Immun. 2011;25:181–213. doi: 10.1016/j.bbi.2010.10.015. [DOI] [PubMed] [Google Scholar]
- York JM, Blevins NA, Baynard T, Freund GG. Mouse testing methods in psychoneuroimmunology: an overview of how to measure sickness, depressive/anxietal, cognitive and physical activity behaviors. Methods Mol. Biol. 2012a;934:243–276. doi: 10.1007/978-1-62703-071-7_13. [DOI] [PubMed] [Google Scholar]
- York JM, McDaniel AW, Blevins NA, Guillet RR, Allison SO, Cengel KA, Freund GG. Individually ventilated cages cause chronic low-grade hypoxia impacting mice hematologically and behaviorally. Brain. Behav. Immun. 2012b;26:951–958. doi: 10.1016/j.bbi.2012.04.008. [DOI] [PMC free article] [PubMed] [Google Scholar]


