Abstract
Background
Death or urgent readmission after hospital discharge is a common adverse event that can be used to compare outcomes of care between institutions. To accurately adjust for risk and to allow for interhospital comparisons of readmission rates, we used administrative data to derive and internally validate an extension of the LACE index, a previously validated index for 30-day death or urgent readmission.
Methods
We randomly selected 500 000 medical and surgical patients discharged to the community from any Ontario hospital between 1 April 2003 and 31 March 2009. We derived a logistic regression model on 250 000 randomly selected patients from this group and modified the final model into an index scoring system, the LACE+ index. We internally validated the LACE+ index using data from the remaining 250 000 patients and compared its performance with that of the original LACE index.
Results
Within 30 days of discharge to the community, 33 825 (6.8%) of the patients had died or had been urgently readmitted. In addition to the variables included in the LACE index (length of stay in hospital [L], acuity of admission [A], comorbidity [C] and emergency department utilization in the 6 months before admission [E]), the LACE+ index incorporated patient age and sex, teaching status of the discharge hospital, acute diagnoses and procedures performed during the index admission, number of days on alternative level of care during the index admission, and number of elective and urgent admissions to hospital in the year before the index admission. The LACE+ index was highly discriminative (C statistic 0.771, 95% confidence interval 0.767–0.775), was well calibrated across most of its range of scores and had a model performance that exceeded that of the LACE index.
Interpretation
The LACE+ index can be used to predict the risk of postdischarge death or urgent readmission on the basis of administrative data for the Ontario population. Its performance exceeds that of the LACE index, and it allows analysts to accurately estimate the risk of important postdischarge outcomes.
Death or urgent readmission after hospital discharge is a relatively common event that is costly to the health care system and has obvious important effects on patients’ health. Being able to accurately identify patients at high risk of these adverse postdischarge outcomes could help to elucidate the mechanisms involved in early death or readmission. In addition, accurately adjusting for the risk of postdischarge death or urgent readmission may permit valid interhospital comparisons based on this outcome.
Several risk prediction models for hospital readmission have been published.1–4 Three of these models 1-3 are cumbersome because they require community-level or socio-economic information (e.g., community-level admission rates, ethnicity, education, postal code or marital status) that is difficult or impractical to obtain or apply. One model (the LACE index 4) includes variables for which values can be determined from either primary data or information in administrative databases. The LACE index uses 4 variables to predict the risk of death or urgent readmission within 30 days after hospital discharge among medical and surgical patients: length of hospital stay (L), acuity of admission (A), comorbidity (C) and emergency department utilization in the 6 months before admission (E). The LACE index was externally validated and had good calibration. Its discrimination was only fair (C statistic 0.684), though equivalent to that of previously published, more complicated models.1–3
The LACE index was derived from data for a small sample of patients (approximately 2500).4 The small sample size could partly explain the small number of variables in the model, as well as the limited amount of information about the index hospital admission. In the study reported here, we determined whether administrative data from a large, population-based sample could be used to extend and improve the LACE index. In particular, we wanted to develop an index that would allow researchers and analysts to use administrative data to better predict the risk of postdischarge outcomes.
Methods
The study was approved by The Ottawa Hospital Research Ethics Board.
Study design
This cohort study involved 500 000 randomly selected patients who had been discharged to the community from a medical or surgical service at any Ontario hospital during the defined study period. We derived the risk index using data from a randomly selected sample of 250 000 patients and internally validated the index using data from the remaining 250 000 patients.
Data sources
We used 4 population-based administrative databases that captured data on all Ontarians. The Discharge Abstract Database (DAD) records all nonpsychiatric admissions to hospital. The Ontario Mental Health Reporting System (OMHRS) captures all inpatient mental health encounters after 2006 (before which these admissions were captured in the DAD). The National Ambulatory Care Reporting System (NACRS) records all emergency department visits. The Registered Patient Database (RPDB) records the death date for all Ontarians.
Study cohort
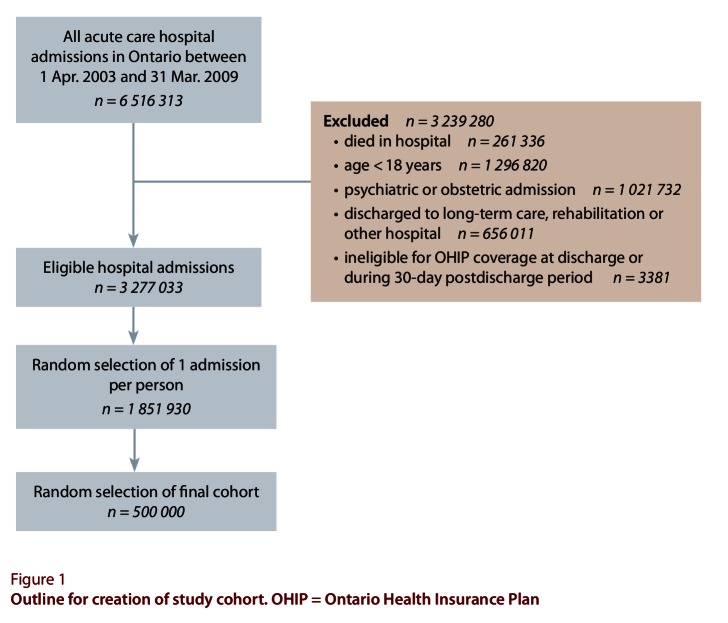
We used the DAD to identify all discharges of adults to the community (i.e., excluding discharges to rehabilitation and long-term care facilities) from medical and surgical services in acute care Ontario hospitals between 1 April 2003 and 31 March 2009. We chose this study period to ensure availability of sufficient data in the population-based databases to create the model covariates and determine the study outcome for all patients. We excluded data for patients who underwent same-day surgeries, because these are similar to outpatient surgeries and involve patients whose characteristics may differ from those of inpatients. If a patient was discharged from an acute care hospital and was transferred directly to another acute care hospital (which was the case for about 4% of admissions during the study period), we linked the 2 hospital stays and considered them as a single admission. We excluded psychiatric and obstetric admissions because they were not included in the original derivation of the LACE index.4 We also excluded admissions where the patient was ineligible for health care coverage in Ontario during the follow-up period, because postdischarge outcomes would not have been captured for these patients.
After identifying all eligible admissions for the study period, we randomly selected one admission per patient and then randomly selected 500 000 patients.
Potential predictors of 30-day death or urgent readmission
We first created the 4 predictors used in the LACE index: length of the index hospital stay (L), in days; acuity of the index admission (A), categorized as urgent or planned; comorbidity of the patient (C), expressed by the Charlson score; and emergency department utilization (E), expressed as the number of visits to the emergency department in the 6 months before the index admission. Hospital length of stay and urgency of admission were determined from the DAD. The Charlson score was calculated from diagnoses for the index admission and the International Statistical Classification of Diseases and Related Health Problems, 10th revision, Canada (ICD-10-CA) codes cited by Quan and colleagues.5 The number of visits to an emergency department in the 6 months before the index admission was determined by linking to the NACRS.
We captured important acute diagnoses and procedures performed during the index admission with a scoring index based on case-mix group (CMG) codes, which we previously derived and internally validated using 200 000 admissions randomly selected from the same patient population as used for the current study.6 The previous study used a smaller sample of admissions because of the computationally intensive nature of the variable-selection procedure used to derive the CMG score. CMGs aggregate acute care inpatients with similar clinical and resource-utilization characteristics and are assigned by an algorithm developed (and revised yearly) by the Canadian Institute for Health Information (CIHI). We assigned a score ranging from –6 to 7 to certain CMG codes that were independently associated with 30-day death or urgent readmission, independent of the LACE score. A CMG score above zero was associated with increased risk, whereas a CMG score below zero was associated with decreased risk. We determined the CMG code for all patients using the 2008 CMG algorithm applied to all hospital admissions.
Finally, we used data in the DAD to create the following covariates for each hospital admission: patient age and sex; number of urgent and elective hospital admissions in the year before the index admission, expressed as separate variables; number of days in an intensive care unit (ICU) during the index admission; number of days with alternative level of care status during the index admission (a status assigned to patients who remain in hospital but are no longer receiving active medical care); and teaching status of the hospital from which the patient was discharged. We further divided nonteaching hospitals according to size, where large hospitals were those with 100 or more beds, and small hospitals were those with fewer than 100 beds. For previous hospital admissions, we chose to use a longer look-back period of 1 year (rather than the 6 months used for previous emergency department visits in the LACE index) because admissions are less common than emergency department visits and because we separated previous hospital stays into urgent and elective categories. We determined the number of days spent in an ICU using validated special care unit codes for ICU treatment.7
For all admissions, there were no missing values for any of the potential predictors, since values originated as or were derived from required fields in the hospital admission abstract.
Outcome
The primary outcome was death or urgent readmission within 30 days of hospital discharge. We determined death status by linking to the RPDB. We determined urgent readmission status by linking to the DAD and OMHRS. We included readmissions regardless of the diagnosis, as long as they were categorized as “urgent” (i.e., unplanned) and were not preceded by an earlier “non-urgent” (i.e., planned) readmission.
Derivation of the LACE+ index
We first derived a logistic regression model for 30-day death or urgent readmission using data for a randomly selected group of 250 000 patients. We entered all candidate covariates into an initial multivariable model and then performed variable selection (with a significance level of α = 0.05) using methods described by Sauerbrei and Royston.8 These methods combined backward selection with a systematic process of identifying the optimal first-degree fractional polynomial transformation for continuous covariates. We did not force any covariates into the model, including the 4 LACE predictors. Once we had identified all significant covariates, we created a list of candidate interaction terms on the basis of clinical intuition, added them jointly to the model and used backward selection to remove interactions with a p value greater than or equal to 0.0001.
We then used methods described by Sullivan and colleagues 9 to modify the final logistic regression model into a risk index, which we refer to as the LACE+ index. The number of points assigned to each binomial variable was equal to the covariate’s regression coefficient divided by a fixed constant (the category in the model with the smallest absolute value in regression units) and rounded to the nearest integer. For continuous variables, we first categorized the variable using decile cut points. The number of points assigned to each category was equal to the difference in regression units between its midpoint and the midpoint of the reference category divided by the constant and rounded to the nearest integer. We combined continuous-variable categories to which the same number of points had been assigned. The reference category for each variable in the model was assigned 0 points.
Assessment and internal validation of the LACE+ index
Using data for the remaining 250 000 patients (the validation set), we assessed the ability of the LACE+ index to predict 30-day death or urgent readmission. We first calculated each patient’s LACE+ index. We then fitted a logistic regression model with 30-day death or urgent readmission as the outcome and the LACE+ index as the independent predictor. We assessed the model’s discrimination using the C statistic with 95% confidence intervals (CIs) 10 and assessed overall calibration using the Hosmer–Lemeshow (H-L) goodness-of-fit test with 8 degrees of freedom.11 The H-L test compares the observed to expected event rates within risk deciles of the population, where a nonsignificant test statistic (p > 0.05) suggests good calibration. We further assessed calibration by comparing the expected and observed event rates within 10-point strata. The expected risk of death or urgent readmission for each patient was calculated as the inverse of 1 + e–(intercept + β*LACE+ score), where β was the coefficient of the LACE+ index in the regression model. The expected and observed event rates were considered similar if the expected rate was within the exact 95% CI 12 around the observed rate.
In the validation set, we compared the performance of the original LACE index with that of the LACE+ index using the integrated discrimination improvement (IDI) and the net reclassification improvement (NRI).13 The IDI is the discrimination slope (the mean predicted risk for patients with the event minus that for patients without the event) of a model with the LACE+ index as the independent predictor minus the discrimination slope of a model with the LACE index as the independent predictor. An IDI above zero indicates better discrimination (i.e., a larger separation in mean predicted risk between events and nonevents) with the LACE+ index. The NRI measured the amount of correct reclassification (i.e., predicted risk moving upward for events and downward for nonevents) when the predicted risk of death or urgent readmission based on the LACE+ index was compared with that based on the LACE index. The NRI equals the proportion of correct minus incorrect reclassifications among events (i.e., patients who died or were urgently readmitted) plus the proportion of correct minus incorrect reclassifications among nonevents. An NRI above zero indicates better risk prediction with the new (i.e., LACE+) model. Because no established risk categories for early death or urgent readmission exist, we calculated a category-less NRI,14 where “upward” reclassification was defined as a higher event risk predicted by the LACE+ index and “downward” reclassification was defined as a lower event risk predicted by the LACE+ index.
Results
Of approximately 6.5 million hospital admissions in Ontario during the study period, nearly 3.3 million were eligible for the study (Figure 1). These admissions involved more than 1.8 million individuals, of whom 500 000 were randomly selected for the study.
Figure 1.
Outline for creation of study cohort
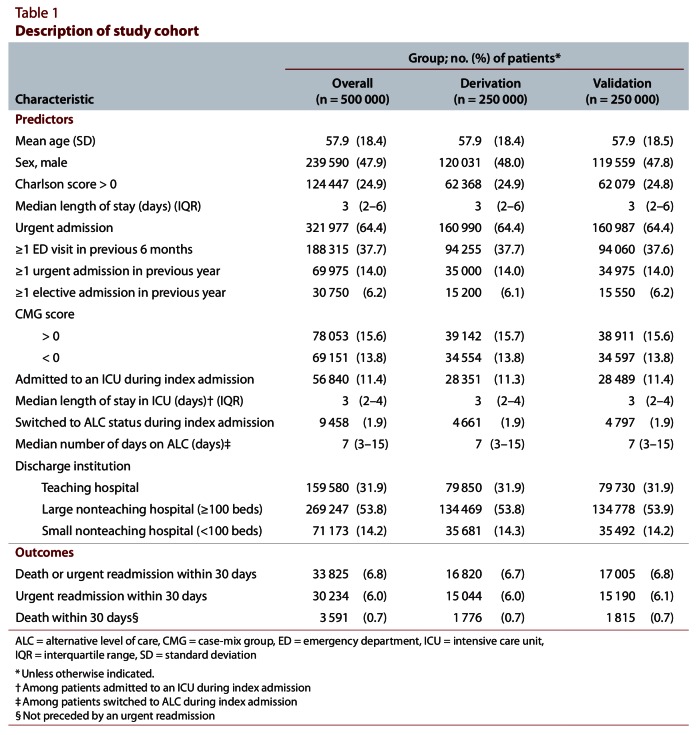
Patients were generally middle-aged and had few documented chronic comorbidities (Table 1). Approximately one-third had visited the emergency department in the previous 6 months; fewer had been admitted to hospital urgently (14.0%) or electively (6.2%) in the past year. About half of the admissions had been to a large nonteaching hospital. In nearly one-third of the admissions, the patient had an acute diagnosis or procedure associated with an increased (CMG score > 0) or decreased (CMG score < 0) risk of 30-day death or urgent readmission. Admission to an ICU (11.4% of patients) or transfer to an alternative level of care (1.9%) was uncommon during the index admission. After discharge to the community, 6.8% of the patients died or were urgently readmitted within 30 days. Only 0.7% of patients died within 30 days without a prior urgent readmission. The derivation and validation sets were virtually identical (Table 1).
Table 1.
Description of study cohort
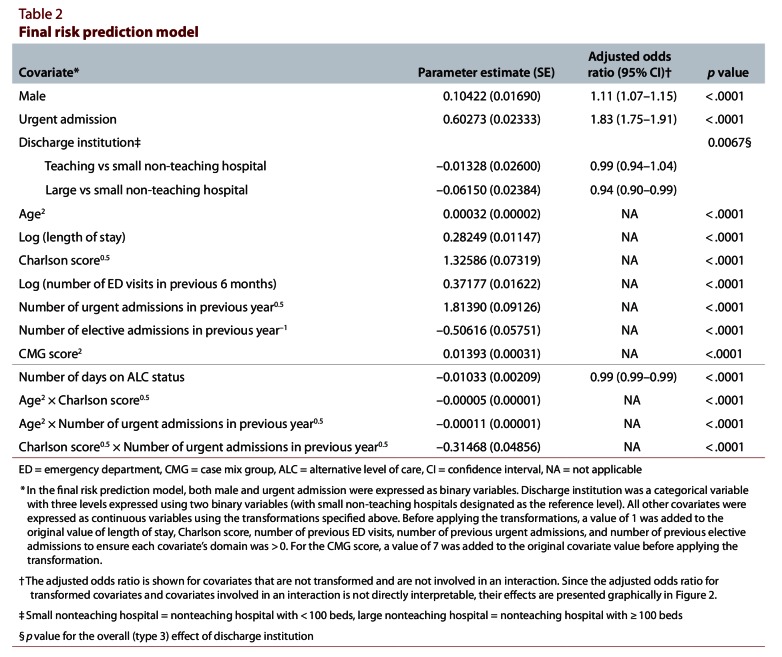
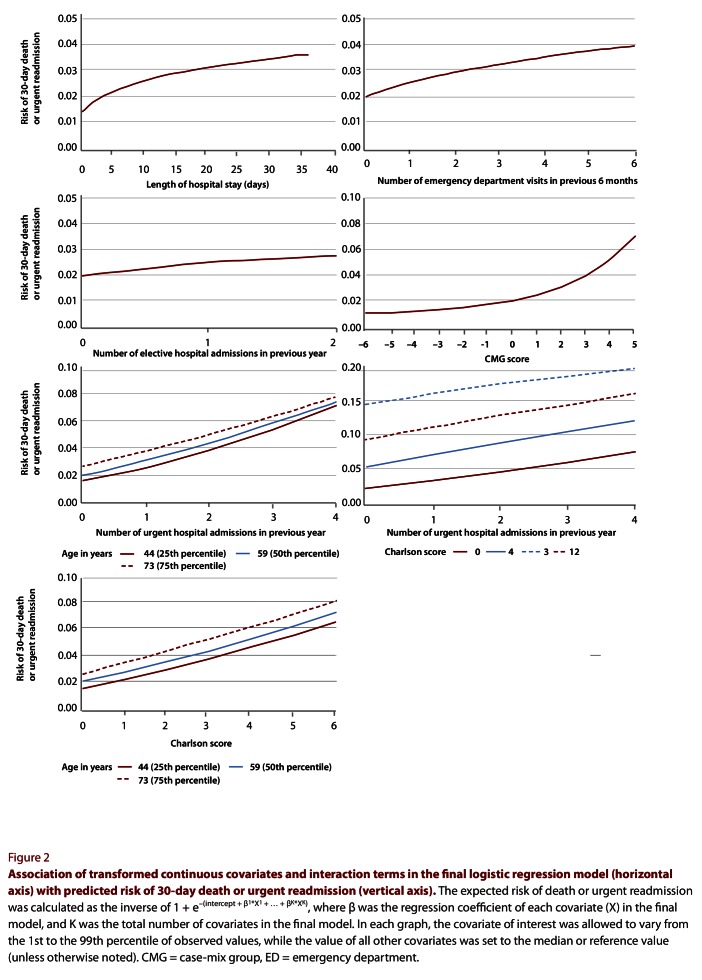
With the exception of number of days in an ICU, all covariates that we considered were significantly associated with 30-day death or urgent readmission and were included in the final model (Textbox 1). Of the continuous covariates, all except number of days on alternative level of care were modelled with either a logarithmic, square root, inverse or squared transformation (Table 2; Figure 2). Six interaction terms were applied to this model: age combined with Charlson score, number of urgent admissions in the previous year, CMG score and length of stay; urgency of admission combined with CMG score; and Charlson score combined with number of urgent admissions in the previous year. Of these, 3 were highly significant (p < 0.0001) and were ultimately retained (Table 3; Figure 2).
Textbox 1.

Components in the LACE and LACE+ indices
Table 2.
Final risk prediction model
Figure 2.
Association of transformed continuous covariates and interaction terms in the final logistic regression model with predicted risk of 30-day death or urgent readmission
Table 3.
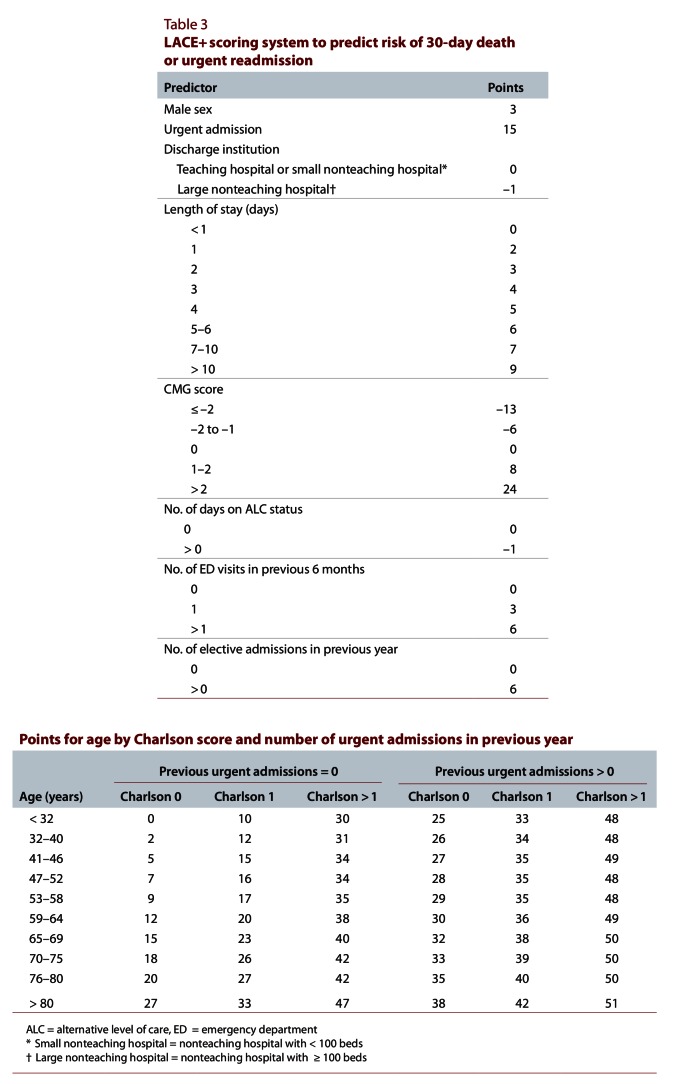
LACE+ scoring system to predict risk of 30-day death or urgent readmission
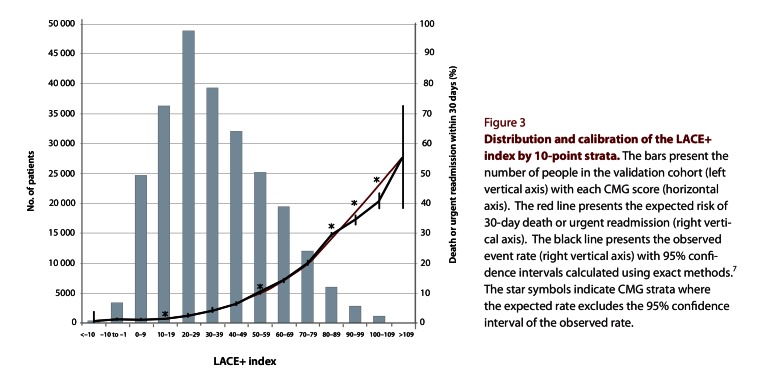
We then modified the final logistic regression model into a scoring index for 30-day death or urgent readmission (Table 3). For patient age, the number of points assigned depended on the Charlson score and the number of urgent admissions in the previous year. The final LACE+ index ranged from –15 to 114. In the validation set, the distribution of the LACE+ index was skewed slightly to the right (Figure 3).
Table 4.
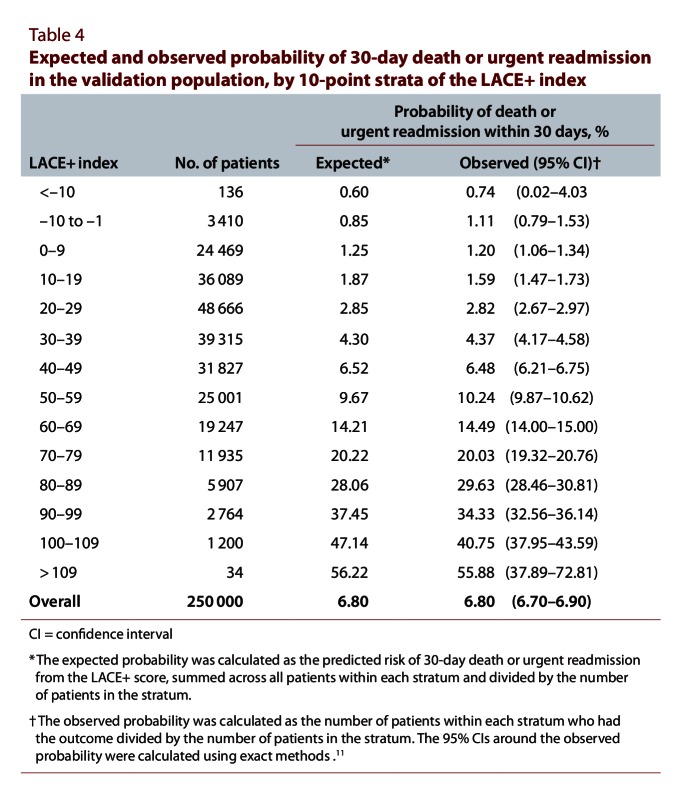
Expected and observed probability of 30-day death or urgent readmission in the validation population, by 10-point strata of the LACE+ index
Figure 3.
Distribution and calibration of the LACE+ index by 10-point strata
The LACE+ index was significantly associated with the risk of 30-day death or urgent readmission, and the odds ratio for a 1-point increase in the LACE+ index was 1.045 (95% CI 1.044–1.045). The index was highly discriminative, indicated by a C statistic of 0.771 (95% CI 0.767–0.775), which significantly exceeded that of the LACE index for the same population (C statistic 0.738, 95% CI 0.734–0.741). The H-L test for the LACE+ index was highly significant (H-L statistic 31.93, p < 0.0001), which suggests poor calibration; conversely, the H-L statistic for the LACE index was not significant (H-L statistic 13.38, p = 0.10), which suggests good calibration. However, the calibration graph comparing the observed and expected event rates within strata of the LACE+ index showed that the calibration of the LACE+ index was in fact quite good. The observed and expected rates were very similar in all but 2 of the highest-risk strata (Figure 3). These high-risk strata (representing patients with a LACE+ index between 90 and 109) constituted only about 1.6% of the validation set (Table 4). Across all risk strata, the overall expected rate was identical with the observed rate (Table 4).
The LACE+ index was significantly associated with each outcome separately. For death within 30 days, the odds ratio for a 1-point increase in the LACE+ index was 1.068 (95% CI 1.066–1.069). The index had excellent discrimination for 30-day death (C statistic 0.883, 95% CI 0.879–0.888), but the H-L test suggested that it was poorly calibrated (H-L statistic 114.24, p < 0.0001). For urgent readmission within 30 days, the odds ratio for a 1-point increase in the LACE+ index was 1.040 (95% CI 1.040–1.041). The index had good discrimination for 30-day urgent readmission (C statistic 0.753, 95% CI 0.749–0.757), but again, the H-L test suggested poor calibration (H-L statistic 58.93, p < 0.0001).
The IDI and NRI both indicated that the LACE+ index was significantly better at predicting 30-day death or urgent readmission than the original LACE index. The IDI was 0.020 (95% CI 0.019–0.021) on the absolute scale and 16.7% (15. 3%–18.2%) on the relative scale, both of which suggested that overall discrimination was better with the LACE+ index than with the LACE index. The NRI was 0.336 (95% CI 0.321–0.352), which indicated that a significantly higher proportion of patients were correctly reclassified with the LACE+ index.
Because the CMG score cannot be calculated for hospital admissions outside Canada, we conducted a secondary analysis to determine the performance of the LACE+ index without the CMG score for potential use of this index in other countries. When the CMG score was assigned a value of 0 points for all patients, the discriminative ability of the LACE+ index for predicting 30-day death or urgent readmission was only slightly worse (Table 5). When each outcome was analyzed separately, removing the CMG score was more detrimental for predicting 30-day death than for predicting 30-day urgent readmission (Table 5).
Table 5.
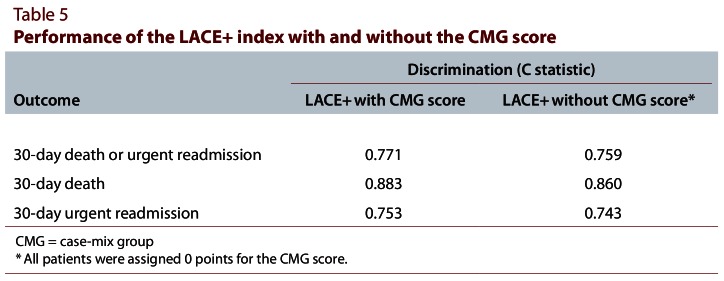
Performance of the LACE+ index with and without the CMG score
Interpretation
In this study, we derived and internally validated a new index, the LACE+ index, for 30-day death or urgent readmission that can be calculated from administrative data. This index had excellent discrimination and was well calibrated across most of its range.
The LACE+ index contained all of the predictors included in the LACE index, but it also captured information on patient age and sex, acute conditions and procedures performed during the index admission, whether the patient changed from active care to an alternative level of care during the admission, the teaching status of the discharge hospital and the number of urgent and elective admissions in the year before the index admission. Previous admissions were not found to be a significant predictor of 30-day death or urgent readmission in the derivation of the LACE index.4 The fact that previous admissions were a significant independent predictor in this study was likely due to the longer look-back period and the larger sample size. When these new covariates were combined with the predictors from the LACE index, the ability to predict risk of 30-day death or urgent readmission improved significantly.
Given the large size of the validation set, we were not surprised that the H-L statistic (for calibration) was highly significant for the LACE+ index. With very large sample sizes, even a slight departure from a perfect fit can result in significance with this test.15 Therefore, as suggested by Kramer and Zimmerman,15 we supplemented the results of the H-L test by constructing a calibration graph comparing the observed and predicted event rates within 10-point strata for the LACE+ index. The calibration graph revealed close agreement between the observed and predicted event rates in all but the highest-risk strata, which accounted for only a very small proportion of patients. Although the 95% CI around the observed event rate excluded the expected rate for 5 of the strata (Figure 3), 2 of these strata contained a large number of patients and thus had an extremely narrow CI around the observed rate (Table 5).
We used several methods to compare the performance of the LACE+ index and the LACE index. The C statistic, IDI and NRI all indicated that the performance of the LACE+ index was superior. The H-L statistic suggested that calibration of the LACE index was better, but this was likely because the LACE+ index had better discrimination (calibration often worsens when discrimination improves). The C statistic of 0.738 for the LACE index in this study was notably higher than the C statistic of 0.684 reported from external validation of the LACE index in the original study.4 This discrepancy was most likely due to measurement errors in the original study, in which transfer admissions were not linked as a single admission (instead, transfer admissions in the original study were based solely on transfer codes in the DAD). As a result, the rate of urgent readmissions was higher in the original study than in the current study (7.3% v. 6.0%).
A major advantage of the LACE+ index is that all of its components can be readily determined from data available in Canadian administrative databases. The index therefore has great utility for researchers using such databases, because it could be used as a risk adjustment methodology in analyses involving large patient populations where early death or readmission to hospital is an outcome. Furthermore, the LACE+ index does not require the use of community-level or socio-economic information, which is often difficult to obtain and may be unavailable for certain patients.
We believe that the LACE+ index could be used in several ways. First, it could be used to adjust for important covariates when comparing postdischarge outcomes between institutions. More specifically, the LACE+ index could use routinely collected data to generate the expected number of outcomes from particular institutions, which could be compared with observed outcomes to gauge performance. Second, the LACE+ index could be used to adjust for trends in important predictors of postdischarge outcomes when outcomes from the same institution are examined over time. This type of adjustment would be especially helpful in studies of the effect of particular interventions or other events on postdischarge outcomes.
This study had several important strengths and limitations. First, because the LACE+ index was derived and validated with a large, randomly selected, population-based sample from Ontario, we believe that it can be confidently applied to all medical and surgical patients admitted to hospitals in Ontario. However, before this index is applied elsewhere in Canada, it should be validated in other provinces. Second, because we had access to population-based data sets that included information on all deaths, hospital admissions, and emergency department visits in Ontario, we were able to accurately measure death and urgent readmission status, as well as previous health care utilization characteristics. Researchers with access to information from only a single health care institution may not be able to measure the index predictors or postdischarge outcomes as accurately and may find that the LACE+ index does not perform as well for their patients. Third, because CMG codes (determined by CIHI) are available only for Canadian hospital admissions, the CMG score cannot be calculated for administrative data outside of Canada. However, given that the discrimination of the LACE+ index for predicting 30-day urgent readmission was only slightly worse when points from the CMG score were removed, researchers from other countries could apply the LACE+ index without the CMG score. Alternatively, researchers could replace the CMG score with data for their own jurisdiction’s similar index for acute diagnoses and procedures. For example, researchers from the United States could substitute a scoring index based on the widely used diagnosis-related groups developed by the US Centers for Medicare and Medicaid Services. Before the LACE+ index could be applied in other countries, however, it would have to be validated in those countries’ respective patient populations. As well, because CIHI determines the CMG code from retrospectively abstracted hospital data, inclusion of the CMG score means that the LACE+ index cannot be used with primarily collected data.
In this study, we derived and internally validated an accurate risk index for 30-day death or urgent readmission that can be readily determined from administrative data. This index could be used as a risk-adjustment tool to allow for better inter-hospital comparisons of postdischarge outcomes or for patient-level adjustment of confounders in studies evaluating the effectiveness of postdischarge interventions.
Biographies
Carl van Walraven, MD, MSc, is a Senior Scientist in Clinical Epidemiology at the Ottawa Hospital Research Institute (OHRI), Ottawa, Ontario, Canada; Adjunct Scientist at the Institute for Clinical Evaluative Sciences (ICES), Toronto, Ontario, Canada; and Associate Professor of Medicine at the University of Ottawa, Ottawa, Ontario, Canada.
Jenna Wong, MSc, is a Methodologist in Clinical Epidemiology at OHRI and an Analyst at ICES.
Alan J. Forster, MD, MSc, is a Senior Scientist in Clinical Epidemiology at OHRI, an Adjunct Scientist at ICES and Associate Professor of Medicine at the University of Ottawa.
Footnotes
Competing interests: None declared.
Funding source: This study was funded by the Department of Medicine, University of Ottawa.
Carl van Walraven conceived the project idea, wrote the study protocol, directed the study analysis, wrote the first draft of the paper and is the guarantor for the study. Jenna Wong conducted the statistical analysis, produced the tables and figures, and contributed to the writing and editing of the manuscript. Alan Forster helped guide the analysis and interpretation of the study results and also critically reviewed the paper for intellectual content. All authors have read and approved the final version of the manuscript.
References
- 1.Bottle Alex, Aylin Paul, Majeed Azeem. Identifying patients at high risk of emergency hospital admissions: a logistic regression analysis. J R Soc Med. 2006;99(8):406–414. doi: 10.1258/jrsm.99.8.406. http://www.ncbi.nlm.nih.gov/pmc/articles/pmid/16893941. [DOI] [PMC free article] [PubMed] [Google Scholar]
- 2.Billings John, Dixon Jennifer, Mijanovich Tod, Wennberg David. Case finding for patients at risk of readmission to hospital: development of algorithm to identify high risk patients. BMJ. 2006;333(7563):327. doi: 10.1136/bmj.38870.657917.AE. http://www.ncbi.nlm.nih.gov/pmc/articles/pmid/16815882. [DOI] [PMC free article] [PubMed] [Google Scholar]
- 3.Hasan Omar, Meltzer David O, Shaykevich Shimon A, Bell Chaim M, Kaboli Peter J, Auerbach Andrew D, Wetterneck Tosha B, Arora Vineet M, Zhang James, Schnipper Jeffrey L. Hospital readmission in general medicine patients: a prediction model. J Gen Intern Med. 2010;25(3):211–219. doi: 10.1007/s11606-009-1196-1. http://www.ncbi.nlm.nih.gov/pmc/articles/pmid/20013068. [DOI] [PMC free article] [PubMed] [Google Scholar]
- 4.van Carl, Walraven, Dhalla Irfan A, Bell Chaim, Etchells Edward, Stiell Ian G, Zarnke Kelly, Austin Peter C, Forster Alan J. Derivation and validation of an index to predict early death or unplanned readmission after discharge from hospital to the community. CMAJ. 2010 Mar 1;182(6):551–557. doi: 10.1503/cmaj.091117. http://www.cmaj.ca/cgi/doi/10.1503/cmaj.091117. [DOI] [PMC free article] [PubMed] [Google Scholar]
- 5.Quan Hude, Sundararajan Vijaya, Halfon Patricia, Fong Andrew, Burnand Bernard, Luthi Jean-Christophe, Saunders L D, Beck Cynthia A, Feasby Thomas E, Ghali William A. Coding algorithms for defining comorbidities in ICD-9-CM and ICD-10 administrative data. Med Care. 2005;43(11):1130–1139. doi: 10.1097/01.mlr.0000182534.19832.83. http://www.scholaruniverse.com/ncbi-linkout?id=16224307. [DOI] [PubMed] [Google Scholar]
- 6.van Walraven C, Wong J, Forster A J. Derivation and validation of a diagnostic score based on case-mix groups to predict 30-day death or urgent readmission. Open Med. 2012;6(3):e80–e89. [PMC free article] [PubMed] [Google Scholar]
- 7.Scales Damon C, Guan Jun, Martin Claudio M, Redelmeier Donald A. Administrative data accurately identified intensive care unit admissions in Ontario. J Clin Epidemiol. 2006;59(8):802–807. doi: 10.1016/j.jclinepi.2005.11.015. http://linkinghub.elsevier.com/retrieve/pii/S0895435606000047. [DOI] [PubMed] [Google Scholar]
- 8.Sauerbrei W, Royston P. Building multivariable prognostic and diagnostic models: transformation of the predictors by using fractional polynomials. J R Stat Soc Ser A. 1999;162(1):71–94. doi: 10.1111/1467-985X.00122. http://doi.wiley.com/10.1111/1467-985X.00122. [DOI] [Google Scholar]
- 9.Sullivan Lisa M, Massaro Joseph M, D'Agostino Ralph B., Sr Presentation of multivariate data for clinical use: The Framingham Study risk score functions. Stat Med. 2004 May 30;23(10):1631–1660. doi: 10.1002/sim.1742. http://www.scholaruniverse.com/ncbi-linkout?id=15122742. [DOI] [PubMed] [Google Scholar]
- 10.Gonen M. Analyzing receiver operating characteristic curves with SAS. Cary (NC): SAS Institute Inc; 2007. Single continuous predictor; pp. 15–36. [Google Scholar]
- 11.Hosmer D W, Hosmer T, Le Cessie S, Lemeshow S. A comparison of goodness-of-fit tests for the logistic regression model. Stat Med. 1997 May 15;16(9):965–980. doi: 10.1002/(SICI)1097-0258(19970515)16:9<965::AID-SIM509>3.0.CO;2-O. [DOI] [PubMed] [Google Scholar]
- 12.Daly Leslie. Simple SAS macros for the calculation of exact binomial and Poisson confidence limits. Comput Biol Med. 1992;22(5):351–361. doi: 10.1016/0010-4825(92)90023-G. http://linkinghub.elsevier.com/retrieve/pii/001048259290023G. [DOI] [PubMed] [Google Scholar]
- 13.Pencina Michael J, D'Agostino Ralph B, Sr, D'Agostino Ralph B, Jr, Vasan Ramachandran S. Evaluating the added predictive ability of a new marker: from area under the ROC curve to reclassification and beyond. Stat Med. 2008 Jan 30;27(2):157–172. doi: 10.1002/sim.2929. http://www.scholaruniverse.com/ncbi-linkout?id=17569110. [DOI] [PubMed] [Google Scholar]
- 14.Pencina Michael J, D'Agostino Ralph B, Sr, Steyerberg Ewout W. Extensions of net reclassification improvement calculations to measure usefulness of new biomarkers. Stat Med. 2010 Nov 5;30(1):11–21. doi: 10.1002/sim.4085. http://www.ncbi.nlm.nih.gov/pmc/articles/pmid/21204120. [DOI] [PMC free article] [PubMed] [Google Scholar]
- 15.Kramer Andrew A, Zimmerman Jack E. Assessing the calibration of mortality benchmarks in critical care: The Hosmer-Lemeshow test revisited*. Crit Care Med. 2007;35(9):2052–2056. doi: 10.1097/01.CCM.0000275267.64078.B0. http://content.wkhealth.com/linkback/openurl?sid=WKPTLP:landingpage&an=00003246-200709000-00007. [DOI] [PubMed] [Google Scholar]


