

Abstract
Study Objective:
To evaluate whether actigraphy-measured total sleep time and other sleep characteristics predict incident hypertension in older men.
Methods:
Study subjects were community-dwelling participants in the ancillary sleep study of the Osteoporotic Fractures in Men Study (MrOS) who were normotensive at the time of actigraphy (based on self-report, lack of antihypertensive medication use, and with systolic blood pressure < 140 mm Hg and diastolic blood pressure < 90 mm Hg). In 853 community-dwelling men 67 years and older (mean 75.1 years), sleep measures (total sleep time [TST]), percent sleep [%-sleep], latency, and wake after sleep onset [WASO]) were obtained using validated wrist actigraphy with data collected over a mean duration of 5.2 consecutive 24-h periods. We evaluated incident hypertension (based on self-report, use of antihypertensive medication, or measured systolic blood pressure ≥ 140 mm Hg or diastolic blood pressure ≥ 90 mm Hg) at a follow-up visit an average of 3.4 years later. Baseline prehypertension was defined as a systolic blood pressure 120 to < 140 mm Hg or diastolic blood pressure 80 to < 90 mm Hg.
Results:
At follow-up, 31% of initially normotensive men were hypertensive (264 of 853). Those with incident hypertension had higher baseline body mass index (BMI; kg/m2) and were more likely to have had prehypertension at the sleep visit than those men who remained normotensive. However, neither TST (reference 6 to < 8 h; < 6 h OR 0.96 [95% CI 0.7, 1.3] and ≥ 8 h OR 0.93 [0.5, 1.7]) nor the other actigraphic-measured sleep variables, including % -sleep (reference > 85%; < 70% OR 1.17 [0.66, 2.08]) and 70% to ≤ 85% OR 1.23 (0.9, 1.68), sleep latency (reference < 30 min; ≥ 30 min OR 1.29 [0.94, 1.76]), or WASO (reference < 30 min; 30 to < 60 min OR 0.7 [0.43, 1.14] and ≥ 60 min OR 0.92 [0.58, 1.47]) differed in those community-dwelling men who developed incident hypertension compared to those who remained normotensive.
Conclusion:
TST and other sleep parameters determined by wrist actigraphy were not associated with incident hypertension in community-dwelling older men.
Citation:
Fung MM; Peters K; Ancoli-Israel S; Redline S; Stone KL; Barrett-Connor E. Total sleep time and other sleep characteristics measured by actigraphy do not predict incident hypertension in a cohort of community-dwelling older men. J Clin Sleep Med 2013;9(6):585-591.
Keywords: Actigraphy, total sleep time, percent sleep, sleep latency, hypertension, older men
Short sleep duration has been associated with cardiovascular disease and mortality.1–4 As these studies were entirely observational, cause and effect remain unclear, particularly because the majority of the studies are cross-sectional. Previous studies have also not clarified whether there are potential modifiers of the relationship between sleep and cardiovascular disease that could assist in better delineating the relationship, such as hypertension (HTN).
Studies evaluating HTN as a potential mediator of such cardiovascular morbidity have revealed mixed results.5–8 Study designs have varied widely, often relying on self-reports and questionnaires, and have primarily been cross-sectional in design. Most of the studies that previously revealed an association between shorter sleep durations and HTN were in young populations5; in subgroup analyses, the association was not observed in older groups7–9 nor seen in men.10 The relationship between sleep and HTN may be particularly difficult to evaluate in older individuals, given their higher risk for HTN and the high incidence of sleep disorders. Common sleep disorders in older individuals, which may shorten their sleep duration and quality, include insomnia and frequent awakenings, due in part to their medications and comorbid conditions, such as urinary frequency and difficulty breathing. However, evaluation of this relationship is important, given that treatment and interventions are available for both sleep disorders and for HTN which could have significant impact in the older populations.
BRIEF SUMMARY
Current Knowledge/Study Rationale: Studies have shown an inconsistent association between total sleep time and hypertension. This prospective study was performed to evaluate this relationship using actigraphy measured sleep variables in community-dwelling older men.
Study Impact: This study indicates that short sleep time and other indicators of poor sleep were not associated with incident hypertension in older men, which is consistent with other studies of older subjects. The effect of reduced sleep may have a greater effect in the development of hypertension in younger individuals.
Total sleep time (TST) has been studied extensively, although less commonly in older individuals, but other objective measures of sleep quality, such as sleep latency or percent sleep (%-sleep), have not been commonly investigated to determine whether they are associated with incident HTN. Here, we report TST and these other secondary sleep characteristics using acti-graphically obtained objective sleep data to determine whether TST and other characteristics of poor sleep would predict incident HTN in older community-dwelling men. Demonstrating a role for actigraphy in predicting HTN development could have clinical utility since actigraphy is noninvasive and relatively readily available.
METHODS
Study Subjects
Study subjects were participants in the Osteoporotic Fractures in Men Study (MrOS), a cohort of community-dwelling men described previously.11,12 Of 5,994 MrOs men, 3,135 (53.3%) participated in the ancillary Outcomes of Sleep Disorders in Older Men Study (MrOS Sleep Study) between 2003 and 2005. Of the original cohort, 2,859 participants did not participate in the sleep study because they were unwilling (N = 1,997), not screened because recruitment goals were met (N = 332), died before the sleep study visit (N = 344), ineligible due to exclusion criteria such as use of mechanical devices during sleep (including positive airway pressure devices, oral appliances for snoring or sleep apnea, or oxygen therapy; N = 150), or quit the MrOS study before the sleep study was offered (N = 36). Of the 3,135 sleep-study enrolled participants, 2,753 had valid actigraphy and follow-up data.
Among these 2,753 older men, 1,860 (67.6%) had a history of HTN, were taking anti-hypertensive medications, or had an elevated systolic blood pressure (SBP) ≥ 140 mm Hg, or diastolic blood pressure (DBP) ≥ 90 mm Hg at baseline and were excluded from the current study of incident HTN; furthermore 39 participants had missing HTN data at either baseline or follow-up and were also excluded; 1 participant was missing actigraphy measures at baseline, leaving 853 normotensive participants for this analysis. The mean follow-up time was 3.4 (SD 0.46) years.
All protocols were approved by the institutional review boards at the respective enrollment sites, and participants signed informed consent to participate in each visit of the MrOS Sleep Study.
Classification and Measurement of Hypertension (HTN)
At both the baseline and the follow-up visits, HTN was defined as self-reported (“Have you ever had high blood pressure?”), current use of at least one antihypertensive medication, SBP ≥ 140 mm Hg, or DBP ≥ 90 mm Hg. Prehypertension was classified as a SBP 120 to < 140 mm Hg or DBP 80 to < 90 mm Hg.13 Seated blood pressures were measured in the same manner at each visit. A mercury sphygmomanometer was used at baseline, but a BP Tru automated blood pressure monitor (model BMP-300; Coquitlam, British Columbia, Canada) was used at follow-up, due to prohibition of mercury sphygmomanometers for safety reasons. The BP Tru device, which is commonly used in clinical trials for HTN, has been compared to manual mercury readings and was shown to have high quality and accuracy.14 Baseline blood pressure was measured at a clinic visit an average of 1.7 (SD 11.1) days before the start of the actigraphy recordings.
Other Measures
Self-administered questionnaires were used at the time of the sleep study to ascertain demographic and lifestyle information and personal and family medical history, including HTN, self-reported diabetes, and cardiovascular disease (history of myocardial infarction, angina, congestive heart failure, coronary bypass surgery, transient ischemic attack, stroke, or rheumatic heart disease). Race/ethnicity was self-reported using a questionnaire with a choice of 5 categories (Caucasian/White, African American/Black, Asian, Hispanic, and Other). Interviews or examinations by trained study staff members included measures of functional status and anthropometric data. Physical activity was assessed using the physical activity scale for the elderly (PASE).15 Depressed mood was assessed using the Geriatric Depression Scale (GDS), a 15-point scale of yes/no questions; a standard cutpoint ≥ 6 was used to define depression.16 Participants also reported tobacco use (current, past, or never) and alcohol use (drinks per week). Participants were asked to bring in all prescription and nonprescription medications used within the preceding 30 days, which were entered into an electronic database; each medication was matched to its ingredient(s) based on the Iowa Drug Information Service (IDIS) Drug Vocabulary (College of Pharmacy, University of Iowa, Iowa City, IA).17 Participants were asked whether each medication was used for sleep, and if so, the subject was considered to have “Use of Sleep Medication.” Height (cm) was measured on regularly calibrated Harpenden stadiometers and weight (kg) on calibrated standard balance beam or digital scales. Body mass index (BMI) was calculated as kg/m2. Waist, hip, and neck circumferences were measured using a tape measure and standard techniques.18
Sleep Duration and Fragmentation
Objective sleep characteristics, including TST, %-sleep (an estimate of sleep efficiency, the % of the sleep period spent asleep), sleep latency, and wake after sleep onset (WASO), were determined by wrist actigraphy (Sleepwatch-O, Ambulatory Monitoring, Inc., Ardsley NY), which measures acceleration using a piezoelectric biomorph-ceramic cantilevered beam and that generates a voltage each time the actigraph is moved. Participants were asked to wear the actigraph on their non-dominant wrist continuously, to be removed only when bathing or doing water sports. Data were averaged over the entire recording period. Data were collected continuously and stored in 1-min epochs. The digital integration mode of data collection, which sums the absolute level of acceleration on a second-by-second basis over each 1-min epoch, was used to quantify the amount of movement in each minute. The University of California San Diego scoring algorithm within the Action W-2 software (Ambulatory Monitoring, Inc) was used to score the data for sleep and wake times.19 This algorithm calculates a moving average, which takes into account levels of movement immediately prior to and after the current minute, to determine if that minute should be coded as sleep or wake. Actigraphy has been used for over 25 years and has been shown to provide a reliable estimate of sleep/wake status.20 This technique for estimating sleep duration has been validated against polysomnography in this cohort.21
While wearing the actigraph, participants completed sleep diaries that included time into and time out of bed and times the actigraph was removed. This information was used in editing the actigraphy data files to set intervals for when the participant was in bed trying to sleep (after “lights off”), and to delete from analyses the time when the actigraph was removed. Inter-scorer reliability for editing the actigraph files has been previously found to be high in our group (intra-class coefficient = 0.95), and this measure has been shown to have good concordance with polysomnography for the calculation of total sleep duration, WASO, and %-sleep.21,22
TST was determined as the number of minutes asleep in bed after “lights off,” considering only nighttime sleep. Percent sleep (%-sleep), was determined by the percentage of time (0-100) the participant was sleeping between from sleep onset to the last minute scored as sleep while in bed. Sleep latency was the minutes from the time the participant got into bed (based on the sleep diary) to sleep onset, and WASO was the number of minutes scored as wake from sleep onset to the last minute scored as sleep while in bed.
Statistical Analyses
First, the actigraphic sleep variables (primarily TST, followed by %-sleep, sleep latency, and WASO) were evaluated as the predictors. Descriptive and inferential statistics were performed using SAS version 9.2 (SAS Institute, Inc., Cary, NC). Variables potentially related to the actigraphic variables and/ or incident HTN were summarized using means and standard deviations for continuous variables and percentages for categorical variables. Potential covariates were identified a priori. ANOVA, Kruskal-Wallis, and χ2 tests tested the covariates for association with the sleep characteristics and incident HTN for normal continuous, skewed continuous, and categorical variables, respectively. All predictor variables that were significantly associated with incident HTN and at least one of the sleep variables, with the exception of history of cardiovascular disease, at p < 0.10 in both tests were included in the multivariable model in order to maintain the same straightforward model. BMI, waist circumference, baseline blood pressure, and education level were associated with our primary predictor, TST. Baseline age, categorization of prehypertension, and global depression score (GDS) were included based on their association with HTN and at least one of the other sleep variables. History of cardiovascular disease was included based on its strong association with HTN. The list of preselected potential covariates considered is shown in Table 1. Pearson correlation coefficients were assessed for correlation between the sleep characteristics.
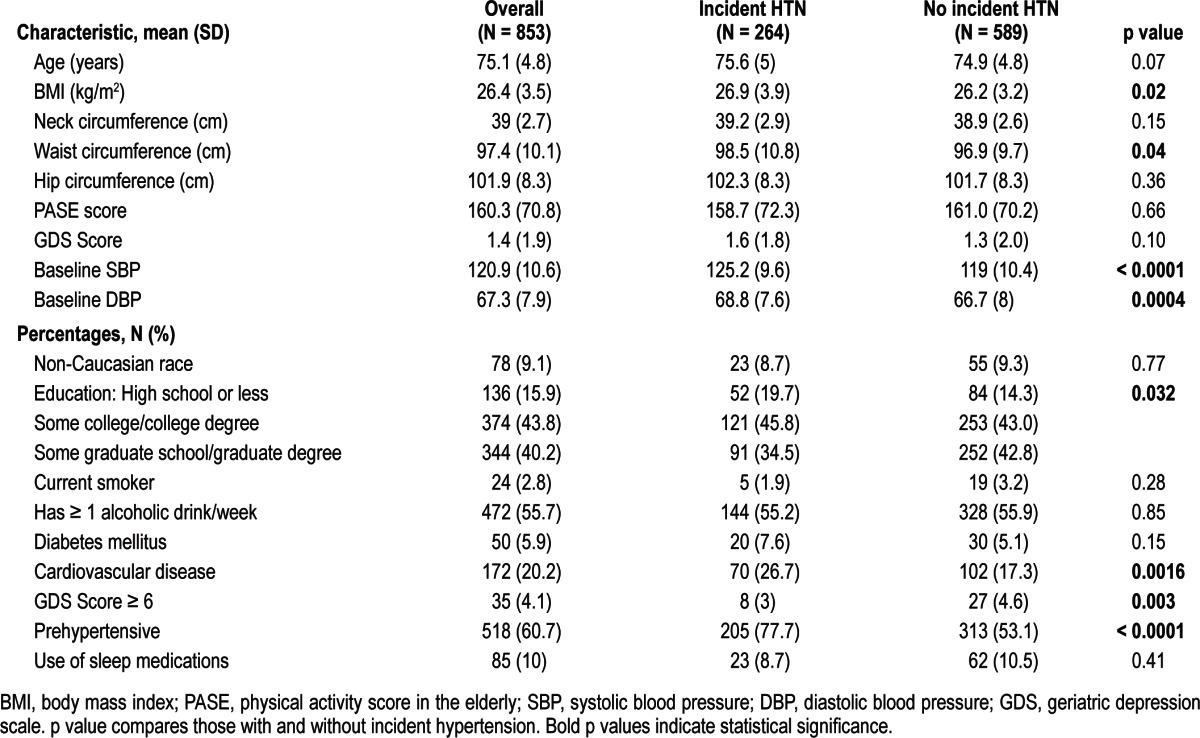
Table 1.
Demographic characteristics of the study cohort: overall and by follow-up hypertension (HTN) status.
The actigraphic exposure variables were expressed as clinically determined ranges (for TST < 6, 6 to < 8, ≥ 8 h; for %-sleep < 70%, 70% to 85%, ≥ 85%; for sleep latency < 30 min, ≥ 30 min; and for WASO < 30, 30 to < 60, and ≥ 60 min) and by quartiles. Logistic regression modeling with incident HTN as the outcome was performed using indicator variables for the clinically determined ranges and for each quartile, using the most optimal sleep category as the reference group. Models were first constructed accounting only for age and non-Caucasian race. Then BMI, mean DBP, education level, prehypertensive, waist circumference, the 15-point GDS, and history of cardiovascular disease were added.
Power was estimated using SAS proc power. More than 99% power was present to detect an odds ratio (OR) > 1.33 given our sample size of ~850 men, assuming an α of 0.025 and the proportion exposed was 31%. Under these assumptions, this study has 80% power to detect an OR > 1.23.
RESULTS
Baseline Characteristics
The 853 normotensive men at baseline had a mean age of 75.1 (SD 4.8) years and mean BMI of 26.4 (3.5); 90.9% were Caucasian. Baseline characteristics are shown in Table 1.
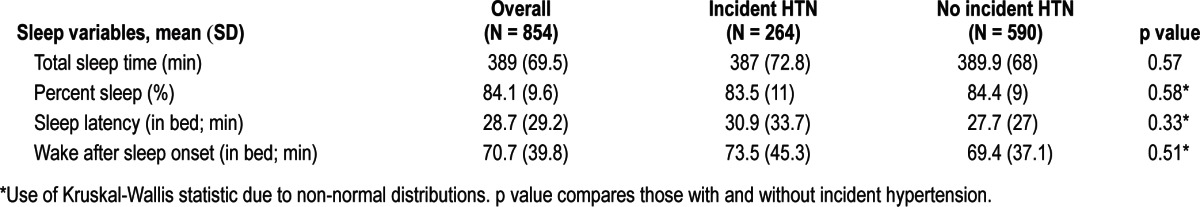
The participants wore the actigraph for an average of 5.2 ± 0.9 nights. As shown in Table 2, participants had a mean TST of 389 min (69.5) or 6.5 h (1.2) and a mean sleep latency of 28.7 min (29.2) at baseline. Mean WASO was 70.7 min (39.8) with a mean %-sleep of 84.1% (9.6%). These sleep characteristics were highly correlated, particularly %-sleep with both WASO (r = -0.94, p < 0.001) and TST (r = 0.72, p < 0.001). Only 6.2% of the participants (N = 53) had an average TST ≥ 8 h; 64.5% slept 6 to < 8 h (N = 550); and 29.3% had an average < 6 h (N = 250). There were no differences in baseline age, SBP, DBP, race, or use of sleep medications between these common categories of TST. However, BMI, neck circumference, and waist circumference were the highest in the < 6 h TST group (p < 0.001 for all). Those in the < 6 h TST group had the lowest amount of %-sleep, the longest sleep latency, and the highest WASO (p < 0.001 for all).
Table 2.
Sleep variables of the study cohort: overall and by follow-up hypertension (HTN) status
Overall, 7.2% of the men had %-sleep < 70% (N = 61), 36.1% between 70% and < 85% (N = 308), and 56.7% ≥ 85% (N = 484). Lower %-sleep was associated with higher BMI, neck circumference, and waist circumferences (p < 0.001 for all). Those with < 70% sleep were most likely to be Caucasian (p = 0.013) and smokers (p = 0.030). Lower %-sleep was associated with shorter TST and greater sleep latency and WASO (p < 0.001 for all).
Of the entire sample, 29.1% had ≥ 30 min sleep latency (N = 248). Compared to those with < 30 min sleep latency, those with ≥ 30 min had higher BMI, neck circumference, and waist circumference (all p < 0.001). Smokers and prehypertensive men were also more likely to have sleep latency ≥ 30 min (p = 0.022 and p = 0.026, respectively). Similarly, those with ≥ 60 min of WASO (N = 452; 53.0%) had greater BMI (p = 0.004), and neck (p = 0.0053) and waist circumference (p = 0.0068) than those with < 30 (N = 96; 11.3%) or 30 to < 60 min (N = 305; 35.8%).
Similar trends were noted when evaluating TST, %-sleep, sleep latency, and WASO by quartile (data not shown).
Incident Hypertension and Actigraphic Sleep Variables
At a mean of 3.4 (0.46) years follow-up, 264 men (31%) had developed incident HTN. Those with incident HTN had a greater baseline BMI (26.9 versus 26.2, p = 0.019), and were more likely to report cardiovascular disease (26.7% versus 17.3%, p = 0.0016). However, as shown in Table 2, incident HTN was not associated with the primary predictor TST, nor with the other sleep variables %-sleep, sleep latency, or WASO. Logistic regression by clinically determined ranges, shown in Figure 1, or by quartiles (data not shown), was not associated with incident HTN when adjusted for age and non-Caucasian race. Additional models, which included covariates that were associated with the sleep characteristics and/ or incident HTN at a statistical level of p < 0.10, such as the Geriatric Depression Score, baseline blood pressures, BMI, education level, and history of cardiovascular disease failed to show any significant associations between these sleep variables and incident HTN.
Figure 1. Adjusted odds ratios of incident hypertension (HTN) in the actigraph measured sleep variables by clinical categories.
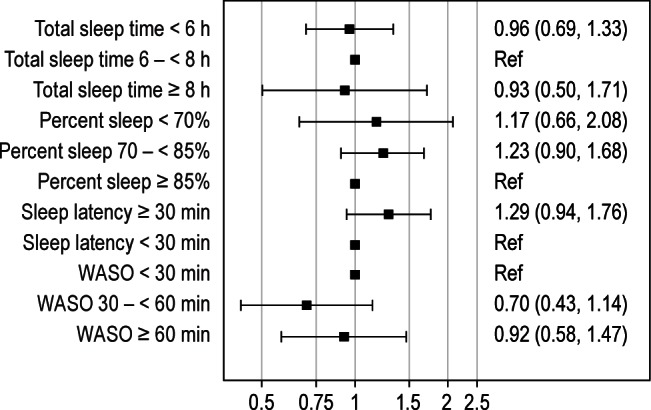
WASO, wake after sleep onset; Ref, reference. Reference range is based upon the clinical range considered ideal. Models are adjusted for age and non-Caucasian race (models are not significantly changed when additionally adjusting for body mass index, average diastolic blood pressure, geriatric depression score 15-point scale [GDS], education level, prehypertension status, waist circumference, and history of cardiovascular disease). Odds ratios are expressed as odds of incident HTN compared to the reference group.
DISCUSSION
In this study, we did not find any association between the acti-graphically defined measure of TST, nor the secondary predictors of poor quality sleep including % sleep, latency, or WASO with HTN in community-dwelling older men. To our knowledge, this is the first prospective study evaluating the association between sleep and blood pressure using objectively measured estimates of both sleep duration and quality together in older men.
Both cross-sectional and prospective studies have assessed the relationship between sleep and HTN, but in different populations and with varying study designs and measurements of sleep. Cross-sectional study results, looking over a number of age ranges, have revealed inconsistent results, The Sleep Heart Health Study (of participants aged 40-100 years, with mean 63.1 years) reported that sleep above or below the mean of 7-8 hours per night determined by polysomnography was cross-sectionally associated with an increased prevalence of HTN.23 However, the Rotterdam study (participants aged 58-98 years) failed to detect such an association,6 which was also confirmed in a subset of the participants who had actigraphy-validated sleep times. One study reported an association with HTN only in subjects < 65 years of age8; another used polysomnographic (PSG) data and noted that short sleep duration was associated with HTN only when accompanied with a sleep complaint of insomnia or poor quality.24 A small study of healthy adolescents found an association of actigraphy-measured sleep time and prehypertension.25
Prospective studies of younger subjects have generally shown more consistent associations between total sleep duration and incident HTN, whereas studies of older adults, particularly with male patients, more comparable to this one, generally have not reported such associations. The Coronary Artery Risk Development in Young Adults (CARDIA) Study, which included 41% African Americans,5 reported that actigraphic-measured sleep duration was associated with HTN 5 years later in participants aged 33-45 years, though the association was attenuated with covariate adjustment. In NHANES after 8-10 years of follow-up, self-reported sleep time was associated with incident HTN; however, subgroup analysis using age-defined strata showed no association with short sleep duration among individuals aged 60-85 years, although an association with long sleep (> 9 h duration) was observed.9 The 5-year prospective Whitehall II study reported that women with a self-reported sleep duration < 5 hours were most likely to have HTN,10 with some attenuation of the association after accounting for cardiovascular risk factors and psychiatric comorbidities10; no association was observed in men. Lastly, a Spanish study of older men (mean age 71.8 years), most similar to the cohort studied in this report, reported no relationship between prevalent or incident HTN and self-reported sleep duration.7
Differences between these previous studies and this current report may be partially explained by the prevalence of HTN in older men.26 In our cohort, 67.6% of those with valid actigraphy data were already hypertensive at baseline and excluded from this analysis of incident HTN. With many potential contributors to blood pressure, including molecular mechanisms which may be specific to older individuals such as telomeres shortening, progenitor cells, circulating microparticles, and epigenetic factors,27 sleep characteristics may only play a minor role in the development of HTN in older men.
The increased risk of HTN in short sleep duration may be at least partially attributable to neurohormonal changes, which may be more apparent in younger populations where stronger associations have previously been noted,5,8,9,25 and less so in older populations7 such as ours. Older individuals may have decreased production28 or desensitization to neurohormones. Also men, who tend to have less overall fat mass than women, may have lower production of neurohormones such as leptin which is produced in adipose tissue.28
Short TST, low % sleep, high sleep latency, and high WASO were all associated with higher BMI in this study. The relationship between total sleep duration and BMI in both cross-sectional studies,29–31 including this MrOS cohort of older men32 and in prospective studies,33 has been demonstrated repeatedly, such that short sleep duration (< 5 h) is associated with increased obesity. Studies have suggested that short sleep time may affect neurohormonal pathways, such as in leptin and ghrelin,34 leading to metabolic and endocrinologic changes that increase the risk of diabetes and obesity.35,36
Prior work using PSG in the MrOs sleep cohort has shown that decreased time spent in slow wave sleep (stage N3 sleep) was associated with incident HTN, but not total sleep duration.37 These findings suggest that time in specific neurophysiological states (such as those associated with different levels of sympathetic activity) may influence the development of future HTN. If it is confirmed that it is the time in such neurophysiological states that influences the development of future HTN, then actigraphy may not be sensitive enough to detect these changes, thus explaining the lack of the association between indices of sleep and wake duration seen in this study.
Few studies have evaluated sleep efficiency or latency or WASO as measures of sleep quality and fragmentation and their association with blood pressure; these studies have all been of cross-sectional design. While our study examined %-sleep rather than sleep efficiency (the ratio of time spent asleep [total sleep time] to the amount of time spent in bed), we would have expected the results to be similar. Reduced sleep efficiency has been associated with HTN23 and prehypertension25 prevalence as well as resistant HTN.38 Self-reported sleep latency has been associated with blood pressure and antihypertensive medication usage in postmenopausal women.39
Previous studies of TST have relied predominantly on self-reported sleep time and did not assess whether other measures of sleep quality or continuity were associated with HTN. Subjective reports have been shown to be moderately correlated with objective measures,40 though differences may exist for a number of reasons. In older individuals, particularly, misperceptions of sleep quality may occur associated with chronicity of problems.41 The strengths of this study include the use of an objective and validated tool for assessing sleep and characterizing sleep latency and fragmentation.20,42,43 Advantages of using the actigraph over PSG is that it can be used for longer periods of time and is averaged over a number of nights of sleep as opposed to only one night of the more disruptive and expensive PSG.
Limitations of this study include its potential limited generalizability to other groups, including women and non-Caucasian men. Participants in cohort studies tend to be healthier and more educated than the general population and only those who survived to the follow-up visit were included in the analysis. Also, by focusing on incident cases, it is possible that those men most susceptible to sleep-associated HTN were excluded with the exclusion of prevalent HTN cases. Only nighttime sleep, not including daytime napping, was considered in this analysis of TST. We evaluated sleep efficiency as the percent time sleeping rather than the more-often-used definition of percent time asleep in a given duration. We also did not employ 24-hour blood pressure monitoring to better define HTN and its diurnal patterns. Diagnosis of HTN in 24% of subjects with incident HTN was based on only one clinic visit, though was made using an average of two blood pressure measurements. Lastly, an additional limitation to this cohort study was the power. Our sample size allowed only 80% power to detect an OR > 1.2 (effect size of approximately 20% or greater) between TST and incident HTN.
In conclusion, this study demonstrated that short TST was cross-sectionally associated with higher BMI but was not associated with incident HTN in older men, despite known associations with cardiovascular disease and mortality. Similarly, the other sleep predictors of poor quality sleep including low %-sleep at night, long sleep latency, and high WASO showed consistent associations. Previously reported cross-sectional and prospective studies of sleep duration and HTN have shown inconsistent results, but upon close examination, studies of older men were less likely to demonstrate an association with either prevalent or incident HTN. This may be attributed to the high prevalence of HTN in older men and the many pathophysiologic contributors that may operate over many years to influence vascular tone and responses. Reduced sleep duration may have a larger effect on the development of HTN in younger individuals, before the development of arteriosclerosis or significant vascular remodeling.
DISCLOSURE STATEMENT
This was not an industry supported study. Dr. Fung has received funding from Forest Laboratories, and currently works and owns stock at Amgen. Dr. Ancoli-Israel has served as a consultant or serves on the scientific advisory board from Astra Zeneca, Ferring Pharmaceuticals, Inc., GlaxoSmithKline, Hypnocore, Johnson & Johnson, Merck, NeuroVigil, Inc., Pfizer, Philips, Purdue Pharma LP, and Sanofi-Aventis. Dr. Barrett-Connor has received grant support and/or consulting fees from the NIH, the NIA, and the NCRR, Merck, and Roche. Dr. Redline has received equipment from Philips-Respironics and ResMed Inc. and received a grant from ResMed Inc. The other authors have indicated no financial conflicts of interest.
ACKNOWLEDGMENTS
The authors thank Terri Blackwell and Peggy Cawthorn for their assistance in preparation of this manuscript. The Osteoporotic Fractures in Men Study is supported by National Institute of Arthritis and Musculoskeletal and Skin Diseases, National Institute on Aging, National Center for Research Resources, and National Institutes of Health Roadmap for Medical Research under the following grants: U01 AR45580, U01 AR45614, U01 AR45632, U01 AR45647, U01 AR45654, U01 AR45583, U01 AG18197, U01-AG027810, and UL1 RR024140. This work was also supported by the Veterans Affairs Healthcare System (to Dr. Fung) and AG08415 (to Dr. Ancoli-Israel). The authors had full access to all of the data in the study and take responsibility for the integrity of the data and the accuracy of the data analysis. The National Heart, Lung, and Blood Institute provides funding for the Osteoporotic Fractures in Men Study sleep ancillary study “Outcomes of Sleep Disorders in Older Men” under the following grants: R01 HL071194, R01 HL070848, R01HL070847, R01 HL070842, R01 HL070841, R01 HL070837, R01 HL070838, and R01 HL070839.
REFERENCES
- 1.Kripke DF, Langer RD, Elliott JA, Klauber MR, Rex KM. Mortality related to acti-graphic long and short sleep. Sleep Med. 2011;12:28–33. doi: 10.1016/j.sleep.2010.04.016. [DOI] [PMC free article] [PubMed] [Google Scholar]
- 2.Vgontzas AN, Liao D, Pejovic S, et al. Insomnia with short sleep duration and mortality: the Penn State cohort. Sleep. 2010;33:1159–64. doi: 10.1093/sleep/33.9.1159. [DOI] [PMC free article] [PubMed] [Google Scholar]
- 3.Mesas AE, Lopez-Garcia E, Leon-Munoz LM, Guallar-Castillon P, Rodriguez-Artalejo F. Sleep duration and mortality according to health status in older adults. J Am Geriatr Soc. 2010;58:1870–7. doi: 10.1111/j.1532-5415.2010.03071.x. [DOI] [PubMed] [Google Scholar]
- 4.Cappuccio FP, D'Elia L, Strazzullo P, Miller MA. Sleep duration and all-cause mortality: a systematic review and meta-analysis of prospective studies. Sleep. 2010;33:585–92. doi: 10.1093/sleep/33.5.585. [DOI] [PMC free article] [PubMed] [Google Scholar]
- 5.Knutson KL, Van Cauter E, Rathouz PJ, et al. Association between sleep and blood pressure in midlife: the CARDIA sleep study. Arch Intern Med. 2009;169:1055–61. doi: 10.1001/archinternmed.2009.119. [DOI] [PMC free article] [PubMed] [Google Scholar]
- 6.van den Berg JF, Tulen JH, Neven AK, et al. Sleep duration and hypertension are not associated in the elderly. Hypertension. 2007;50:585–9. doi: 10.1161/HYPERTENSIONAHA.107.092585. [DOI] [PubMed] [Google Scholar]
- 7.Lopez-Garcia E, Faubel R, Guallar-Castillon P, Leon-Munoz L, Banegas JR, Rodriguez-Artalejo F. Self-reported sleep duration and hypertension in older Spanish adults. J Am Geriatr Soc. 2009;57:663–8. doi: 10.1111/j.1532-5415.2009.02177.x. [DOI] [PubMed] [Google Scholar]
- 8.Kim J, Jo I. Age-dependent association between sleep duration and hypertension in the adult Korean population. Am J Hypertens. 2010;23:1286–91. doi: 10.1038/ajh.2010.166. [DOI] [PubMed] [Google Scholar]
- 9.Gangwisch JE, Heymsfield SB, Boden-Albala B, et al. Short sleep duration as a risk factor for hypertension: analyses of the first National Health and Nutrition Examination Survey. Hypertension. 2006;47:833–9. doi: 10.1161/01.HYP.0000217362.34748.e0. [DOI] [PubMed] [Google Scholar]
- 10.Cappuccio FP, Stranges S, Kandala NB, et al. Gender-specific associations of short sleep duration with prevalent and incident hypertension: the Whitehall II Study. Hypertension. 2007;50:693–700. doi: 10.1161/HYPERTENSIONAHA.107.095471. [DOI] [PMC free article] [PubMed] [Google Scholar]
- 11.Orwoll E, Blank JB, Barrett-Connor E, et al. Design and baseline characteristics of the osteoporotic fractures in men (MrOS) study--a large observational study of the determinants of fracture in older men. Contemp Clin Trials. 2005;26:569–85. doi: 10.1016/j.cct.2005.05.006. [DOI] [PubMed] [Google Scholar]
- 12.Blank JB, Cawthon PM, Carrion-Petersen ML, et al. Overview of recruitment for the osteoporotic fractures in men study (MrOS) Contemp Clin Trials. 2005;26:557–68. doi: 10.1016/j.cct.2005.05.005. [DOI] [PubMed] [Google Scholar]
- 13.Chobanian AV, Bakris GL, Black HR, et al. The Seventh Report of the Joint National Committee on Prevention, Detection, Evaluation, and Treatment of High Blood Pressure: the JNC 7 report. JAMA. 2003;289:2560–72. doi: 10.1001/jama.289.19.2560. [DOI] [PubMed] [Google Scholar]
- 14.Myers MG, Godwin M, Dawes M, et al. Conventional versus automated measurement of blood pressure in primary care patients with systolic hypertension: randomised parallel design controlled trial. BMJ. 2011;342:d286. doi: 10.1136/bmj.d286. [DOI] [PMC free article] [PubMed] [Google Scholar]
- 15.Washburn RA, Ficker JL. Physical Activity Scale for the Elderly (PASE): the relationship with activity measured by a portable accelerometer. J Sports Med Phys Fitness. 1999;39:336–40. [PubMed] [Google Scholar]
- 16.Almeida OP, Almeida SA. Short versions of the geriatric depression scale: a study of their validity for the diagnosis of a major depressive episode according to ICD-10 and DSM-IV. Int J Geriatr Psychiatry. 1999;14:858–65. doi: 10.1002/(sici)1099-1166(199910)14:10<858::aid-gps35>3.0.co;2-8. [DOI] [PubMed] [Google Scholar]
- 17.Pahor M, Chrischilles EA, Guralnik JM, Brown SL, Wallace RB, Carbonin P. Drug data coding and analysis in epidemiologic studies. Eur J Epidemiol. 1994;10:405–11. doi: 10.1007/BF01719664. [DOI] [PubMed] [Google Scholar]
- 18.Callaway CW, Chumlea WC, Bouchard C, et al. Circumferences. In: Lohman AF, Roche AF, Martorel R, editors. Anthropometric standardization reference manual. Champaign, Illinois: Human Kinetics; 1988. [Google Scholar]
- 19.Jean-Louis G, Kripke DF, Mason WJ, Elliott JA, Youngstedt SD. Sleep estimation from wrist movement quantified by different actigraphic modalities. J Neurosci Methods. 2001;105:185–91. doi: 10.1016/s0165-0270(00)00364-2. [DOI] [PubMed] [Google Scholar]
- 20.Ancoli-Israel S, Cole R, Alessi C, Chambers M, Moorcroft W, Pollak CP. The role of actigraphy in the study of sleep and circadian rhythms. Sleep. 2003;26:342–92. doi: 10.1093/sleep/26.3.342. [DOI] [PubMed] [Google Scholar]
- 21.Blackwell T, Ancoli-Israel S, Redline S, Stone KL. Factors that may influence the classification of sleep-wake by wrist actigraphy: the MrOS Sleep Study. J Clin Sleep Med. 2011;7:357–67. doi: 10.5664/JCSM.1190. [DOI] [PMC free article] [PubMed] [Google Scholar]
- 22.Blackwell T, Ancoli-Israel S, Gehrman PR, Schneider JL, Pedula KL, Stone KL. Actigraphy scoring reliability in the study of osteoporotic fractures. Sleep. 2005;28:1599–605. doi: 10.1093/sleep/28.12.1599. [DOI] [PubMed] [Google Scholar]
- 23.Gottlieb DJ, Redline S, Nieto FJ, et al. Association of usual sleep duration with hypertension: the Sleep Heart Health Study. Sleep. 2006;29:1009–14. doi: 10.1093/sleep/29.8.1009. [DOI] [PubMed] [Google Scholar]
- 24.Vgontzas AN, Liao D, Bixler EO, Chrousos GP, Vela-Bueno A. Insomnia with objective short sleep duration is associated with a high risk for hypertension. Sleep. 2009;32:491–7. doi: 10.1093/sleep/32.4.491. [DOI] [PMC free article] [PubMed] [Google Scholar]
- 25.Javaheri S, Storfer-Isser A, Rosen CL, Redline S. Sleep quality and elevated blood pressure in adolescents. Circulation. 2008;118:1034–40. doi: 10.1161/CIRCULATIONAHA.108.766410. [DOI] [PMC free article] [PubMed] [Google Scholar]
- 26.Cutler JA, Sorlie PD, Wolz M, Thom T, Fields LE, Roccella EJ. Trends in hyper-tension prevalence, awareness, treatment, and control rates in United States adults between 1988-1994 and 1999-2004. Hypertension. 2008;52:818–27. doi: 10.1161/HYPERTENSIONAHA.108.113357. [DOI] [PubMed] [Google Scholar]
- 27.Mateos-Caceres PJ, Zamorano-Leon JJ, Rodriguez-Sierra P, Macaya C, Lopez-Farre AJ. New and old mechanisms associated with hypertension in the elderly. Int J Hypertens. 2012;2012:150107. doi: 10.1155/2012/150107. [DOI] [PMC free article] [PubMed] [Google Scholar]
- 28.Wong SL, DePaoli AM, Lee JH, Mantzoros CS. Leptin hormonal kinetics in the fed state: effects of adiposity, age, and gender on endogenous leptin production and clearance rates. J Clin Endocrinol Metab. 2004;89:2672–7. doi: 10.1210/jc.2003-031931. [DOI] [PubMed] [Google Scholar]
- 29.Singh M, Drake CL, Roehrs T, Hudgel DW, Roth T. The association between obesity and short sleep duration: a population-based study. J Clin Sleep Med. 2005;1:357–63. [PubMed] [Google Scholar]
- 30.van den Berg JF, Knvistingh Neven A, Tulen JH, et al. Actigraphic sleep duration and fragmentation are related to obesity in the elderly: the Rotterdam Study. Int J Obes (Lond) 2008;32:1083–90. doi: 10.1038/ijo.2008.57. [DOI] [PubMed] [Google Scholar]
- 31.Buscemi D, Kumar A, Nugent R, Nugent K. Short sleep times predict obesity in internal medicine clinic patients. J Clin Sleep Med. 2007;3:681–8. [PMC free article] [PubMed] [Google Scholar]
- 32.Patel SR, Blackwell T, Redline S, et al. The association between sleep duration and obesity in older adults. Int J Obes (Lond) 2008;32:1825–34. doi: 10.1038/ijo.2008.198. [DOI] [PMC free article] [PubMed] [Google Scholar]
- 33.Watanabe M, Kikuchi H, Tanaka K, Takahashi M. Association of short sleep duration with weight gain and obesity at 1-year follow-up: a large-scale prospective study. Sleep. 2010;33:161–7. doi: 10.1093/sleep/33.2.161. [DOI] [PMC free article] [PubMed] [Google Scholar]
- 34.Spiegel K, Tasali E, Penev P, Van Cauter E. Brief communication: Sleep curtailment in healthy young men is associated with decreased leptin levels, elevated ghrelin levels, and increased hunger and appetite. Ann Intern Med. 2004;141:846–50. doi: 10.7326/0003-4819-141-11-200412070-00008. [DOI] [PubMed] [Google Scholar]
- 35.Morselli L, Leproult R, Balbo M, Spiegel K. Role of sleep duration in the regulation of glucose metabolism and appetite. Best Pract Res Clin Endocrinol Metab. 2010;24:687–702. doi: 10.1016/j.beem.2010.07.005. [DOI] [PMC free article] [PubMed] [Google Scholar]
- 36.Knutson KL, Van Cauter E. Associations between sleep loss and increased risk of obesity and diabetes. Ann N Y Acad Sci. 2008;1129:287–304. doi: 10.1196/annals.1417.033. [DOI] [PMC free article] [PubMed] [Google Scholar]
- 37.Fung MM, Peters K, Redline S, et al. Decreased slow wave sleep increases risk of developing hypertension in elderly men. Hypertension. 2011;58:596–603. doi: 10.1161/HYPERTENSIONAHA.111.174409. [DOI] [PMC free article] [PubMed] [Google Scholar]
- 38.Friedman O, Bradley TD, Ruttanaumpawan P, Logan AG. Independent association of drug-resistant hypertension to reduced sleep duration and efficiency. Am J Hypertens. 2010;23:174–9. doi: 10.1038/ajh.2009.220. [DOI] [PubMed] [Google Scholar]
- 39.Park DH, Kripke DF, Louis GJ, et al. Self-reported sleep latency in postmenopausal women. J Korean Med Sci. 2007;22:1007–14. doi: 10.3346/jkms.2007.22.6.1007. [DOI] [PMC free article] [PubMed] [Google Scholar]
- 40.O'Donnell D, Silva EJ, Munch M, Ronda JM, Wang W, Duffy JF. Comparison of subjective and objective assessments of sleep in healthy older subjects without sleep complaints. J Sleep Res. 2009;18:254–63. doi: 10.1111/j.1365-2869.2008.00719.x. [DOI] [PMC free article] [PubMed] [Google Scholar]
- 41.Vitiello MV, Larsen LH, Moe KE. Age-related sleep change: Gender and estrogen effects on the subjective-objective sleep quality relationships of healthy, noncomplaining older men and women. J Psychosom Res. 2004;56:503–10. doi: 10.1016/S0022-3999(04)00023-6. [DOI] [PubMed] [Google Scholar]
- 42.Sadeh A, Hauri PJ, Kripke DF, Lavie P. The role of actigraphy in the evaluation of sleep disorders. Sleep. 1995;18:288–302. doi: 10.1093/sleep/18.4.288. [DOI] [PubMed] [Google Scholar]
- 43.Lichstein KL, Stone KC, Donaldson J, et al. Actigraphy validation with insomnia. Sleep. 2006;29:232–9. [PubMed] [Google Scholar]