

Abstract
We report a label-free assay for simultaneous optical manipulation and tracking of endogenous lipid droplets as actively transported cargoes in a living mammalian cell with sub-millisecond time resolution. Using an EM-CCD camera as a highly sensitive quadrant detector, we can detect steps of dynein- and kinesin-driven cargoes under known force loads. We can distinguish single and multiple motor-driven cargoes and show that the stall forces for inward and outward transported cargoes are similar. By combining the stall force observable with the ability to detect individual steps, we can characterize kinesin- and dynein-driven active transport in different force regimes.
Keywords: optical tweezers, motor protein, particle tracking, organelle transport, mechanical manipulation
Introduction
Advances in single molecule techniques including fluorescence detection and mechanical manipulation have yielded considerable information about molecular motors[1-11]. Recent studies of active transport in living cells have revealed the stepping behaviour of molecular motors using high resolution particle tracking[1-3]. In vitro studies of kinesin and dynein have clearly demonstrated the benefits of particle tracking and optical tweezer-based force measurements[4-9]. However, the most compelling experiment would be the resolution of individual steps of dynein- and kinesin-driven cargoes with high temporal resolution and spatial precision under measurable force loads. Here, we demonstrate a technique for simultaneous optical manipulation and high speed tracking of endogenous lipid droplets (LDs) in a mammalian cell that allows many important questions about active transport to be addressed: Are the stall forces different for inward and outward transport? How many molecular motors are driving the motion of organelles? How do an applied force and the number of motors affect the stepping dynamics of organelle transport by molecular motors?
In this study, we combine optical trapping with high speed tracking to directly observe the stepping behaviour of actively transported LDs under known force loads in living human lung cancer cells (A549). The LDs are important organelles for energy storage and are composed of triacylglycerols enclosed by a phospholipid monolayer membrane to which a variety of cell signalling proteins are attached[12]. LDs have a high refractive index (~1.52) relative to the cytoplasm (~1.39) making them easily trapped with optical tweezers[10-11] and imaged with bright field microscopy. To trap LDs, we use a 1064 nm laser to minimize heating and photodamage, similar to previous experiments both in vitro[4,7,9] and in vivo[13]. In addition, we focus the laser light using a 1.2 NA, water-immersion objective that is optimized for infrared throughput and minimizes spherical aberrations.
Results and Discussion
Tracking and Trapping Endogenous Lipid Droplets
Although trapping of LDs has been shown before in non-mammalian systems[10-11], the amount of light they scatter is small relative to non-endogenous probes, such as gold nanoparticles, making them challenging to track. The step sizes are expected to be as small as 8 nm, and the particles translocate at high speeds due to the saturating endogenous ATP concentration. In order to achieve the spatial precision and high speed positional sampling necessary for detecting individual stepping events, we use an EM-CCD (electron multiplication charge-coupled device) camera instead of a conventional quadrant photodiode. The EM-CCD has a high frame rate and a quantum efficiency of >90% for visible wavelengths. By measuring the relative integrated intensities of four split areas on the EM-CCD, we can calculate the position of the LD with better sensitivity than with conventional quadrant diodes. In doing so, we achieved ~7 kHz positional sampling and nanometer spatial precision for an LD. We use home-written software to simultaneously stream data from the quadrant CCD while controlling a piezo stage which provides positional feedback to keep a particle in the small field of view of the quadrant CCD when the optical trap is off. When the trap is on, the harmonic potential prevents the particle from escaping the detector. There are many advantages to operating the EM-CCD as a quadrant detector. The hardware binning feature of the camera allows one to adjust the field-of-view of the EM-CCD chip depending on the size of the particle being tracked. In addition, the quadrant detector can be placed at any location in the field of view of the EM-CCD chip. These features make the quadrant CCD an ideal detector for high speed tracking of endogenous particles in living cells.
In order to accurately measure force and displacement, it is important to calibrate the response of the quadrant CCD by simultaneous video tracking with a second camera. Calibration of the optical trap’s harmonic potential in the cellular environment is complicated by cytoskeletal and motor dynamics that result in drift and by the non-Newtonian nature of the cytoplasm which results in non-exponential relaxation behaviour[13]. We measure the spring constant of the optical trap by extracting individual LDs of different sizes from a permeablized cell with the trap and bringing them into a sucrose solution that index-matches the cytoplasm and exhibits Newtonian hydrodynamic behaviour. This allows one to apply conventional equipartition- or frequency domain-based calibration methods[4]. In addition, we used two common drug assays to show that LD active transport is microtubule-mediated and that actin-based active transport is not interfering with our observations (see Supplementary Materials).
Stall Forces for Dynein- and Kinesin-Driven Lipid Droplets
For small excursions, the force exerted on an LD is linear in the distance travelled from the trap center. Once the spring constant of the optical trap is calibrated, the force exerted on an LD can be calculated from its position trajectory. We obtained hundreds of movies using the EM-CCD camera with relatively low sampling rates (100-2000 Hz) which depict the active transport of LDs against the applied force of the optical trap. In a typical experiment, an LD is found in the field-of-view, captured with the trap, and tracked in real-time. The LDs have molecular motors on their membrane surfaces which bind to and dissociate from microtubules[10-11]. Upon binding, the motors transport the LD against the restoring force of the trap which eventually stalls the motors. Fig. 2A shows such a real-time trajectory in which a trapped LD starts running along a microtubule, is eventually stalled by the restoring force of the trap at 6-8 pN (near the single kinesin stall force of 6-7 pN) [4], and remains at the same position until it dissociates from the microtubule causing a rapid return to the trap center due to the trap’s restoring force. Multiple runs are observed when the same cargo re-binds to the microtubule, as is often observed in vitro[4,6,7,9]. This process is depicted for an LD in a living cell in our Supplemental Movie. The LD, whose trajectory is shown in Fig. 2A, travels outward towards the cell membrane and is likely carried by kinesin. We see similar behaviour for cargoes transported inward. Fig. 2B shows a trajectory for such a cargo which is likely carried by dynein. Interestingly, the stall forces in the first two runs (~4 pN) are distinctly different from that of the third (~8.5 pN) possibly due to differences in the number of motors involved in the runs, as suggested in previous in vitro[14-15] and in vivo[10-11] studies.
Figure 2.

(A)-(B) Stall force trajectories showing multiple, outward- (A) and inward- (B) directed events in the harmonic potentials of the trap depicted to the left. (C)-(D) Histogram of stall forces for outward- (C) and inward- (D) directed stalling events, likely dominated by kinesin- and dynein-driven active transport, respectively. (C) and (D) indicate that the stall forces are similar in both directions.
The distributions of stall forces for the inward and outward directions shown in Figs. 2C-D immediately reveal that very similar forces are exerted in inward- and outward-directed active transport. On average, outward-directed stall forces are ~8 pN while inward-directed stall forces are ~7 pN. The histogram of outward-directed stalls (Fig. 2C) shows a broad peak at ~6 pN and a side peak at ~3 pN. The amplitude of these forces is quite similar to what has been reported for studies of single kinesin motors in vitro (6-7 pN)[4]. There is an additional peak in the high force regime at ~16 pN indicating a population of cargoes transported by more than two kinesin motors. The histogram of inward-directed stalls (Fig. 2D) involves more clearly separated populations than in the case of outward-directed transport. A similarly multi-modal stall force distribution has been reported for multiple dynein-driven active transport in vitro, and the peaks have been shown to represent active transport by different number of motors[14]. In our case, the two major peaks for inward-directed transport are centered at ~4 and ~9 pN. Interpretation of our in vivo, stall force measurements for dynein is somewhat complicated by the controversy surrounding stall force experiments on dynein in vitro. Two of the three reports on dynein’s in vitro stall force claim that single dynein dimers stall at ~7 pN[7,9], whereas the earliest report claims a stall force of ~1 pN[6]. This discrepancy adds further significance to our observation that kinesin- and dynein-driven active transport occur with very similar forces in our system, as some in vitro measurements would imply a >6-fold difference in force generation by the two motors. Because we rarely observe inward-directed stalls below 2 pN and because previous studies suggest that most cargoes are attached to a small number of motors (~1-5 typically)[15], we attribute the most prominent peak in our stall force histogram to the mean force exerted by single dynein-driven cargoes in our mammalian cells (~3-5 pN). Recent experiments on lipid droplet transport in Drosophila embryos report stall forces in a similar range[11].
The measurement error associated with a given stall force measurement is ~1-2 pN given the scatter in our calibration (see Experimental Section) making our experiments in living cells considerably less accurate than in vitro measurements. However, this level of accuracy is more than enough to show the similarities between the inward- and outward-directed stall force distributions and to identify motor-cargo assemblies which are capable of higher force generation than what is possible for single motor-driven cargoes.
We also note that stall force measurements in the complex cellular environment likely represent an underestimate of the true capability of a given motor, because there are other factors that can cause a motor to stop or dissociate from either a cargo or a microtubule along with possible structural differences[11]. Co-factors associated with both the motor-cargo linkage (such as dynactin in the case of dynein) and microtubules (such as tau) can affect both stall forces and processivity in vivo[16]. Subtle differences in co-factor expression and biochemistry could explain discrepancies between in vitro and in vivo stall forces and among experiments in various cellular systems[10,11].
Stepping Behavior of Dynein- and Kinsin-Driven Lipid Droplets Under Known Force Loads
There have been multiple reports of step detection for microtubule-mediated active transport in living cells in the absence of an applied force[1-3]. In this study, we optically trap kinesin- and dynein-driven LDs and detect individual steps with nanometer spatial precision and 7 kHz positional sampling while simultaneously measuring the piconewton forces exerted by the motors. Figs. 3A and B show stepping trajectories with different stall forces while Fig. 3D shows a step size histogram with a peak at 8 nm. While some trajectories exclusively display steps that are <12 nm in magnitude (Fig. 3A), we observe variable step sizes in others (Fig. 3B). Our ability to resolve individual steps of LDs is clearly demonstrated by the pairwise distance histogram displayed in Fig. 3C which we calculated from a segment of the trajectory in Fig. 3A. We note that the step sizes displayed in the trajectories are not corrected for the stiffness of the motor-cargo linkage, which we expect to be a small effect in this case because our optical spring constant is relatively small (<0.05 pN/nm) compared with the overall stiffness of the system which must be at least ~0.4 pN/nm for steps to be visible[4]. Additional stepping trajectories and pairwise histograms appear in the Supplementary Materials. The observation of large (>12 nm) steps is consistent with our recent study in which we tracked gold nanoparticle-containing vesicles in the same cell line with an even higher positional sampling rate, but without an external force load[3]. Furthermore, our observation is consistent with the step sizes taken by single kinesin[4] and dynein[6-9] dimers in vitro.
Figure 3.

(A) Representative outward-directed trajectory showing individual steps under load. Steps of <12 nm in magnitude dominate this trace, and the cargo stalls at 3.9 pN. (B) Representative inward-directed trajectory showing steps with a variety of sizes from 8-32 nm. In this case, the cargo stalls at 3.6 pN. Note that the displacement showin in (A) and (B) is not necessarily relative to the trap center since the trajectories are broken into linear segments before step size analysis. To make the steps (blue) more clear, we median filter (black) the raw data (grey). (C) Pairwise distance histogram for a portion of the median filtered trajectory in (A) after low pass filtering. (D) Step size histogram for all high resolution trajectories in this study.
We can take advantage of our ability to study the stepping dynamics of kinesin and dynein under known force loads to further characterize microtubule-mediated active transport in living cells. The stepping behaviour in the inward and outward directions is of particular interest for cargoes that exhibit relatively low stall forces (<4 pN) because they are likely dominated by single motor-driven transport for both kinesin and dynein. In our previous work, we studied the stepping behaviour of organelle transport in the same system without an applied force and were unable to distinguish trajectories involving high force generation by many motors from low force events[3]. Fig. 4 shows the step size histograms for outward- and inward-directed movements resulting in stall forces below 4 pN. The step size distribution in the outward direction (Fig. 4A) is relatively narrow with a peak at 8 nm as expected for transport by single kinesins. The detection of steps for outward-directed transport involving very high stall forces is qualitatively more challenging. This may be related to the observations of Leduc et al.[17] who reported fractional (~4 nm) steps for multiple-kinesin driven transport, which are difficult resolve consistently in our system.
Figure 4.

(A)-(B) Step size historams for outward- (A) and inward- (B) directed resulting in low stall forces (<4 pN). For both kinesin (outward) and dynein (inward), these histograms are likely dominated by single motor-driven active transport. While the distribution in (A) has a peak at ~8 nm, (B) has a broader distribution, which is consistent with the larger steps of dynein.
Interestingly, Fig. 4B shows a broad distribution of step sizes for inward-directed active transport even for cargoes with very low stall forces. Although variable step sizes have been reported previously for dynein-driven transport both in vitro and in vivo, we can associate the larger steps with low force generation that is characteristic of single motor-driven transport. In our previous work, we showed that dynein-driven cargoes can take 12, 16, 20, 24, 28, and 32 nm steps in addition to 8 nm steps[3]. The prevalence of large steps in low force, inward-directed trajectories implies that this variable stepping mode is fundamental to dynein-driven active transport by individual motors in the complete in vivo system. This result is also implied less directly by the combination of our previously reported step size histograms for dynein-driven transport in vivo[3] and our new stall force histograms, which suggest that transport by one or a few motors is prevalent.
Conclusion
Understanding active transport in living cells is a tremendous challenge that requires the combination of multiple techniques and observables. We have combined optical manipulation with high precision, high speed positional sampling by a conventional EM-CCD camera operated as a quadrant CCD. Furthermore, because we track endogenous LDs, our assay is label-free and requires minimal sample preparation beyond normal cell culture. This technical advance allows us to assess the effects of force load on the stepping behaviour of microtubule motors. In addition, simultaneous step detection and force measurements will be critical to our understanding of multiple motor-based active transport because it will allow the identification of cargoes that are driven by multiple motors based on their stall force. The ability to combine force measurements with high resolution tracking in living cells, particularly on an otherwise unperturbed system, will no doubt yield new information about the workings of molecular motors in vivo.
Experimental Section
All experiments were carried out with adherent, A549 human lung cancer cells (American Type Cell Culture, ATCC) which were cultured in Dulbecco’s Modified Eagle’s Medium (DMEM, ATCC) with 10% fetal bovine serum (FBS, Sigma) and 1% penicillin/streptomycin under humidified CO2 at 37°C. About 24 hours before an experiment, cells were split onto Delta-T dishes (Bioptechs) which have a coated, glass bottom for use with the Delta-T temperature controller (Biotechs). About 30 minutes before an experiment, the phenol red-containing medium was replaced with a HEPES-buffered, phenol red-free medium (ATCC). The cell sample was then used without further modification.
Optical trapping was carried out on an inverted microscope (Nikon TE-300) modified for mechanical stability with an Olympus UplanApo/IR 60x/1.2 NA water-immersion objective (Fig. 1). Infrared laser light (1064 nm) with a TEM00 beam mode from a passively cooled, diode-pumped solid-state laser (CrystaLaser, IRCL-1064-1W) was expanded to overfill the back aperture of the objective, forming a diffraction-limited focus at the sample. Experiments were typically carried out with 80-150 mW of power at the focus for durations of 5-10 seconds. This is significantly less power than has been used in previous experiments and is unlikely to cause a temperature increase of more than 2-3°C[13,19,20].
Figure 1.
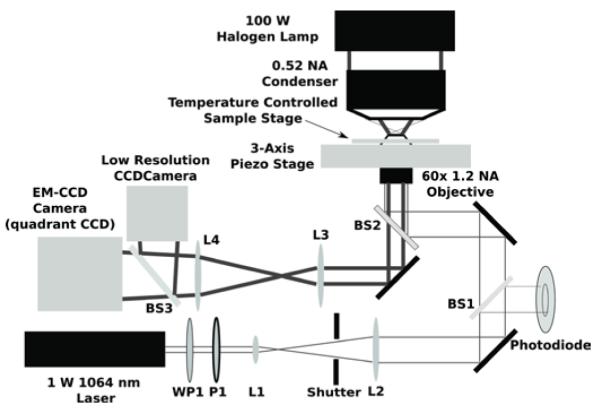
Optical setup including the optical trapping beam path and the bright field imaging. A half waveplate (WP1) and a polarizer (P1) form an attenuator for a 1 Watt, diode-pumped solid-state 1064 nm continuous-wave laser. Lenses L1 and L2 form a beam expander. A beamsplitter (BS1) provides a small amount of the beam to monitor the laser power. A dichroic mirror (BS2) directs the columnated beam into a 60x/1.2 NA water-immersion objective to form the optical trap in the sample. A tube lens (L3) forms an image on the EM-CCD (which can be used as either a high-speed camera or a quadrant detector).
For experiments that did not require high time resolution and single step detection, such as the stall force measurements, actively transported LDs were tracked using a back-illuminated, intensified EM-CCD camera (Cascade 128+, Roper Scientific) at a frame rate of 0.1-2 kHz. Using two-dimensional Gaussian fitting, we could determine the centroid position of LDs from high-contrast, bright field images with nanometer spatial precision[21,22].
To achieve high time resolution, we operated the Cascade 128+ as a quadrant CCD detector with home-made software (C/C++). Our software uses the PVCAM driver (Roper Scientific) to read out four pixels arranged in a square, at any location in the field-of-view. The bright field image of an LD could be projected onto the frame transfer quadrant CCD which could achieve ~7 kHz positional sampling with a linear range of +/−150 nm and a spatial precision of 1.3-1.5 nm (RMS noise) for a fixed particle or a particle that was artificially stepped (see Supplementary Materials). Because the displacement readout of the quadrant CCD is in arbitrary units with a relationship to absolute displacement in nanometers that varies from droplet-to-droplet, we used conventional video tracking with a second CCD camera (Mintron) and framegrabber card (DT3152, Data Translation) to measure large displacements and calibrate the quadrant CCD for each trajectory. Data streaming from the framegrabber was also accomplished using home-written software (Matlab). The second CCD serves the dual purpose of providing a movie containing most of the cell for each trajectory so that directionality can be determined relative to the cell membrane and nucleus.
The optical trap was configured such that most LDs could not escape the linear range of the quadrant CCD during an event. However, in many experiments, the LDs were allowed to move a considerable distance prior to being trapped. In these cases, our software would compute the particle position in real-time while running a feedback loop to move a piezo stage (P-517.3Cl, Physik Instrumente) in response to particle displacements at 20-50 Hz, keeping the particle within the linear range of the quadrant CCD. This software-based, positional feedback loop uses both the NI- DAQmx driver (National Instruements) and a NI-DAQ PCI card (PCI-6052E, National Instruments) to output voltages to the piezo stage controller (E-509.C3, Physik Instrumente). This is similar to the approach taken by Nan et al. to acquire long trajectories of actively transported gold nanopoarticles in vivo with a quadrant photodiode[3]. A second NI-DAQ PCI card (PCI-6143, National Instruments) on a separate computer simultaneously reads the stage position from the piezo controller and a pulse train from the Cascade 128+ that indicates exposure with 80 kHz sampling so that the piezo stage movements can be subtracted from displacement trajectories following an experiment. The stage position and camera pulse train sampling are managed by a Labview program (National Instruments).
We developed a convenient protocol for calibrating our harmonic, optical potential using LDs outside of the cell. Following the collection of each data set, the culture medium was replaced with an aqueous sucrose solution that matches the refractive index of the cytoplasm[10]. The solution also contains ~0.1% Triton X-100 which weakens the cell membrane following a five minute incubation. After washing the culture in sucrose solution, individual LDs can be extracted from the cells using the optical trap and brought into the Newtonian, index-matching sucrose solution. Outside of the cytoplasm, conventional frequency domain or equipartition-based calibration methods can be applied. Trajectories of LD diffusion in the optical potential are acquired using the quadrant CCD. We calibrated the quadrant CCD displacement by simultaneous video tracking while a large-amplitude, low frequency position modulation was applied to the trapped particle using the piezo stage. Although the actual experiment takes place in the cytoplasm of adherent cells, there can be a very thin layer of culture medium underneath the cell membrane. We expect any index-mismatch from the medium to be a relatively small effect[10], particularly because we employ a water-immersion objective.
Because the optical trap is not necessarily calibrated using the LDs that were tracked in the actual experiment, we take advantage of the strong correlation between the bright field contrast and the spring constant of the harmonic trapping potential to calculate spring constants for actively transported LDs. Within the size range of droplets used in this study (~300-1000 nm), the measured spring constant is quite linear in the bright field contrast (Fig. 5).
Figure 5.

Representative scatter plot from an LD optical trap calibration experiment. Within the size range of LDs used in this experiment, the spring constant of the optical trap is quite linear in the bright field contrast of the LD image. This relationship is used to calculate the optical trap spring constant for the LDs that are trapped in the cytoplasm.
All data analysis was carried out using home-written code. We employed two types of particle tracking in this study. For the video tracking-based quadrant CCD calibration, we used image correlation tracking[5]. However, for the stall force trajectories obtained with low time resolution on the EM-CCD, we fit a two- dimensional Gaussian to each bright field image[21,22]. Active transport and stepping trajectories were analyzed using the methods described in our previous studies[2-3] with a few changes. Instead of using a forward-backward nonlinear filter, median filtering was applied to the stepping traces
Supplementary Material
Acknowledgements
This work is supported by an NIH Director’s Pioneer Award to X.S.X. P.A.S. was supported by an NSF graduate research fellowship. We thank Prof. David Weitz and Dr. Peter Lu for lending us an infrared laser along with Dr. Xiaolin Nan, Brian Saar, Gene-Wei Li, and Dr. William Greenleaf for technical assistance and helpful discussions.
Footnotes
Supporting information for this article is available on the WWW under http://www.chemphyschem.org or from the author
References
- [1].Kural C, Kim H, Syed S, Goshima G, Gelfand VI, Selvin PR. Science. 2005;308:1469–1472. doi: 10.1126/science.1108408. [DOI] [PubMed] [Google Scholar]
- [2].Nan XL, Sims PA, Xie XS. J. Phys. Chem. B. 2005;109:24220–24224. doi: 10.1021/jp056360w. [DOI] [PubMed] [Google Scholar]
- [3].Nan XL, Sims PA, Xie XS. ChemPhysChem. 2008;9:707–712. doi: 10.1002/cphc.200700839. [DOI] [PubMed] [Google Scholar]
- [4].Svoboda K, Schmidt CF, Schnapp BJ, Block SM. Nature. 1993;365:721–727. doi: 10.1038/365721a0. [DOI] [PubMed] [Google Scholar]
- [5].Gelles J, Schnapp BJ, Sheetz MP. Nature. 1988;331:450–453. doi: 10.1038/331450a0. [DOI] [PubMed] [Google Scholar]
- [6].Mallik R, Carter BC, Lex SA, King SJ, Gross SP. Nature. 2004;427:649–652. doi: 10.1038/nature02293. [DOI] [PubMed] [Google Scholar]
- [7].Toba S, Watanabe TM, Yamaguchi-Okimoto L, Toyoshima YY, Higuchi H. Proc. Natl. Acad. Sci. USA. 2006;103:5741–5745. doi: 10.1073/pnas.0508511103. [DOI] [PMC free article] [PubMed] [Google Scholar]
- [8].Reck-Peterson SL, Yildiz A, Carter AP, Gennerich A, Zhang N, Vale RD. Cell. 2006;126:335–348. doi: 10.1016/j.cell.2006.05.046. [DOI] [PMC free article] [PubMed] [Google Scholar]
- [9].Gennerich A, Carter AP, Reck-Peterson SL, Vale RD. Cell. 2007;131:952–965. doi: 10.1016/j.cell.2007.10.016. [DOI] [PMC free article] [PubMed] [Google Scholar]
- [10].Welte MA, Gross SP, Postner M, Block SM, Wieschaus EF. Cell. 1998;92:547–557. doi: 10.1016/s0092-8674(00)80947-2. [DOI] [PubMed] [Google Scholar]
- [11].Shubeta GT, Tran SL, Xu J, Vershinin M, Cermelli S, Cotton SL, Welte MA, Gross SP. Cell. 2008;135:1098–1107. doi: 10.1016/j.cell.2008.10.021. [DOI] [PMC free article] [PubMed] [Google Scholar]
- [12].Murphy DJ. Prog. Lipid Res. 2001;40:325–438. doi: 10.1016/s0163-7827(01)00013-3. [DOI] [PubMed] [Google Scholar]
- [13].Gross SP. Methods Enzymol. 2003;361:162–174. doi: 10.1016/s0076-6879(03)61010-4. [DOI] [PubMed] [Google Scholar]
- [14].Mallik R, Petrov D, Lex SA, King SJ, Gross SP. Curr. Biol. 2005;15:2075–2085. doi: 10.1016/j.cub.2005.10.039. [DOI] [PubMed] [Google Scholar]
- [15].Vershinin M, Carter BC, Razafsky DS, King SJ, Gross SP. Proc. Natl. Acad. Sci. USA. 2007;104:87–92. doi: 10.1073/pnas.0607919104. [DOI] [PMC free article] [PubMed] [Google Scholar]
- [16].Dixit R, Ross JL, Goldman YE, Holzbaur ELF. Science. 2008;319:1086–1089. doi: 10.1126/science.1152993. [DOI] [PMC free article] [PubMed] [Google Scholar]
- [17].Leduc C, Ruhnow F, Howard J, Diez S. Proc. Natl. Acad. Sci. USA. 2007;104:10847–10852. doi: 10.1073/pnas.0701864104. [DOI] [PMC free article] [PubMed] [Google Scholar]
- [18].Gross SP, Vershinin M, Shubeita GT. Curr. Biol. 2007;17:478–486. doi: 10.1016/j.cub.2007.04.025. [DOI] [PubMed] [Google Scholar]
- [19].Ashkin A, Schutze K, Dziedzic JM, Eutenever V, Schliwa M. Nature. 1990;348:346–348. doi: 10.1038/348346a0. [DOI] [PubMed] [Google Scholar]
- [20].Ashkin A, Dziedzic JM. Nature. 1989;86:7914–7918. doi: 10.1073/pnas.86.20.7914. [DOI] [PMC free article] [PubMed] [Google Scholar]
- [21].Thompson RE, Larson DR, Webb WW. Biophys. J. 2002;82:2775–2783. doi: 10.1016/S0006-3495(02)75618-X. [DOI] [PMC free article] [PubMed] [Google Scholar]
- [22].Kural C, Kim H, Syed S, Goshima G, Gelfand VI, Selvin PR. Proc. Natl. Acad. Sci. USA. 2007;104:5378–5382. doi: 10.1073/pnas.0700145104. [DOI] [PMC free article] [PubMed] [Google Scholar]
Associated Data
This section collects any data citations, data availability statements, or supplementary materials included in this article.