

The expression of defined phenotypic profiles reported as cancer stem cell (CSC)-specific in human primary colorectal cancer (CRC) was analyzed in established CRC cell lines, and their correlation with CSC properties was evaluated. It was found that the expression of CD133 or the coexpression of CD166/CD44 or CD24/CD44 did not appear to reliably identify CSC populations in established CRC cell lines. These findings question the suitability of cell lines for the screening of CSC-specific therapies and underline the urgency of developing novel platforms for anticancer drug discovery.
Keywords: Cancer, Cell surface markers, Chemotherapy, Cancer stem cells, Colorectal cancer, Cancer cell lines
Abstract
Increasing evidence that cancers originate from small populations of so-called cancer stem cells (CSCs), capable of surviving conventional chemotherapies and regenerating the original tumor, urges the development of novel CSC-targeted treatments. Screening of new anticancer compounds is conventionally conducted on established tumor cell lines, providing sufficient material for high-throughput studies. Whether tumor cell lines might comprise CSC populations resembling those of primary tumors, however, remains highly debated. We have analyzed the expression of defined phenotypic profiles, including CD133+, CD166+CD44+, and CD24+CD44+, reported as CSC-specific in human primary colorectal cancer (CRC), on a panel of 10 established CRC cell lines and evaluated their correlation with CSC properties. None of the putative CSC phenotypes consistently correlated with stem cell-like features, including spheroid formation ability, clonogenicity, aldehyde dehydrogenase-1 activity, and side population phenotype. Importantly, CRC cells expressing putative CSC markers did not exhibit increased survival when treated with chemotherapeutic drugs in vitro or display higher tumorigenicity in vivo. Thus, the expression of CD133 or the coexpression of CD166/CD44 or CD24/CD44 did not appear to reliably identify CSC populations in established CRC cell lines. Our findings question the suitability of cell lines for the screening of CSC-specific therapies and underline the urgency of developing novel platforms for anticancer drug discovery.
Introduction
The cancer stem cell model proposes that, similar to normal tissues, cancers are also hierarchically organized. Only rare tumor cells, endowed with self-renewal and differentiation capacity, called cancer initiating cells or cancer stem cells (CSCs), are capable of tumor initiation and maintenance. In contrast, the majority of cells constituting the tumor bulk do not possess the capacity for regeneration [1, 2].
Putative CSC populations have been identified in several solid malignancies based on the expression of specific surface markers together with functional stem cell-like features, including high clonogenicity, differentiation capacity, spheroid formation, expression of stemness-related genes, and, critically, the ability to reproduce the original tumor upon transplantation in immunodeficient mice [3–5]. In human colorectal cancer (CRC), in particular, CSC populations have been identified in primary tumors either by CD133 expression [6, 7] or by coexpression of CD166/CD44 [8]. Furthermore, coexpression of CD44 and CD24 has been proposed as an additional CSC phenotype in established CRC cell lines [9].
The existence of CSCs has important implications for anticancer therapy. Indeed, in order to successfully eradicate tumors, anticancer treatments should primarily target CSC subsets [2, 4, 10]. Notably, similar to normal stem cells, CSCs have been found to express high levels of DNA repair mechanisms [11, 12]; detoxifying enzymes, such as aldehyde dehydrogenase-1 (ALDH-1) [13]; and molecular pumps [14–16], accounting for their resistance to radio- and chemotherapies. The development of novel, more effective treatments would therefore be desirable.
Primary screening of novel anticancer compounds is conventionally conducted on monolayers of established tumor cell lines, typically on the National Cancer Institute 60 (NCI60) panel, a collection of 60 tumor cell lines representing nine distinct human tumor types [17]. Established cell lines are easy to propagate in vitro, thus providing sufficient material for extensive molecular and signaling characterization, as well as for high-throughput studies [18]. However, whether they do actually comprise CSC populations resembling those of primary tumors remains unclear. A hierarchical organization, based on the expression of CSC markers reported in primary tumors, has been observed in established cell lines of several tumor types, including breast cancer [19, 20], glioblastoma [21], pancreatic cancer [22], and CRC [9, 23]. On the other hand, established cell lines have been recognized to only partially reproduce phenotypes and gene expression profiles of the tumors they are derived from [24, 25]. Whether putative CSC populations derived from tumor cell lines may serve as a model for CSCs of primary tumors therefore remains to be assessed. Importantly, the use of cell line-derived CSCs for the screening of anticancer compounds specifically targeting CSC populations has recently been proposed [26]. The sensitivity of cell line-derived CSCs to current or novel chemotherapies, however, has not been thoroughly investigated so far.
We have analyzed the expression of putative CRC-derived CSC phenotypic profiles, including CD133+, CD166+CD44+, and CD24+CD44+, in a panel of 10 human established CRC cell lines and evaluated their correlation with several CSC functional properties, including spheroid formation ability, clonogenicity, ALDH-1 activity, side population (SP) phenotype, tumorigenicity, and sensitivity to anticancer compounds currently in use for CRC treatment.
Materials and Methods
Cell Lines and Culture Reagents
Authenticated human established CRC cell lines (CACO2, COLO201, COLO205, DLD1, HCT15, HCT116, HT29, LS180, SW480, and SW620) were purchased from American Type Culture Collection (Manassas, VA, http://www.atcc.org). After one to two passages, cells were frozen and stored in aliquots. When needed for experiments, early-passage cells were thawed and maintained in culture for less than 2 months. COLO201, COLO205, DLD1, LS180, HCT15, and HCT116 were maintained in RPMI-1640 medium supplemented with 10% fetal bovine serum (FBS), GlutaMAX-I, nonessential amino acids (NEAA), 100 mM sodium pyruvate, 10 mM HEPES (all from Gibco, Grand Island, NY, http://www.invitrogen.com), and 50 μM 2-mercaptoethanol (Sigma-Aldrich, St. Louis, MO, http://www.sigmaaldrich.com). HT29 was maintained in McCoy's 5A medium (Sigma-Aldrich) supplemented with 10% FBS and GlutaMAX-I. CACO2 was cultured in Minimum Essential Medium (Sigma-Aldrich) supplemented with 10% FBS, GlutaMAX-I, NEAA, and sodium pyruvate. SW480 and SW620 were cultured in L-15 medium (Leibovitz) (Sigma-Aldrich) with 10% FBS and GlutaMAX-I. All media were also supplemented with kanamycin sulfate (Gibco). For specific experiments cell lines were cultured in serum-free (SF) medium for CSC derived from human primary CRCs, as previously described [6, 27]. Cells were cultured at 37°C with 5% CO2. All cultures were tested by polymerase chain reaction and proven to be mycoplasma-free prior to experimental investigations.
Flow Cytometric Analysis and Cell Sorting
The surface phenotype of cultured cells was determined by flow cytometry. Tumor cells were harvested upon incubation with TrypLE Express (Gibco). The following antibodies were used: phycoerythrin (PE)- or allophycocyanin (APC)-labeled anti-CD133 (clone AC133/1; Miltenyi Biotec, Bergisch Gladbach, Germany, http://www.miltenyibiotec.com); PE-labeled anti-CD166 (clone 3A6; BD Biosciences, San Diego, CA, http://www.bdbiosciences.com); fluorescein isothiocyanate (FITC)-, APC-, or APC-H7-labeled anti-CD44 (clone G44–26; BD Biosciences); and FITC- or PE-labeled anti-CD24 (clone ML5, BD Biosciences). Propidium iodide (PI) (0.5 μg/ml) was added to the samples prior to analysis. Relative fluorescence intensities were measured using a BD FACSCalibur flow cytometer (BD Biosciences) or a CyAn ADP analyzer (Beckman Coulter, Fullerton, CA, http://www.beckmancoulter.com) following exclusion of dead cells on the basis of PI incorporation. Cell sorting was performed using a BD Influx cell sorter (BD Biosciences). Analysis was performed using FlowJo software (Tree Star, Ashland, OR, http://www.treestar.com).
Spheroid Formation Assay
Multicellular tumor spheroids were generated as previously described [28]. Briefly, single-cell suspensions were seeded in six-well culture plates (1,000 cells per well in 2 ml), precoated with a 50 μg/ml poly-2-hydroxyethyl methacrylate (polyHEMA) solution (Sigma-Aldrich). Spheroid formation was assessed by light microscopy after 4–7 days of culture.
Limiting Dilution Analysis
Titrated numbers (from 300 cells per well to 1 cell per well) of unsorted tumor cells or sorted cell subsets were seeded in 96-well flat-bottomed plates and cultured for 10 days. Colony formation was then assessed by light microscopy. Clonal frequencies and statistical significance were evaluated by extreme limiting dilution analysis (ELDA) [29].
Evaluation of ALDH-1 Activity
ALDH-1 activity was assessed by staining with the Aldefluor reagent system (StemCell Technologies, Vancouver, BC, Canada, http://www.stemcell.com) according to the manufacturer's specifications. Briefly, cells were incubated in Aldefluor assay buffer containing ALDH substrate (BODIPY [Invitrogen, Carlsbad, CA, http://www.invitrogen.com]-aminoacetaldehyde, 1 μM) for 30 minutes at 37°C, to allow the conversion of Aldefluor substrate. As a negative control, an aliquot of each sample was treated with the ALDH inhibitor diethylaminobenzaldehyde (DEAB) (15 μM). Cells were then counterstained with PE-labeled anti-CD133, anti-CD166, or anti-CD24 and APC-labeled anti-CD44 antibodies. PI (0.5 μg/ml) was added to the samples prior to analysis. Flow cytometric analysis was performed by using a dual laser BD FACSCalibur (BD Biosciences). Dead cells were excluded on the basis of PI incorporation.
Side Population Analysis
SP analysis was performed as described in [30]. Briefly, tumor cell suspensions were incubated in prewarmed culture medium containing Hoechst 33342 (5 μg/ml; Invitrogen) for 2 hours at 37°C. An aliquot of each sample was treated with verapamil (50 μM) (Sigma-Aldrich) for 10 minutes at room temperature, prior to the addition of Hoechst 33342. After incubation, tumor cells were washed and counterstained with FITC-labeled CD24-specific antibodies, PE-labeled CD166- or CD133-specific antibodies, and APC-labeled CD44-specific antibodies. Prior to analysis, 7-aminoactinomycin D (7-AAD) (4 μg/ml; Invitrogen) was added. Samples were analyzed by using a BD Influx (BD Biosciences). Dead cells were excluded on the basis of 7-AAD incorporation. Verapamil-treated samples were used as negative controls.
Chemosensitivity Assay
Dose-response curves were initially defined on parental cell lines. CRC cells (5 × 10³ well) were plated in 96-well plates and after 2 days of culture were exposed to titrated concentrations of 5-fluorouracil (5-FU) (Teva Pharma AG, Aesch, Switzerland, http://www.tevapharma.ch), oxaliplatin, or irinotecan (both from Sigma-Aldrich). After 3 days, percentages of viable cells were determined by the 3-(4,5-dimethylthiazol-2-yl)-2,5-diphenyltetrazolium (MTT) assay [31]. Low, intermediate, and high drug concentrations for each cell line were selected and used to assess the chemosensitivity of sorted cell subsets in comparison with parental cell lines, as described above.
Transplantation of Tumor Cells in Mice
In vivo experiments were approved by the Basel Cantonal Veterinary Office. NOD/SCID mice, initially obtained from Charles River Laboratories (Sulzfeld, Germany, http://www.criver.com), were bred and maintained under specific pathogen-free conditions in the animal facility of the Department of Biomedicine of the University of Basel. Eight- to 10-week-old mice were used for experiments.
Unsorted cells or sorted cell subsets were resuspended in a 1:1 mixture of phosphate-buffered saline and growth factor-reduced Matrigel matrix (BD Biosciences) and inoculated subcutaneously into the flank of recipient mice. Tumor development was monitored by palpation. Time to onset of a palpable tumor was recorded, and the tumor size was measured weekly by a dial caliper. Tumor volumes were calculated according to the formula (length × width2)/2. Mice were sacrificed when tumors reached a maximum diameter of 10 mm.
Statistical Analysis
Statistical analysis was performed by one-way analysis of variance and two-tailed Student's t test as appropriate, using the GraphPad Prism 5 software (GraphPad Software, Inc., San Diego, CA, http://www.graphpad.com). p values ≤ .05 were considered significant.
Results
Expression of CSC Markers on CRC Cell Lines
A panel of 10 well-characterized human CRC cell lines, including 6 cell lines included in the NCI60 panel, was used for this study (supplemental online Table 1). In order to identify putative CSC populations, the expression of surface molecules previously reported as CSC markers in human primary CRCs, including CD133, CD44, CD166, and CD24 [6–9], was analyzed by flow cytometry. All the markers were found to be heterogeneously expressed in different cell lines (Fig. 1). CD133 was expressed at very high levels and on virtually all cells (>99%) of the CACO2 cell line, whereas in the remaining cell lines it was expressed either by a majority of tumor cells (as on the HCT116, COLO201, HT29, and SW620 lines) or by a restricted cell subset (as on COLO205 and DLD1 cells). Finally, on three cell lines (LS180, HCT15, and SW480), it was not expressed at all. CD166 was expressed by a majority of cells in all cell lines, except for SW620 and SW480, where its expression was limited to a restricted cell subset, and CACO2 cells, which were completely negative. Most cell lines also expressed CD44 on a majority of cells. On the COLO205 and HCT15 cell lines, however, CD44 expression was present only on a minor cell fraction, and on COLO201 cells it was completely negative. Notably, in most cell lines (i.e., HCT116, HT29, COLO205, DLD1, LS180, and HCT15) CD166 and CD44 were coexpressed. Also, in the HCT116 and HT29 cell lines, coexpression of CD166, CD44, and CD133 molecules was detected in a majority of cells (data not shown).
Figure 1.
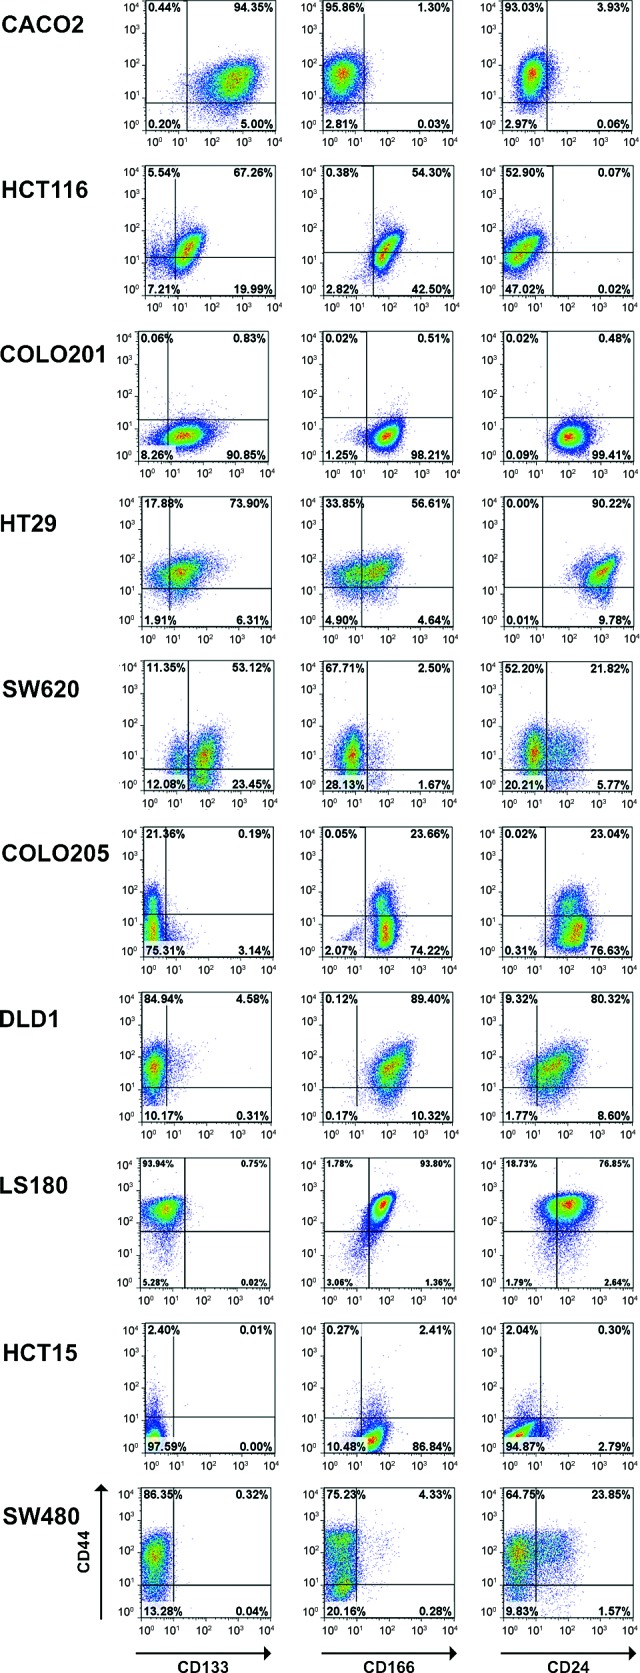
Cancer stem cell marker expression in human established colorectal cancer (CRC) cell lines. CRC cell lines were stained with fluorescein isothiocyanate-labeled anti-CD44, phycoerythrin-labeled anti-CD166 or anti-CD24, and allophycocyanin-labeled anti-CD133 antibodies and analyzed by flow cytometry. Dead cells were excluded on the basis of propidium iodide incorporation. Representative dot plots are shown.
Finally, CD24 was expressed on all cells in the COLO201, HT29, COLO205, DLD1, and LS180 cell lines, whereas it was only present on cell subsets in SW620, SW480, and HCT15. In contrast, CACO2 and HCT116 cells were completely negative. When present, CD24 was generally coexpressed with CD44, except for COLO201 cells.
Upon culture of cell lines in SF medium, a condition favoring preferential expansion of CSC subsets [7, 27] a slight increase in CD133 expression was detected on HT29 cells only, whereas no significant changes in CD166 expression were observed in any cell line (supplemental online Fig. 1). In contrast, CD44 expression was increased on COLO205, DLD1, and HCT15 cells, but it was decreased on SW620 and SW480 cells. Finally, CD24 was upregulated on SW620 and LS180 cells (supplemental online Fig. 1). In summary, all CRC cell lines analyzed included cells expressing putative CSC markers, although to different extents.
Correlation Between CSC Marker Expression and Spheroid Formation Ability
Next, we evaluated the correlation between CSC marker expression on CRC cell lines and functional CSC features. CSCs have been shown to display the ability to grow in spheroids, when cultured under low-adherence conditions [10, 32]. When spheroid formation ability was evaluated upon culture on polyHEMA-coated plasticware, no significant correlation with the expression of putative CSC markers was observed (Fig. 2). Indeed, spheroids were detected in cultures of CD133+ (HCT116 and HT29) as well as CD133− (DLD1 and HCT15) cell lines (Fig. 2A). LS180 cells, despite expressing both CD166 and CD44 markers at high levels, did not form spheroids, yet conversely, HCT15 cells, characterized by a limited expression of these markers, did. Spheroid formation also appeared to be independent from CD24 expression since cell lines largely positive for CD24 (e.g., COLO205) were not able to grow in spheroids, whereas cell lines negative for CD24 expression (i.e., HCT15 and HCT116) did grow in these conditions. Thus, expression of CD133, CD166/CD44, and CD24/CD44 does not correlate with spheroid formation ability. Moreover, the spheroid formation capacity of individual cell lines was not significantly modified upon culture of tumor cells in SF medium, except for COLO205 cells, which in SF medium were able to form aggregates (Fig. 2B).
Figure 2.
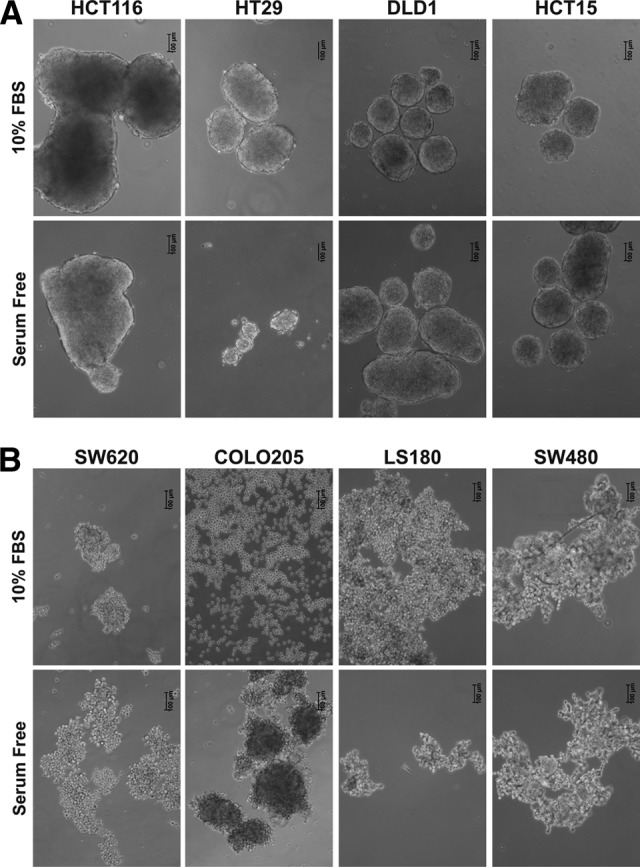
Spheroid formation ability of colorectal cancer (CRC) cell lines. CRC cell lines maintained in serum-containing or serum-free medium were cultured on poly-2-hydroxyethyl methacrylate-coated plates, and spheroid formation was evaluated after 7 days by microscopy. Pictures show one representative experiment out of five performed with similar results. Scale bars = 100 μm. Abbreviation: FBS, fetal bovine serum.
Clonogenicity of Tumor Cells Expressing Putative CSC Markers
We then analyzed the clonogenic potential of putative CSC populations derived from cell lines. CD133+, CD166+CD44+, or CD24+CD44+ cells were sorted by flow cytometry from individual cell lines (as depicted in supplemental online Fig. 2), and the frequencies of clonogenic cells within each subset were evaluated by limiting dilution analysis (Table 1). CD133+ cells isolated from HCT116 displayed in two of four experiments a slightly higher clonogenicity (up to twofold) as compared with their negative counterparts. When cultured in SF medium, CD133+ and CD133− HCT116 cells also exhibited comparable clonogenic capacity. Similarly, CD133+ cells from CACO2 and COLO205 exhibited equal or lower clonogenic capacity compared with CD133− cells.
Table 1.
Clonogenicity of putative cancer stem cell (CSC) subsets sorted from colorectal cancer cell lines
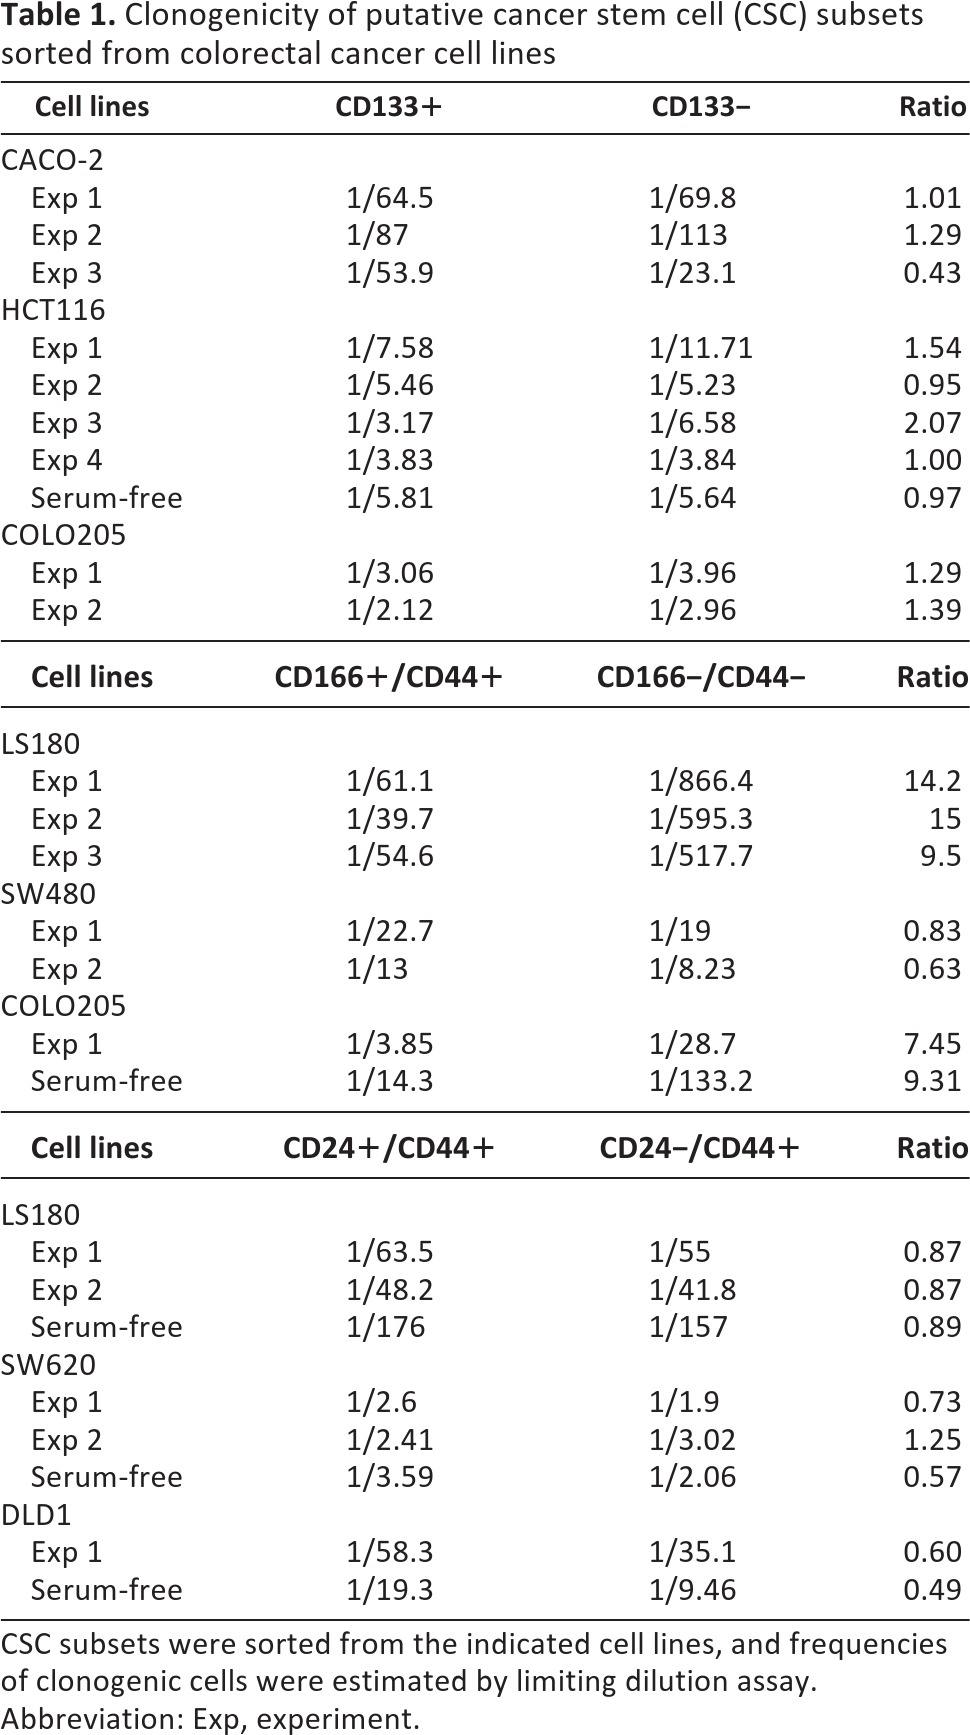
CSC subsets were sorted from the indicated cell lines, and frequencies of clonogenic cells were estimated by limiting dilution assay.
Abbreviation: Exp, experiment.
When CD166+CD44+ and CD166−CD44− cells were compared, CD166+CD44+ cells from LS180 and COLO205, but not those from SW480, exhibited a higher frequency of clonogenic cells (an increase of greater than or equal to sevenfold) as compared with their negative counterparts. Higher clonogenicity of the CD166+CD44+ subset, as compared with its negative counterpart, was also observed upon culture of COLO205 cells in SF medium, although in the latter case frequencies of clonogenic cells were overall reduced in comparison with cultures performed in serum-containing medium. Finally, CD24+CD44+ and CD24−CD44+ cell subsets isolated from the LS180, SW620, and DLD1 cell lines showed comparable clonogenicity in serum-containing medium and in SF medium. Therefore, expression of CSC markers does not appear to be strictly associated with a high clonogenicity of tumor cells.
ALDH-1 Activity of Putative CSC Populations in CRC Cell Lines
Normal stem cells, as well as CSCs, have been reported to express high levels of ALDH-1 enzyme [13, 33]. ALDH-1 activity was therefore evaluated on CRC cell lines in combination with the expression of putative CSC markers. Following Aldefluor staining, in all cell lines a large fraction of Aldefluor+ cells was detected (Fig. 3A), whose specificity was confirmed by treatment with the ALDH-1 inhibitor DEAB (supplemental online Fig. 3A). Overall, the percentages of Aldefluor+ cells did not correlate with the frequencies of tumor cells expressing CSC markers (data not shown). We then evaluated ALDH-1 activity within specific CSC subsets. Frequencies of Aldefluor+ cells within CD133+ or CD24+CD44+ cells were found to be comparable to those observed within their negative counterparts or parental cell lines (Fig. 3B; data not shown). In contrast, in the LS180 cell line, CD166+CD44+ cells were found to preferentially include Aldefluor+ cells as compared with the CD166−CD44− subset. The association between ALDH-1 activity and CD166/CD44 coexpression, however, was not present in other cell lines, including SW480, SW620, and COLO205 (Fig. 3B; data not shown). We also conversely evaluated the expression of CSC markers within Aldefluor+ fractions, as compared with Aldefluor− or unsorted cells, and we did not observe major differences (supplemental online Fig. 3B; data not shown). These findings indicate that in established CRC cell lines ALDH-1 activity is not limited to cells expressing putative CSC markers but is detectable throughout the entire tumor cell population.
Figure 3.

ALDH-1 activity on putative cancer stem cell populations in colorectal cancer (CRC) cell lines. (A): CRC cell lines were stained with the Aldefluor reagent system. Aldefluor+ cells were gated relative to samples stained in the presence of the Aldefluor inhibitor diethylaminobenzaldehyde (supplemental online Fig. 2A). (B): Aldefluor-stained CRC cells were counterstained with CD133-, CD166-, CD44-, and CD24-specific antibodies. Percentages of Aldefluor+ cells within unsorted cell lines; gated CD133+, CD166+CD44+, or CD24+CD44+ subsets; and their negative counterparts were assessed. Means ± SD from triplicates of two independent experiments are reported. ***, p ≤ .005. Abbreviations: SSC, side scatter; Uns, unsorted.
SP Phenotype in CRC Cells Expressing CSC Markers
An additional feature of CSCs is represented by their ability to actively extrude the DNA-binding dye Hoechst 33342 through specific drug transporters, thus acquiring the so-called SP phenotype [14–16]. We tested whether putative CSC subsets preferentially display an SP phenotype. Upon incubation with Hoechst 33342, an SP was detected in all CRC cell lines, with the exception of SW620 (Fig. 4A). However, no significant correlation with the CSC marker expression was observed. Indeed, percentages of SP fractions were not increased within CD133+ or CD166+CD44+ cells as compared with their negative counterparts or with their parental cell lines (Fig. 4B). Accordingly, no preferential expression of CD133 or coexpression of CD166 and CD44 was found within SP as compared with non-side population (non-SP) subsets or with parental cell lines (supplemental online Fig. 4B). In contrast, CD24+CD44+ cells from the SW480 cell line, but not those from the LS180 or DLD1 cell line, displayed higher frequencies of SP cells as compared with CD24−CD44+ cells and with the unsorted SW480 cell line. Consistently, enriched expression of CD24/CD44 molecules was detected in SP in comparison with non-SP SW480 cells (supplemental online Fig. 4B).
Figure 4.

Side population phenotype versus cancer stem cell marker expression in colorectal cancer (CRC) cell lines. (A): CRC cell lines were stained with Hoechst 33342, and percentages of side population (SP) were evaluated in comparison with cells stained in the presence of verapamil (supplemental online Fig. 3A). (B): Hoechst-stained cells were counterstained with CD133-, CD166-, CD44-, and CD24-specific antibodies. Percentages of SP within unsorted cell lines; gated CD133+, CD166+CD44+, or CD24+CD44+ subsets; and their negative counterparts were assessed. Means ± SD from triplicates of two independent experiments are reported. ***, p ≤ .005. Abbreviation: Uns, unsorted.
Chemosensitivity of Putative CSC Populations in CRC Cell Lines
CSCs from primary tumors have been shown to display a high resistance to chemotherapeutic treatments [34–36]. We evaluated the sensitivity of putative CSC populations, derived from CRC cell lines, to chemotherapeutic drugs currently in use for CRC treatment, including 5-FU, oxaliplatin, and irinotecan. Different cell subsets sorted from individual cell lines were exposed to low, intermediate, and high drug concentrations, selected on the basis of dose-response curves of parental cell lines (see Materials and Methods). CD133+ cells from the HCT116 cell line displayed a significantly increased survival upon treatment with irinotecan, but not with 5-FU or oxaliplatin, in comparison with both CD133− and parental cells (p < .05; Fig. 5A). Instead, CD133+ cells sorted from the HT29 line exhibited slightly higher survival than CD133− cells in response to oxaliplatin (p < .05), whereas their sensitivity to 5-FU and irinotecan was comparable to that of their negative counterpart or the parental cell line (Fig. 5B).
Figure 5.

Drug sensitivity of colorectal cancer cell line-derived putative cancer stem cell (CSC) populations. CD133+, CD166+CD44+, and CD24+CD44+ or their negative counterparts were sorted from the indicated cell lines and cultured in the presence of the indicated concentrations of 5-fluorouracil, oxaliplatin, or irinotecan. After 72 hours, cell viability was evaluated by 3-(4,5-dimethylthiazol-2-yl)-2,5-diphenyltetrazolium (MTT) staining. Percentages (averages ± SD of quadruplicate cultures) of surviving cells are reported. Statistical evaluation was performed by two-tailed Student's t test. Only significantly increased percentages of survival (p ≤ .05) of putative CSCs relative to negative counterparts or parental cells are indicated. Reported data refer to one representative experiment out of two performed with similar results. Abbreviation: Conc, concentration.
CD166+CD44+ cells from the LS180 cell line displayed comparable sensitivity to 5-FU but reduced survival in response to both oxaliplatin and irinotecan as compared with CD166−CD44− cells and with parental cells (p ≤ .05; Fig. 5C). CD166+CD44+ cells from the SW620 cell line showed slightly higher resistance to oxaliplatin as compared with parental cells (p = .05) but not with their negative counterpart, whereas in response to 5-FU and irinotecan they showed comparable or lower survival compared with the other populations tested (Fig. 5D).
Finally, CD24+CD44+ cells from the SW480 cell line displayed significantly higher survival in comparison with unsorted cells in response to 5-FU (p < .01) and with both unsorted and CD24−CD44+ cells in response to oxaliplatin (p < .05). Furthermore, they showed a trend toward higher resistance in response to irinotecan (Fig. 5E). CD24+CD44+ cells from the SW620 line, however, exhibited a comparable or higher sensitivity compared with unsorted or CD24−CD44+ cells to all drugs tested (Fig. 5F). Thus, putative CSC populations did not consistently show higher survival rate upon treatment with anti-CRC chemotherapeutic drugs.
Tumor Initiating Capacity of CRC Cell Subsets Expressing Putative CSC Markers
Putative CSC subsets were finally evaluated for tumor formation capacity in immunodeficient mice. Titrated numbers of (a) CD133+ or CD133− cells, sorted from the CACO2, HCT116, and COLO205 cell lines; (b) CD44+CD166+ cells or their double-negative counterparts, sorted from the LS180, SW480, and COLO205 cell lines; and (c) CD24+CD44+ and CD24−CD44+ cells from LS180 cells were injected subcutaneously into NOD/SCID mice, and tumor development was monitored over time. No major differences in tumorigenicity between tumor cells expressing CSC markers and their negative counterparts or the unsorted parental cell lines were observed when cell lines were cultured in either serum-containing medium or in SF medium (Table 2). The growth kinetics of developing tumors from different cell subsets was also found to be comparable in most of cell line tested (supplemental online Fig. 5). Only CD166+CD44+ cells isolated from the LS180 displayed accelerated tumor development as compared with CD166−CD44− cells. Thus, CRC cells expressing putative CSC markers did not show preferential tumor initiating capacity in immunodeficient mice.
Table 2.
Tumor formation capacity of putative of cancer stem cell (CSC) subsets in colorectal cancer cell lines
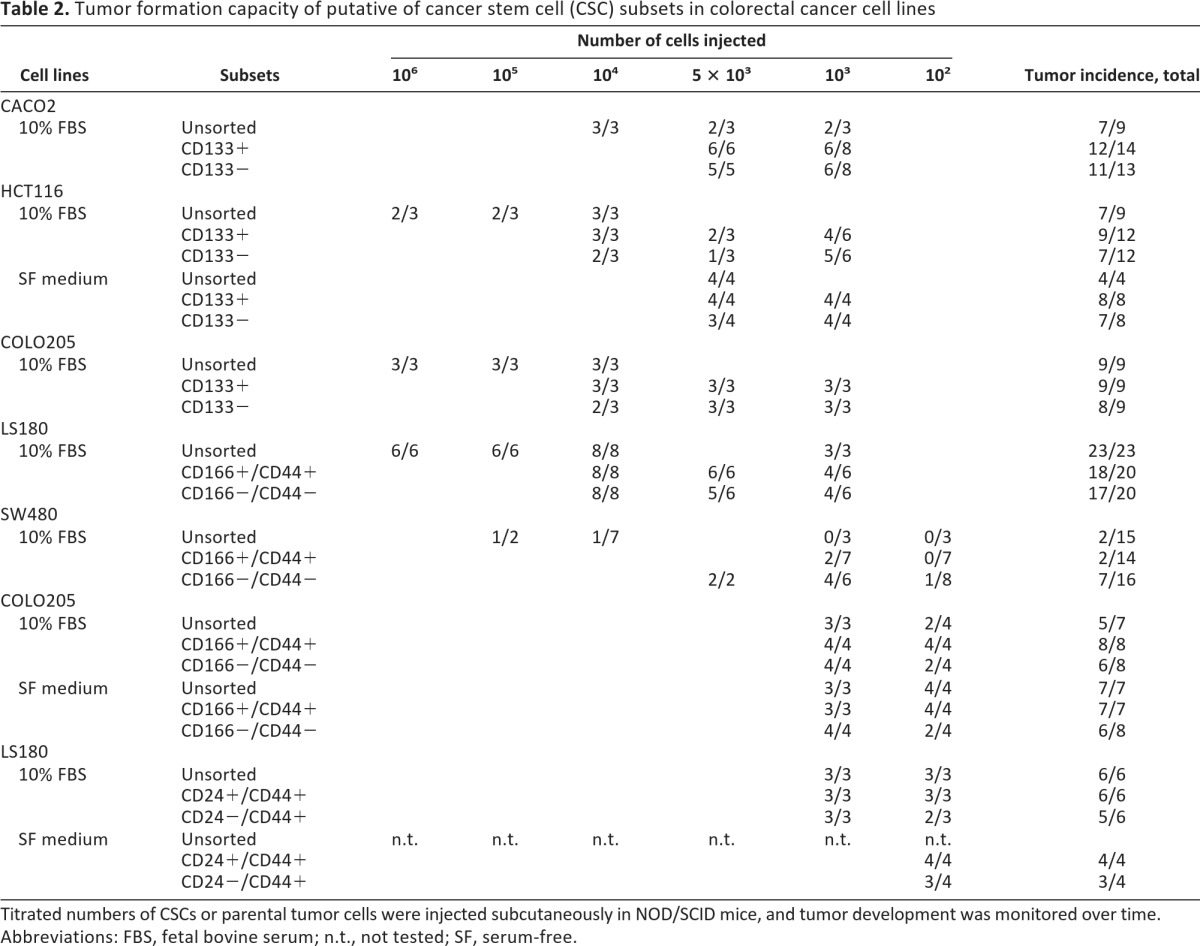
Titrated numbers of CSCs or parental tumor cells were injected subcutaneously in NOD/SCID mice, and tumor development was monitored over time.
Abbreviations: FBS, fetal bovine serum; n.t., not tested; SF, serum-free.
Discussion
Increasing evidence in favor of the existence, within primary tumors, of CSC populations capable of surviving conventional chemotherapies urges the development of novel CSC-targeted treatments. Screening of new anticancer compounds is conventionally conducted on established tumor cell lines, providing sufficient material for high-throughput studies [18, 26]. However, whether tumor cell lines might comprise CSC populations resembling those of primary tumors remains highly debated.
Here, we have evaluated the expression of surface molecules previously reported as CSC markers in human CRC, including CD133, CD166, CD44, and CD24, on a panel of CRC established cell lines, and we have analyzed their correlation with stem cell-like functional features. Whereas cell subsets expressing CSC markers were largely represented in all cell lines, no consistent correlation between expression of any of the putative CSC phenotypes and stem cell-like features was found. Cells expressing either CD133, CD166/CD44, or CD24/CD44 molecules did not preferentially exhibit CSC properties, such as spheroid formation ability, clonogenicity, high ALDH-1 activity, SP phenotype, tumorigenicity, and chemoresistance, as compared with their negative counterparts or parental cell lines. Thus, in human established CRC cell lines, CD133+, CD166+CD44+, and CD24+CD44+ phenotypes do not reliably identify CSC populations.
Recently, several groups have provided experimental evidence in favor of the existence of CSCs in human CRC. It was initially shown that tumor cells from primary CRC were not all endowed with comparable tumorigenicity, but only those expressing CD133 molecules exhibited cancer initiating capacity upon xenografting in immunodeficient mice [2, 6]. The existence of a hierarchical organization within CRC tissues has been subsequently confirmed by other groups, although the expression of CD44 and the coexpression of CD166/CD44 molecules, as well as ALDH-1 activity, have been proposed as alternative CSC phenotypes [8, 33, 37, 38].
In contrast, the existence of CSC populations, identifiable by specific phenotypes in established CRC cell lines, has not been convincingly demonstrated so far. The expression of putative CSC markers on CRC cells from established cell lines has been investigated in previous work, but contradictory findings have been reported. Expression of CD133 in several established CRC cell lines has been reported, and its presence has been shown to correlate with high clonogenicity and increased tumorigenicity, although in the latter case, CD133+ or CD133− cells from a single cell line (HT29) were tested in a limited number of recipients (n = 5 per subset) [23]. In another study, CD24+CD44+ cells from one cell line (SW1222), cultured in three-dimensional (3D) structures, were shown to be characterized by higher clonogenicity and tumorigenicity than CD24−CD44− cells [9]. This finding, however, did not apply to other cell lines tested [9]. In addition, the relevance of CD44 expression, in the absence of CD24, was not fully evaluated. Kai et al. reported an association between CD44 expression and high clonogenicity in one CRC cell line [39]. However, no preferential tumorigenicity by CD44+ as compared with CD44− cells was observed [39].
More recently, expression of several CSC markers, including CD133, CD166, CD44, CD24, and ALDH-1, was extensively analyzed in the entire NCI60 panel, including seven CRC cell lines, but no correlation between these markers and clonogenicity and/or tumorigenicity was observed [40]. In this study, however, stem cell-like features of tumor cells have been evaluated in parental cell lines only. No analysis on sorted putative CSC subsets from individual cell lines in comparison with their negative counterparts was conducted. Importantly, the chemosensitivity of putative CSC populations was not tested.
Here, we have performed a systematic assessment of the major putative CSC phenotypes reported in human CRC, including the expression of CD133 and the coexpression of CD166 and CD44 or of CD24 and CD44, on a panel of 10 established cell lines, 6 of which were included in the NCI60 panel. In accordance with previous findings, we found that all putative CSC markers were expressed in CRC cell lines, although their distribution largely varied between different cell lines. On parental cell lines, none of the markers was found to correlate with spheroid formation ability. Furthermore, upon sorting of specific cell subsets, CD133+ and CD133− cells isolated from three different cell lines consistently exhibited comparable clonogenicity, tumorigenicity, and chemosensitivity. In contrast, CD166+CD44+ cells from the LS180 cell line showed higher clonogenicity and accelerated tumor development as compared with CD166−CD44− cells. This association however, was not present when CD166+CD44+ and CD166−CD44− cells from SW480 and SW620 were tested. Thus, the correlation between CD166/CD44 coexpression and high clonogenicity or tumorigenicity appears to be unique to the LS180 cell line. Furthermore, CD166/CD44 expression did not correlate with high chemoresistance, since CD166+CD44+ cells from the LS180 cell line displayed a comparable or higher sensitivity to the drugs tested compared with their negative counterparts.
Similarly, coexpression of CD24 and CD44 molecules was ineffective in discriminating tumor cells endowed with stemness-related properties. Indeed, CD24-expressing cells demonstrated neither higher clonogenicity nor higher tumorigenicity. Alternatively, upon evaluation of chemosensitivity, CD24+CD44+ cells from SW480, but not those from SW620, displayed a higher survival rate than their CD24−CD44+ counterparts.
Flow cytometry-based analysis of CSC markers in combination with additional putative CSC phenotypes, such as ALDH-1 activity and SP phenotype, did not reveal differences between CSC marker-expressing or nonexpressing cells. Notably, ALDH-1 activity was found in a majority of CRC cells, in contrast to what has been reported for primary CRCs, where ALDH-1 activity was found in a limited subset of cells [8, 33]. SPs were detected in all cell lines except SW620, but no consistent enrichment within the tumor cells expressing putative CSC markers was observed. This is in accordance with previous reports indicating that SPs in CRC cell lines are not enriched in CSCs [41, 42]. Within SW480 cells, however, SP phenotype was associated with CD24/CD44 expression. Interestingly, CD24+CD44+ SW480 cells displayed enhanced resistance to all drugs tested, suggesting that the expression of specific molecular pumps on these cells might contribute to surviving chemotherapy. The association between SP and CD24/CD44 expression was not confirmed, however, in the SW620 cell line, where no SP was detected despite the presence of a large fraction of CD24+CD44+ cells. Taken together, our results demonstrate that in contrast to human primary tumors, in CRC established cell lines, CD133, CD166/CD44, and CD24/CD44 expression correlates with CSC properties sporadically and in a cell line-specific manner but does not reliably identify CSC populations.
Several factors might account for the discrepancy observed between primary tumors and established CRC cell lines. One possibility is that CSCs potentially comprised within established cell lines express markers that differ from those expressed by CSCs in vivo. Indeed, the expression of surface molecules, and in particular of adhesion molecules such as CD44, CD166, and CD24, is tightly modulated by signals derived from the microenvironment, such as interactions with extracellular matrix components and/or surrounding cells [40, 43], which may be missing in conventional in vitro cultures.
Also, the absence of a three-dimensional architecture in conventional monolayers may, per se, account for different surface molecule expression profiles. Patterns of surface marker expression in tumor cell lines expanded in two dimensions have been shown to differ from those of corresponding cell lines grown in three dimensions [40].
Conversely, a variety of factors related to in vitro cultures, including high proliferation rates [44], occult infections [45], high cell density, and medium compositions [25] (M.G. Muraro, unpublished observations), may contribute to altering putative CSC marker expression levels. Serum-containing media, in particular, have been shown to inhibit expression of CSC markers, including CD133, on CRC cells [7]. Indeed, upon culture of cell lines in SF medium we observed modifications in the expression levels of CD133, CD44, and CD24 molecules (supplemental online Fig. 1). Also under these culture conditions, however, no consistent correlation between expression of CSC markers and stem cell-like properties was observed, indicating that the unreliability of the proposed CSC phenotypes in established cell lines is not merely related to the presence of serum in culture media.
The identification of more reliable markers would therefore be desirable for the detection of CSCs in cell lines. Recently, in a mouse model of intestinal adenomas, crypt stem cells, expressing the Wnt target gene Lrg5, have been shown to be uniquely endowed with tumor initiating capacity [46]. Consistently, in primary CRC and established cell lines, high Wnt signaling activity, revealed by a fluorescent-reporter assay, has been found to mark tumor cells with high clonogenic and tumorigenic capacities [43]. The use of this type of reporter assay might prove helpful in identifying CSC populations in cell lines for drug screenings.
Alternatively, because of adaptation to in vitro culture conditions, established cell lines may have lost the hierarchical structure typical of primary tumors. Some observations suggest that in defined CRC cell lines, all tumor cells appear to possess an equal capacity to generate xenografts in immunodeficient mice, thus conforming to a stochastic model rather than a CSC model [39, 47]. Importantly, it has recently been demonstrated that stemness of CRC cells is largely regulated by extrinsic factors derived by tumor-associated myofibroblasts [43]. Thus, monocultures of established cell lines may fail to reproduce the CSC model observed in primary CRC because of the lack of cross-talk between cancer and stromal cells. The establishment of improved culture systems integrating 3D structures and stromal cell components is therefore required for the development of novel drug screening systems.
Conclusion
By performing a comprehensive analysis of putative CSC markers on established CRC cell lines, we demonstrated that in contrast to primary tumors, in cell lines the expression of CD133, CD166/CD44, and CD24/CD44 does not reliably identify CSC populations. Our findings reveal an inadequacy of conventional cultures of tumor cell lines for the screening of CSC-specific therapies and underline the urgency of developing novel platforms for anticancer drug discovery.
Acknowledgments
We thank Verena Jäggin, Emmanuel Traunecker, and Toni Krebs for excellent technical assistance with the flow cytometry-based analysis. We also thank Dr. B. Kvinlaug and C. Le Magnen for helpful discussion and critical revision of the manuscript and Dr. C. Mengus for advice regarding statistical analysis. This work was supported by Kommission für Technologie und Innovation (10761), the Swiss National Science Foundation (PMPD33-118653, PP00P3-133699, 31003A-122235, and 310030-127490), and Freiwillige Akademische Gesellschaft.
Author Contributions
M.G.M.: conception and design, collection and assembly of data, data analysis and interpretation, manuscript writing, final approval of manuscript; V.M., S.D., and J.H.: collection and assembly of data, data analysis and interpretation, final approval of manuscript; M.H.: conception and design, data analysis and interpretation, financial support, final approval of manuscript; G.C.S.: conception and design, data analysis and interpretation, obtaining funding, final approval of manuscript; G.I.: conception and design, collection and assembly of data, data analysis and interpretation, obtaining funding, manuscript writing, final approval of manuscript, study supervision.
Disclosure of Potential Conflicts of Interest
The authors indicate no potential conflicts of interest.
References
- 1.Polyak K, Hahn WC. Roots and stems: Stem cells in cancer. Nat Med. 2006;12:296–300. doi: 10.1038/nm1379. [DOI] [PubMed] [Google Scholar]
- 2.Reya T, Morrison SJ, Clarke MF, et al. Stem cells, cancer, and cancer stem cells. Nature. 2001;414:105–111. doi: 10.1038/35102167. [DOI] [PubMed] [Google Scholar]
- 3.Clevers H. The cancer stem cell: Premises, promises and challenges. Nat Med. 2011;17:313–319. doi: 10.1038/nm.2304. [DOI] [PubMed] [Google Scholar]
- 4.Dalerba P, Cho RW, Clarke MF. Cancer stem cells: Models and concepts. Annu Rev Med. 2007;58:267–284. doi: 10.1146/annurev.med.58.062105.204854. [DOI] [PubMed] [Google Scholar]
- 5.Gires O. Lessons from common markers of tumor-initiating cells in solid cancers. Cell Mol Life Sci. 2011;68:4009–4022. doi: 10.1007/s00018-011-0772-9. [DOI] [PMC free article] [PubMed] [Google Scholar]
- 6.O'Brien CA, Pollett A, Gallinger S, et al. A human colon cancer cell capable of initiating tumour growth in immunodeficient mice. Nature. 2007;445:106–110. doi: 10.1038/nature05372. [DOI] [PubMed] [Google Scholar]
- 7.Ricci-Vitiani L, Lombardi DG, Pilozzi E, et al. Identification and expansion of human colon-cancer-initiating cells. Nature. 2007;445:111–115. doi: 10.1038/nature05384. [DOI] [PubMed] [Google Scholar]
- 8.Dalerba P, Dylla SJ, Park IK, et al. Phenotypic characterization of human colorectal cancer stem cells. Proc Natl Acad Sci USA. 2007;104:10158–10163. doi: 10.1073/pnas.0703478104. [DOI] [PMC free article] [PubMed] [Google Scholar]
- 9.Yeung TM, Gandhi SC, Wilding JL, et al. Cancer stem cells from colorectal cancer-derived cell lines. Proc Natl Acad Sci USA. 2010;107:3722–3727. doi: 10.1073/pnas.0915135107. [DOI] [PMC free article] [PubMed] [Google Scholar]
- 10.Visvader JE, Lindeman GJ. Cancer stem cells in solid tumours: Accumulating evidence and unresolved questions. Nat Rev Cancer. 2008;8:755–768. doi: 10.1038/nrc2499. [DOI] [PubMed] [Google Scholar]
- 11.Zhang M, Behbod F, Atkinson RL, et al. Identification of tumor-initiating cells in a p53-null mouse model of breast cancer. Cancer Res. 2008;68:4674–4682. doi: 10.1158/0008-5472.CAN-07-6353. [DOI] [PMC free article] [PubMed] [Google Scholar]
- 12.Bao S, Wu Q, McLendon RE, et al. Glioma stem cells promote radioresistance by preferential activation of the DNA damage response. Nature. 2006;444:756–760. doi: 10.1038/nature05236. [DOI] [PubMed] [Google Scholar]
- 13.Ginestier C, Hur MH, Charafe-Jauffret E, et al. ALDH1 is a marker of normal and malignant human mammary stem cells and a predictor of poor clinical outcome. Cell Stem Cell. 2007;1:555–567. doi: 10.1016/j.stem.2007.08.014. [DOI] [PMC free article] [PubMed] [Google Scholar]
- 14.Bleau AM, Hambardzumyan D, Ozawa T, et al. PTEN/PI3K/Akt pathway regulates the side population phenotype and ABCG2 activity in glioma tumor stem-like cells. Cell Stem Cell. 2009;4:226–235. doi: 10.1016/j.stem.2009.01.007. [DOI] [PMC free article] [PubMed] [Google Scholar]
- 15.Hirschmann-Jax C, Foster AE, Wulf GG, et al. A distinct “side population” of cells with high drug efflux capacity in human tumor cells. Proc Natl Acad Sci USA. 2004;101:14228–14233. doi: 10.1073/pnas.0400067101. [DOI] [PMC free article] [PubMed] [Google Scholar]
- 16.Patrawala L, Calhoun T, Schneider-Broussard R, et al. Side population is enriched in tumorigenic, stem-like cancer cells, whereas ABCG2+ and ABCG2− cancer cells are similarly tumorigenic. Cancer Res. 2005;65:6207–6219. doi: 10.1158/0008-5472.CAN-05-0592. [DOI] [PubMed] [Google Scholar]
- 17.Shoemaker RH. The NCI60 human tumour cell line anticancer drug screen. Nat Rev Cancer. 2006;6:813–823. doi: 10.1038/nrc1951. [DOI] [PubMed] [Google Scholar]
- 18.Zhou BB, Zhang H, Damelin M, et al. Tumour-initiating cells: Challenges and opportunities for anticancer drug discovery. Nat Rev Drug Discov. 2009;8:806–823. doi: 10.1038/nrd2137. [DOI] [PubMed] [Google Scholar]
- 19.Fillmore CM, Kuperwasser C. Human breast cancer cell lines contain stem-like cells that self-renew, give rise to phenotypically diverse progeny and survive chemotherapy. Breast Cancer Res. 2008;10:R25. doi: 10.1186/bcr1982. [DOI] [PMC free article] [PubMed] [Google Scholar]
- 20.Charafe-Jauffret E, Ginestier C, Iovino F, et al. Breast cancer cell lines contain functional cancer stem cells with metastatic capacity and a distinct molecular signature. Cancer Res. 2009;69:1302–1313. doi: 10.1158/0008-5472.CAN-08-2741. [DOI] [PMC free article] [PubMed] [Google Scholar]
- 21.Kondo T, Setoguchi T, Taga T. Persistence of a small subpopulation of cancer stem-like cells in the C6 glioma cell line. Proc Natl Acad Sci USA. 2004;101:781–786. doi: 10.1073/pnas.0307618100. [DOI] [PMC free article] [PubMed] [Google Scholar]
- 22.Hermann PC, Huber SL, Herrler T, et al. Distinct populations of cancer stem cells determine tumor growth and metastatic activity in human pancreatic cancer. Cell Stem Cell. 2007;1:313–323. doi: 10.1016/j.stem.2007.06.002. [DOI] [PubMed] [Google Scholar]
- 23.Ieta K, Tanaka F, Haraguchi N, et al. Biological and genetic characteristics of tumor-initiating cells in colon cancer. Ann Surg Oncol. 2008;15:638–648. doi: 10.1245/s10434-007-9605-3. [DOI] [PubMed] [Google Scholar]
- 24.Sandberg R, Ernberg I. Assessment of tumor characteristic gene expression in cell lines using a tissue similarity index (TSI) Proc Natl Acad Sci USA. 2005;102:2052–2057. doi: 10.1073/pnas.0408105102. [DOI] [PMC free article] [PubMed] [Google Scholar]
- 25.van Staveren WC, Solis DY, Hebrant A, et al. Human cancer cell lines: Experimental models for cancer cells in situ? For cancer stem cells? Biochim Biophys Acta. 2009;1795:92–103. doi: 10.1016/j.bbcan.2008.12.004. [DOI] [PubMed] [Google Scholar]
- 26.Gupta PB, Onder TT, Jiang G, et al. Identification of selective inhibitors of cancer stem cells by high-throughput screening. Cell. 2009;138:645–659. doi: 10.1016/j.cell.2009.06.034. [DOI] [PMC free article] [PubMed] [Google Scholar]
- 27.Kreso A, O'Brien CA. Colon cancer stem cells. Curr Protoc Stem Cell Biol. 2008 doi: 10.1002/9780470151808.sc0301s7. Chapter 3:Unit 3.1. [DOI] [PubMed] [Google Scholar]
- 28.Ghosh S, Spagnoli GC, Martin I, et al. Three-dimensional culture of melanoma cells profoundly affects gene expression profile: A high density oligonucleotide array study. J Cell Physiol. 2005;204:522–531. doi: 10.1002/jcp.20320. [DOI] [PubMed] [Google Scholar]
- 29.Hu Y, Smyth GK. ELDA: Extreme limiting dilution analysis for comparing depleted and enriched populations in stem cell and other assays. J Immunol Methods. 2009;347:70–78. doi: 10.1016/j.jim.2009.06.008. [DOI] [PubMed] [Google Scholar]
- 30.Goodell MA, Brose K, Paradis G, et al. Isolation and functional properties of murine hematopoietic stem cells that are replicating in vivo. J Exp Med. 1996;183:1797–1806. doi: 10.1084/jem.183.4.1797. [DOI] [PMC free article] [PubMed] [Google Scholar]
- 31.Scudiero DA, Shoemaker RH, Paull KD, et al. Evaluation of a soluble tetrazolium/formazan assay for cell growth and drug sensitivity in culture using human and other tumor cell lines. Cancer Res. 1988;48:4827–4833. [PubMed] [Google Scholar]
- 32.Reynolds BA, Rietze RL. Neural stem cells and neurospheres—re-evaluating the relationship. Nat Methods. 2005;2:333–336. doi: 10.1038/nmeth758. [DOI] [PubMed] [Google Scholar]
- 33.Huang EH, Hynes MJ, Zhang T, et al. Aldehyde dehydrogenase 1 is a marker for normal and malignant human colonic stem cells (SC) and tracks SC overpopulation during colon tumorigenesis. Cancer Res. 2009;69:3382–3389. doi: 10.1158/0008-5472.CAN-08-4418. [DOI] [PMC free article] [PubMed] [Google Scholar]
- 34.Dylla SJ, Beviglia L, Park IK, et al. Colorectal cancer stem cells are enriched in xenogeneic tumors following chemotherapy. PLoS One. 2008;3:e2428. doi: 10.1371/journal.pone.0002428. [DOI] [PMC free article] [PubMed] [Google Scholar]
- 35.Todaro M, Alea MP, Di Stefano AB, et al. Colon cancer stem cells dictate tumor growth and resist cell death by production of interleukin-4. Cell Stem Cell. 2007;1:389–402. doi: 10.1016/j.stem.2007.08.001. [DOI] [PubMed] [Google Scholar]
- 36.Li X, Lewis MT, Huang J, et al. Intrinsic resistance of tumorigenic breast cancer cells to chemotherapy. J Natl Cancer Inst. 2008;100:672–679. doi: 10.1093/jnci/djn123. [DOI] [PubMed] [Google Scholar]
- 37.Chu P, Clanton DJ, Snipas TS, et al. Characterization of a subpopulation of colon cancer cells with stem cell-like properties. Int J Cancer. 2009;124:1312–1321. doi: 10.1002/ijc.24061. [DOI] [PubMed] [Google Scholar]
- 38.Du L, Wang H, He L, et al. CD44 is of functional importance for colorectal cancer stem cells. Clin Cancer Res. 2008;14:6751–6760. doi: 10.1158/1078-0432.CCR-08-1034. [DOI] [PubMed] [Google Scholar]
- 39.Kai K, Nagano O, Sugihara E, et al. Maintenance of HCT116 colon cancer cell line conforms to a stochastic model but not a cancer stem cell model. Cancer Sci. 2009;100:2275–2282. doi: 10.1111/j.1349-7006.2009.01318.x. [DOI] [PMC free article] [PubMed] [Google Scholar]
- 40.Stuelten C, Mertins S, Busch J, et al. Complex display of putative tumor stem cell markers in the NCI60 tumor cell line panel. Stem Cells. 2010;28:649–660. doi: 10.1002/stem.324. [DOI] [PMC free article] [PubMed] [Google Scholar]
- 41.Haraguchi N, Utsunomiya T, Inoue H, et al. Characterization of a side population of cancer cells from human gastrointestinal system. Stem Cells. 2006;24:506–513. doi: 10.1634/stemcells.2005-0282. [DOI] [PubMed] [Google Scholar]
- 42.Burkert J, Otto WR, Wright NA. Side populations of gastrointestinal cancers are not enriched in stem cells. J Pathol. 2008;214:564–573. doi: 10.1002/path.2307. [DOI] [PubMed] [Google Scholar]
- 43.Vermeulen L, De Sousa E Melo, van der HM, et al. Wnt activity defines colon cancer stem cells and is regulated by the microenvironment. Nat Cell Biol. 2010;12:468–476. doi: 10.1038/ncb2048. [DOI] [PubMed] [Google Scholar]
- 44.Jaksch M, Munera J, Bajpai R, et al. Cell cycle-dependent variation of a CD133 epitope in human embryonic stem cell, colon cancer, and melanoma cell lines. Cancer Res. 2008;68:7882–7886. doi: 10.1158/0008-5472.CAN-08-0723. [DOI] [PMC free article] [PubMed] [Google Scholar]
- 45.Mariotti E, Gemei M, Mirabelli P, et al. The percentage of CD133+ cells in human colorectal cancer cell lines is influenced by Mycoplasma hyorhinis infection 4. BMC Cancer. 2010;10:120. doi: 10.1186/1471-2407-10-120. [DOI] [PMC free article] [PubMed] [Google Scholar]
- 46.Barker N, Ridgway RA, van Es JH, et al. Crypt stem cells as the cells-of-origin of intestinal cancer. Nature. 2009;457:608–611. doi: 10.1038/nature07602. [DOI] [PubMed] [Google Scholar]
- 47.Dittfeld C, Dietrich A, Peickert S, et al. CD133 expression is not selective for tumor-initiating or radioresistant cell populations in the CRC cell line HCT-116. Radiother Oncol. 2010;94:375–383. doi: 10.1016/j.radonc.2009.10.010. [DOI] [PMC free article] [PubMed] [Google Scholar]