

This study was undertaken to determine the variability in induced pluripotent stem cell (iPSC) lines derived from different individuals, with the aim of determining criteria for selecting iPSC lines for disease models. It was found that it is possible to define a similar “ground state” for each cell line as the basis for making patient versus control comparisons, an essential step in order to identify disease-associated variability above individual and cell line variability.
Keywords: Cell biology, Gene expression, Reprogramming, Induced pluripotent stem cells
Abstract
In the field of disease modeling, induced pluripotent stem cells (iPSCs) have become an appealing choice, especially for diseases that do not have an animal model. They can be generated from patients with known clinical features and compared with cells from healthy controls to identify the biological bases of disease. This study was undertaken to determine the variability in iPSC lines derived from different individuals, with the aim of determining criteria for selecting iPSC lines for disease models. We generated and characterized 18 iPSC lines from eight donors and considered variability at three levels: (a) variability in the criteria that define iPSC lines as pluripotent cells, (b) variability in cell lines from different donors, and (c) variability in cell lines from the same donor. We found that variability in transgene expression and pluripotency marker levels did not prevent iPSCs from fulfilling all other criteria for pluripotency, including teratoma formation. We found low interindividual and interclonal variability in iPSCs that fulfilled the most stringent criteria for pluripotency, with very high correlation in their gene expression profiles. Interestingly, some cell lines exhibited reprogramming instability, spontaneously regressing from a fully to a partially reprogrammed state. This was associated with a low percentage of cells expressing the pluripotency marker stage-specific embryonic antigen-4. Our study shows that it is possible to define a similar “ground state” for each cell line as the basis for making patient versus control comparisons, an essential step in order to identify disease-associated variability above individual and cell line variability.
Introduction
One of the driving forces behind stem cell biology is the desire to develop cellular models of human diseases as tools for understanding the etiology of disease, for developing biomarkers, for drug discovery, and for toxicology [1]. For most human neurological disorders there is a lack of cellular models. In the case of some single-gene genetic diseases, there are natural or transgenic animal models, but most do not recapitulate human disease, in part because of the genetic and environmental background upon which the genetic mutation operates (e.g., mouse gene background rather than human). These shortcomings are sometimes approached by investigating accessible human tissues such as blood leukocytes or skin fibroblasts—such tissues, however, are not necessarily of the kind affected by the disease in question. For example, we have shown that fibroblasts and lymphoblastoid cell lines do not show disease-specific mRNA expression profiles in schizophrenia [2].
Pluripotent stem cells, such as embryonic stem cells (ESCs) and induced pluripotent stem cells (iPSCs), are attractive candidates for modeling human diseases because of their ability to produce all cells of the body and thus generate the cell types affected by a specific disease. Embryonic stem cell lines have been derived from embryos after selection at preimplantation genetic diagnosis [3, 4]. Although very useful, ESCs are limited to modeling monogenic diseases caused by known mutations. These limitations can be overcome by generating induced pluripotent stem cells from patients with a known clinical history, a model that is not necessarily confined to patients with monogenic diseases. Recent reports demonstrate that iPSCs can be derived from skin fibroblasts from people with a variety of neurological conditions, including Parkinson disease, Huntington disease, Down syndrome [5], motor neuron disease [6], spinal muscular atrophy [7], and schizophrenia [8]. In most of these cases, when these iPSCs were differentiated into cells of interest, they showed functional alterations consistent with the disease studied.
Most neurological conditions probably arise from complex interplays between the environment and multiple genes with subtle cellular effects that collectively lead to pathological changes. A major question is whether iPSCs can be useful models of complex diseases, particularly when there is an undefined genetic component, such as in idiopathic Parkinson disease [9]. Therefore, modeling complex diseases of unknown etiology will require comparison of cell lines from multiple patients and controls so as to identify disease-specific attributes that are independent of individual differences. Sources of variability in these studies include genetic and epigenetic variability, factors associated with the source of cells used, and the many variables associated with generation and sustained growth of iPSCs. A major challenge for the field is to overcome technical issues that may increase individual cell line variability and thereby confound our ability to distinguish disease-associated variability [10, 11].
To determine variability in the generation, selection, and characterization of iPSC lines, we derived 18 iPSC lines, which originated from eight individuals. Each cell line was characterized for pluripotency using cell surface markers and gene expression, teratoma formation, and global gene expression. For comparison, a human embryonic stem cell (hESC) line was analyzed in parallel.
Materials and Methods
Reprogramming
Primary fibroblasts were collected from dermal punch biopsies from four patients with schizophrenia and from four healthy control participants, as described [12], with the informed consent of the participants. Fibroblasts were cultured in Dulbecco's modified Eagle's medium (DMEM), with 15% fetal calf serum (FCS) and transduced with lentiviral constructs carrying Oct4/IRES/Sox2 and Klf4/IRES/cMYC. After viral transduction, >50,000 fibroblasts were allowed to recover for between 24 and 48 hours before being transferred to mouse embryonic fibroblast (MEF) feeder plates (36,000 cells per cm2). Transduced fibroblasts were weaned from DMEM with 15% FCS to 100% hESC culture medium over a period of 4 days, at 25% per day. iPSC colonies were picked after 3 and 5 weeks culture and subcultured clonally on MEFs in organ culture dishes. Clones were initially screened for expression of TRA-1-60 and Hoechst dye efflux, transgene persistence by reverse transcription-polymerase chain reaction (PCR), and karyotype stability via G-band analysis by a commercial genotyping service (>15 metaphases analyzed per sample). In accordance with a recent attempt to standardize nomenclature across hESCs and iPSCs [13], we have named the lines GU0001i-cont1, where GU refers to the institution in which they originated (Griffith University), the subsequent four-digit number refers to the cell line identification number, i denotes iPSC origin, followed by a hyphen and the disease status of the cell, and finally the clone number. All procedures were in accordance with National Health and Medical Research Council Code of Practice for Human Experimentation and were approved by the Griffith University Human Experimentation Ethics Committee.
Cell Culture
Established iPSC lines were grown on a monolayer of MEFs (12,000 cells per cm2) in hESC medium containing DMEM/F12 with 20% knockout serum replacement (KSR), 2 mM GlutaMAX-1, 1× nonessential amino acids, 0.1 mM β-mercaptoethanol, 1× penicillin/streptomycin (all from Invitrogen, Carlsbad, CA, http://www.invitrogen.com) and 50 ng/ml basic fibroblast growth factor (Millipore, Billerica, MA, http://www.millipore.com).
All the cell lines were fully characterized by flow cytometry, PCR (endogenous gene expression and transgene silencing), karyotyping, and teratoma assays. The PCR and the teratoma assays were performed commercially (StemCore Facility, Brisbane, QLD, Australia). The karyotyping was performed commercially (Sullivan Nicolaides Pathology, Brisbane, QLD, Australia, http://www.snp.com.au).
PCR
RNA was extracted from cells grown in bulk culture format using TRIsol RNA extraction reagent (Invitrogen). cDNA was synthesized using the Bioline (Alexandria, NSW, Australia, http://www.bioline.com/h_au.asp) cDNA synthesis kit using 1 μg of RNA in a 20-μl reaction. Synthesis was undertaken at 40°C for 45 minutes. The product was then diluted 1:10 in distilled H2O. PCR was performed using the DNA polymerase Bioline MangoMix following the manufacturer's instructions with an annealing temperature of 62°C and 35 cycles. Primers specific to endogenous genes were as follows: OCT4 (forward: AGTTTGTGCCAGGGTTTTTG; reverse: ACTTCACCTTCCCTCCAACC), SOX2 (forward: GGGAAATGGGAGGGGTGCAAAAGAGG; reverse: TTGCGTGAGTGTGGATGGGATTGGTG), KLF4 (forward: TGATTGTAGTGCTTTCTGGCTGGGCTCC; reverse: ACGATCGTGGCCCCGGAAAAGGACC), and GAPDH (forward: ACAGTCAGCCGCATCTTCTT; reverse: ACGACCAAATCCGTTGACTC). Primers specific to transgenes were as follows: OCT4 (forward: AGTGAGAGGCAACCTGGAGA; reverse: AGGAACTGCTTCCTTCACGA), SOX2 (forward: TGGCTCTCCTCAAGCGTATT; reverse: GCTTAGCCTCGTCGATGAAC), KLF4 (forward: GTTCCTGCATGCCAGAGGAG; reverse: AGGAACTGCTTCCTTCACGA), cMYC (forward: TGGCTCTCCTCAAGCGTATT; reverse: CTGGTAGAAGTTCTCCTCCTCG), and GAPDH (forward: GTGGACCTGACCTGCCGTCT; reverse: GGAGGAGTGGGTGTCGCTGT).
Flow Cytometry
Immunostaining was performed as described previously [12]. Briefly, iPSCs were washed with phosphate-buffered saline (PBS), fixed in paraformaldehyde (4% in Hanks' balanced saline solution [HBSS]; Gibco, Grand Island, NY, http://www.invitrogen.com) for 10 minutes at room temperature (RT), washed in HBSS, and incubated with primary antibodies as follows: Oct4 (AB3209; Chemicon, Billerica, MA, http://www.chemicon.com), 1:200; Sox2 (IC2018A; R&D Systems Inc., Minneapolis, MN, http://www.rndsystems.com), 1:20; Nanog (catalog no. 4893; Cell Signaling Technology, Arundel, QLD, Australia, http://www.cellsignal.com), 1:400; stage-specific embryonic antigen-4 (SSEA4) (catalog no. 4755; Cell Signaling Technology), 1:150; and TRA-1-60 (FCMAB115F; Millipore), 1:100. The cells were then washed and incubated in the following secondary antibodies: Alexa 488 goat anti-mouse and anti-rabbit (Invitrogen, Mulgrave, VIC, Australia, http://www.invitrogen.com). Cells were analyzed by flow cytometry (FACSAria flow cytometer; BD Biosciences, San Diego, CA, http://www.bdbiosciences.com). Isotype-matched controls were run in parallel for all antibodies. Cells were considered immunopositive if their fluorescence was above that of the most fluorescent cells in the isotype control sample.
Immunocytochemistry
iPSC clones were grown on Matrigel (BD Biosciences)-coated chamber slides (LabTech; Thermo Fisher Scientific Australia, Scoresby, VIC, Australia, http://www.thermofisher.com.au) for 3 days, washed with PBS, and fixed with cold ethanol at −20°C for 15 minutes. After the cells were air-dried, they were blocked with hESC medium for 1 hour at RT and incubated with primary antibody in hESC medium at 4°C overnight: TRA-1-60 (MAB4360; Millipore), 1:200; or SSEA4 (MAB4304; Millipore), 1:200. Then the cells were washed and incubated with secondary antibody in hESC medium for 1 hour at RT. The cells were washed and incubated with Hoechst (0.1 μg/ml) at RT for 5 minutes, washed, and visualized under a BX51 fluorescent microscope (Olympus Australia, Mount Waverley, VIC, Australia, http://www.olympus-global.com).
Teratoma Assay
All mouse procedures were conducted under local ethical guidelines and after gaining permission from the local animal ethics committee (StemCore Facility). The mice were CB17-SCID mice sourced from the Animal Resource Centre (Canning Vale, WA, Australia). Human iPSCs were grown to near confluence, harvested using collagenase IV treatment, washed in DMEM/F12, and resuspended in DMEM/F12 supplemented with 30% Matrigel. Methoxyflurane-anesthetized mice were intramuscularly injected in the hind leg with 50 μl of approximately 1 × 10⁶ cells at one site only. Prior to teratoma removal, mice were killed by cervical dislocation. Teratomas were surgically removed, fixed in 10% formalin, and embedded in paraffin. Sections were mounted onto slides, stained with hematoxylin and eosin, and examined by an independent pathologist for the presence of representatives of the three germ layers.
Gene Expression Profiling
Gene expression profiling was performed as previously described [14]. Briefly, 500 ng of total RNA was converted to biotinylated cRNA using Illumina TotalPrep RNA amplification kit (AMIL1791; Invitrogen) (as per the manufacturer's instructions) and hybridized to HumanHT-12 v4 BeadChip (Illumina, BD-103-0204 Country). The raw data were subjected to background adjustment and quantile normalization using the lumi package in R/BioConductor (http://www.bioconductor.org) [15]. Genes were filtered using Illumina detection score, and a probe was included in further analysis if it had a detection score ≥0.99. Cell line expression patterns were investigated using principal component analysis. Differential expression was determined by an analysis of variance, and microarray data were deposited into ArrayExpress (accession number E-MTAB-1040).
Results
Characterization of Multiple iPSC Lines
To evaluate variability in the establishment of iPSC lines and to assess their utility for the development of future cellular models of disease, fibroblasts from eight individuals were reprogrammed. From the eight donors, four were healthy controls (cont) and four were schizophrenic (sz). All the donors were males with ages ranging from 21 to 51, and both groups (cont and sz) were age matched. Primary fibroblasts were reprogrammed using lentivirus expressing OCT4, SOX2, KLF4, and cMYC. To evaluate the effect of individual genetic backgrounds in the establishment of iPSC lines, one to three clones were generated from each donor (Table 1), giving a total of 18 new cell lines. All iPSC lines showed the typical morphology of human ESCs, normal karyotype (except for GU9569i-cont, discussed below) and expressed all or most endogenous pluripotency markers (OCT4, SOX2, KLF4, NANOG, SSEA4, and TRA-1-60), as assessed by PCR and flow cytometry (Fig. 1A, 1B, 1C, 1E; Table 1; supplemental online Fig. 1B–1D). The parental cell lines (fibroblasts) did not express pluripotency markers (data not shown). All the cell lines showed self-renewal capacity and were cultured for up to 50 passages. DNA profiling analysis (short-tandem repeat analysis of 18 common loci) confirmed that all the clones were derived from their corresponding parental line (data not shown). Of the 18 iPSC lines, 11 formed teratomas, 3 did not, 2 formed ectoderm only, 1 formed endoderm and ectoderm, and 1 formed mesoderm and ectoderm (Table 1; Fig. 1D; supplemental online Fig. 1E).
Table 1.
Summary chart of induced pluripotent stem cell line characterization
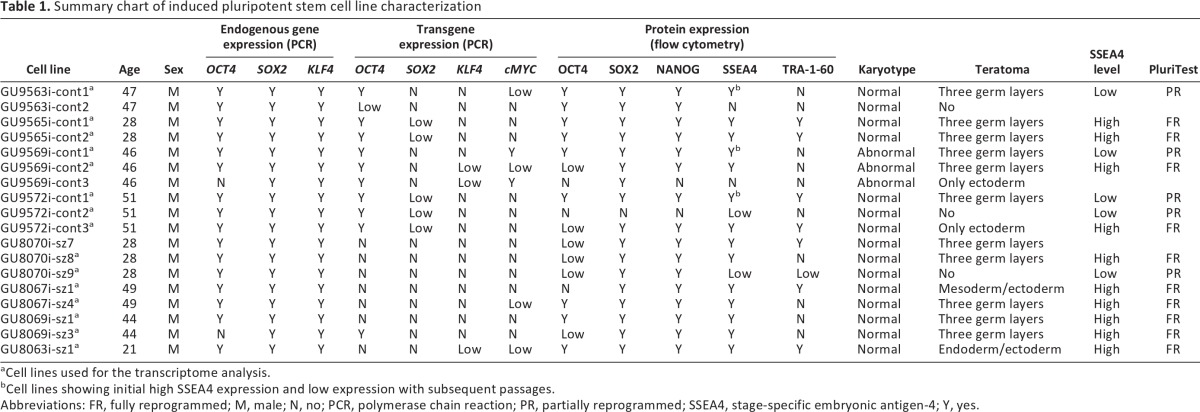
aCell lines used for the transcriptome analysis.
bCell lines showing initial high SSEA4 expression and low expression with subsequent passages.
Abbreviations: FR, fully reprogrammed; M, male; N, no; PCR, polymerase chain reaction; PR, partially reprogrammed; SSEA4, stage-specific embryonic antigen-4; Y, yes.
Figure 1.

Characterization of induced pluripotent stem cell (iPSC) lines: representative pictures. (A): Polymerase chain reaction analysis of endogenous pluripotency markers SOX2 (151 bp), KLF4 (397 bp; lower band corresponds to primer dimers), OCT4 (144 bp), and GAPDH (94 bp). (B): Phase image and SSEA4/DAPI staining of iPSC colony. Magnification, ×40. (C): Normal karyotype. (D): Hematoxylin and eosin staining of a teratoma showing differentiation into ectoderm, mesoderm, and endoderm. (E): Flow cytometry analysis for pluripotency markers OCT4, SOX2, NANOG, SSEA4, and TRA1-60. Abbreviations: DAPI, 4′,6-diamidino-2-phenylindole; GAPDH, glyceraldehyde-3-phosphate dehydrogenase; SSEA4, stage-specific embryonic antigen-4.
In 2008, Maherali and Hochedlinger proposed a minimum set of criteria that should be fulfilled in order to consider an induced pluripotent cell a true pluripotent cell [16]. These are morphological resemblance to ESCs and self-renewal, expression of pluripotency genes and downregulation of genes specific to the cell of origin, transgene silencing, and proof of functional differentiation through teratoma formation [16]. If we analyze our cells according to these criteria, we can conclude that 11 cell lines can be considered true iPSCs (Table 1, all of those showing teratoma formation into three germ layers). However, we observed that in 7 of 11 cell lines, the OCT4 transgene was not completely silenced (GU9563i-cont1, GU9565i-cont clones 1 and 2, GU9569i-cont clones 1 and 2, GU9572i-cont1, and GU8069i-sz3) (Table 1; supplemental online Fig. 1A). In addition, one cell line (GU8069i-sz3) did not show endogenous OCT4 gene expression. Nevertheless, all these cell lines passed the most stringent test for pluripotency, teratoma formation.
All the cell lines analyzed showed normal karyotype except for the three clones of donor GU9569i-cont. Interestingly, the three clones presented the same abnormal karyotype, a balanced reciprocal translocation involving chromosomes 9 and 12, and a pericentric inversion in one chromosome 20. When the fibroblasts used to generate this cell line were karyotyped as well, they showed that 53% of the cells had this abnormality, 32% had a translocation involving chromosomes 1 and 2, and that only 15% were normal (supplemental online Fig. 1D). These results show that the abnormal karyotype observed in these clones is not due to the reprogramming method but was already present in the parental cell line.
During the expansion period an interesting phenomenon occurred in three cell lines, GU9563i-cont1, GU9569i-cont1, and GU9572i-cont1: with increased passage number (>20), the percentage of SSEA4-positive cells progressively decreased (Fig. 2). This group was defined as SSEA4-low. It is important to highlight that these cell lines were already considered true iPSCs, according to the Maherali and Hochedlinger criteria (Table 1) [16]. This phenomenon represented an obstacle for the next step, cell sorting of SSEA4-positive cells for genetic profile analysis. However, even though the percentage of positive cells was low, it was still possible to collect cells for analysis, since we selected only cells with fluorescence intensity greater than that of the isotype control. Figure 2 shows the flow cytometry profile and the passage number of the cell lines sorted for RNA extraction.
Figure 2.

Flow cytometry analysis of SSEA4 protein expression. SSEA4 protein levels were quantified at three different passages in three SSEA4-low induced pluripotent stem cell (iPSC) lines and one representative SSEA4-high iPSC line. The percentages of cells expressing the marker (gray) above the isotype-control cells (clear) are shown in the graph. *, Cells sorted for transcriptome analysis. Abbreviation: SSEA4, stage-specific embryonic antigen-4.
Gene Expression Analysis
We determined the gene expression profile of SSEA4-positive sorted cells for all the clones, their corresponding parental cell line, and an hESC line. The rationale behind the use of cells sorted for SSEA4 was to compare a pure population of pluripotent cells. There were 3 cell lines from the pool of 18 clones that were not included in the analysis. Two of those clones (GU9563i-cont2 and GU9569i-cont3) could not be included because they were negative for SSEA4 and therefore could not be sorted (Table 1), whereas GU8070i-sz7 was not included because its recovery after freezing was systematically poor, and the cell line was lost.
To investigate potential sources of variation, samples were visualized in a two-dimensional plot using the top two principal components, which explained 45% and 13% of the total variation, respectively (Fig. 3). The distance between the samples reflects the degree of similarity between the gene expression profiles. As expected, the fibroblasts clustered farther apart from iPSCs and hESCs, whereas iPSCs and hESCs clustered together in close proximity. However, the iPSCs clustered in two distinct groups; one group clustered with hESCs, whereas the other was separated on both principal components. Interestingly, the two groups could be distinguished on the basis of the proportion of SSEA4-positive cells. Independent cell lines derived from the same donor were included to assess the effect of individual genetic background. Clones derived from the same donor clustered together in the SSEA4-high group when analyzed by principal component (Fig. 3, each color represents a different donor). In addition, they showed a high correlation coefficient in their gene expression profile: GU9565i-cont1 p16 versus GU9565i-cont2 p18 and p22, r2 = 0.95 for both passage numbers; GU8067i-sz4 p28 versus GU8067i-sz1 p20, r2 = 0.92; GU8069i-cont3 p29 versus GU8069i-cont1 p19, r2 = 0.97. Different passage numbers of the same cell line also showed a high correlation: GU8078i-sz8 p34 versus p40, r2 = 0.95, and GU9565i-cont2 p18 versus p22, r2 = 0.93.
Figure 3.

Principal component analysis shows gene expression variability among different clones and cell types. Squares, fibroblasts; triangles, iPSC SSEA4-low; circles, iPSC SSEA4-high; diamonds, hESCs. Symbols of the same color indicate the same patient. Abbreviations: hESC, human embryonic stem cell; iPSC, induced pluripotent stem cell; PCA, principal component analysis; SSEA4, stage-specific embryonic antigen-4.
We further investigated the differences between the iPSC groups, which we have named SSEA4-high and SSEA4-low (referring to the proportion of SSEA4-positive cells, not to the mean fluorescence intensity of SSEA4 expression), based on the expression of common pluripotency markers (Fig. 4). Two of the markers, SOX2 and cMYC, had very similar expression patterns between SSEA4-high and SSEA4-low. In contrast, the levels of expression of OCT4 and NANOG were several orders of magnitude lower in the SSEA4-low group compared with the SSEA4-high group, whereas KLF4 had a scattered expression in both groups and in hESCs. Next we examined differences of the whole transcriptome between the two groups. We found 2,826 probes to be statistically significantly different, 952 enriched in SSEA4-high and 904 enriched in SSEA4-low (supplemental online Table 2). It is important to highlight that our cells were all grown under the same culture conditions used to maintain hESCs, were manually picked every three to four passages, and showed morphology indistinguishable from that of undifferentiated iPSCs (supplemental online Fig. 2). The only difference noted was that the colonies of the SSEA-low group did not grow in diameter as much as those of the SSEA-high group.
Figure 4.
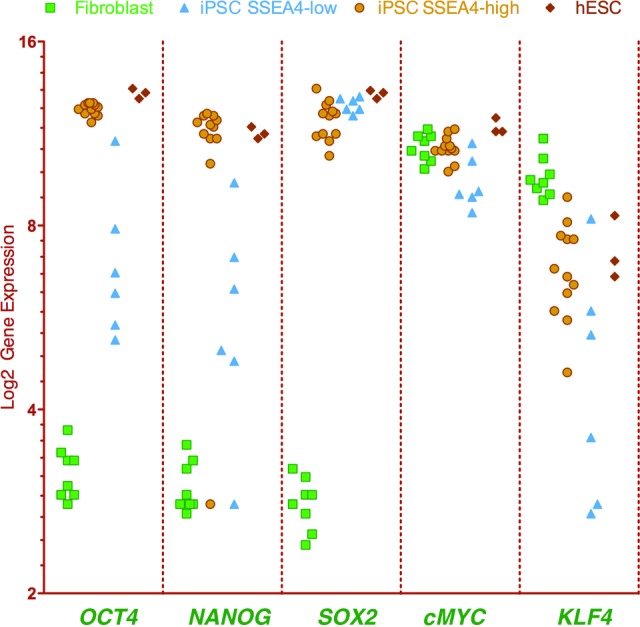
Gene expression levels of pluripotency markers (OCT4, NANOG, SOX2, cMYC, and KLF4) showing variability among different cell lines and cell types. Squares, fibroblasts; triangles, iPSC SSEA4-low; circles, iPSC SSEA4-high; diamonds, hESCs. Abbreviations: hESC, human embryonic stem cell; iPSC, induced pluripotent stem cell; SSEA4, stage-specific embryonic antigen-4.
In a recent paper, Müller et al. reported the creation of a microarray database known as the Stem Cell Matrix 2 [17]. This matrix contains profiles of multiple transcriptional profiles, including hESCs, iPSCs, and differentiated cells from many different laboratories, and can be used to predict the pluripotent state of a cell. This test, named the PluriTest, assesses the pluripotency of an unknown cell line on the basis of two different metagene models. The first, called pluripotency score, distinguishes pluripotent from nonpluripotent samples within the database, whereas the second, the novelty score, measures the technical and biological variations in the data set. When our samples were run on the PluriTest (Fig. 5), we found that SSEA4-high cell lines (Table 1) clustered at the red glow region (corresponding to fully reprogrammed pluripotent cells, similar to ESCs), whereas SSEA4-low cell lines (Table 1) were distributed in the middle area, indicating that they were partially reprogrammed cells. The fibroblasts, on the other hand, clustered at the blue glow area that corresponds to somatic cells (e.g., astrocytes, also shown). Müller et al. proposed that the PluriTest could be used to avoid the time-consuming and resource-intensive teratoma assay [17]. However, we need to highlight that in this report we found three cell lines that proved to be fully reprogrammed by the PluriTest but formed only one or two germ layers in the teratoma assay (Table 1).
Figure 5.

PluriTest output. The background encodes an empirical density map indicating pluripotency and novelty as indicated by the color bar. In the red area, corresponding to fully reprogrammed cells, cluster the iPSC SSEA4-high (yellow circles), hESCs (red circles), and iPSC data provided by Müller et al. [17] (green circles). In the middle area, corresponding to partially reprogrammed cells, are the iPSC SSEA4-low (dark blue circles). Fibroblasts (light blue circles) and astrocytes (purple circle) cluster together at the area corresponding to somatic cells. Circles surrounded by a black line are the results of cell lines provided by Müller et al. [17]. Abbreviations: ESC, embryonic stem cell; iPSC, induced pluripotent stem cell; PSC, pluripotent stem cell; SSEA4, stage-specific embryonic antigen-4.
Our findings demonstrate instability of three cell lines that were initially defined as pluripotent cells: GU9563i-cont1, GU9569i-cont1, and GU9572i-cont1. These cell lines fulfilled the criteria required to be consider fully reprogrammed iPSCs and passed the most stringent test for pluripotency, teratoma formation. However, with increased passage number, their SSEA4 expression levels progressively decreased (Fig. 2). This correlated with the PluriTest results showing a partially reprogrammed status of these cell lines, indicating that they regressed to an early stage in the reprogramming time line.
Our results show that there were no obvious disease-associated differences in pluripotency and global gene expression between iPSCs from patients and controls. The pluripotency score, which measures the pluripotency status of a cell, considering the expression of 307 key genes, was highly similar between schizophrenia and control iPSCs (supplemental online Table 1): a t test comparing the pluripotency scores from the two groups showed no significant differences (p > .05), indicating that there was no segregation by disease status. Finally, schizophrenia and control iPSCs showed very similar genome-wide transcriptional profiles, as shown by the very high correlation coefficient (r2 = 0.92).
In the previous section we mentioned that gene expression correlation analysis was very high between clones generated from the same donor. In the same manner, the PluriTest showed that the novelty scores, which measure biological variations, were highly similar between clones (supplemental online Table 1), given the fact that they cluster in the same group (SSEA4-high or SSEA4-low). These two tests confirm the low variability between clones.
Discussion
This study was undertaken to determine the variability in iPSC lines derived from different individuals with the aim of determining criteria for selecting iPSC lines for disease models. We derived 18 iPSC lines from eight individuals via lentiviral transduction of fibroblasts. All the cell lines were selected initially for their morphology (high nucleus-to-cytoplasm ratio) and TRA-1-60 expression by live staining, at week 4 or 5 after transduction. These clones were subsequently expanded for extensive analysis. All the cell lines had a morphology and pluripotency phenotype defining them as iPSCs, except for GU9563i-cont2, GU9569i-cont3, GU9572i-cont2, and GU8070i-cont9, for which the results for expression of pluripotency markers were inconclusive. Further analysis of these cell lines demonstrated them to be nonpluripotent by their inability to form three germ layers in the teratoma assay. Although all cell lines had a morphology and pluripotency phenotype defining them as iPSCs, only 11 were pluripotent according to the teratoma assay, considered the hallmark of pluripotency tests. Among the 18 cell lines there was variation in endogenous pluripotency gene expression, transgene expression, and protein expression, with differences between individuals and between clones from the same individuals. These varied even among the 11 cell lines that formed teratomas. Using gene expression profiling to classify the cells, we identified a group of partially reprogrammed cells in which the colonies had a low percentage of cells with SSEA4 expression. All cell lines were karyotypically normal, except those from one individual, whose parental fibroblasts were subsequently found to have the same abnormality. We conclude that there are many potential sources of variability in the production and selection of representative iPSC clones that may have an impact on the ability to identify disease-associated differences in donor-derived iPSC lines. It is therefore necessary to use multiple factors to select individual iPSC clones for comparison and may be necessary to confirm that all clones are in a similar stable state before making disease-based comparisons.
Variation Among iPSC Lines
In terms of variability in the generation of iPSC lines there are three main issues to consider: (a) variability in the criteria that define iPSC lines as pluripotent cells, (b) cell line variability due to different genetic backgrounds, and (c) clone variability due to the stochastic nature of the reprogramming method.
The criteria to define iPSCs are not as linear as one might assume. Recently, another study compared 16 iPSC lines [10]. These cell lines expressed mRNA for markers of pluripotency (alkaline phosphatase, NANOG, OCT4, SSEA3, SSEA4, TRA-1-60, TRA-1-80) and formed three germ layers in vitro, suggesting these were fully reprogrammed iPSC lines. However, from this pool, two failed the teratoma assay, four failed the flow cytometric analysis for TRA-1-60 and SSEA3, and three failed the cell cycle assay for similarity to embryonic stem cells. Consequently, of the 16 cell lines, only 7 fulfilled all the criteria used to define iPSCs. These results, like our own, demonstrate the difficulty of applying a multifactorial set of criteria to define successfully reprogrammed iPSCs and the difficulty of defining a set of similar cell lines for interindividual or intergroup comparisons, as is necessary for disease modeling.
The 16 cell lines were then differentiated into neurons using standard protocols [10]. Some cells in all differentiated lines were immunopositive for neuronal markers but only 10 of 16 could be differentiated in two different laboratories, and only 4 of the 16 contained neurons defined by calcium imaging. Furthermore, only two contained neurons by patch-clamp electrophysiological criteria. In the end, after generation and analysis of 16 iPSC lines, the authors finished with only 2 that fulfilled all the criteria of being fully reprogrammed iPSCs that could generate functional neurons. Incidentally, these happened to be one cell line derived from a patient with amyotrophic lateral sclerosis and one healthy control. This is not to criticize the rigor of the analysis but rather to highlight the difficulties in generating a matched set of iPSCs from different individuals. The results of the present study support this conclusion. This may not be a problem for disease models if the effect size is large and if it is expressed in the cell type under examination, but it is an important issue if one wishes to compare patient versus control iPSCs in multigene disorders of unknown etiology.
To assess variability due to different genetic backgrounds, we analyzed fully reprogrammed iPSC lines from eight donors. We found no differences in their global transcriptome expression levels by principal component analysis. The correlation coefficient among the different cell lines in the SSEA4-high group was very high (r2 = 0.92). This high correlation is particularly important when using iPSCs to study complex genetic diseases such as schizophrenia. Defining a “ground state” before assessing disease phenotypes will ensure that the differences observed are due to the disease and not to the donor-to-donor variation. Our result indicates that even when iPSCs came from donors with different genetic backgrounds and disease states, as a group their gene expression was highly similar. There is no significant disease-associated variability in the generation of iPSCs and their pluripotency. Hence, iPSCs from schizophrenia patients and healthy controls are similar in their global gene expression and pluripotency status. Given this ground state similarity of iPSCs within individuals (clones), between individuals, and within and between disease-status groups, they can now be used to identify more subtle disease-associated differences in cell biology.
In order to create a pool of iPSC lines that are representative of a disease, multiple patients and controls need to be compared in order to accommodate individual differences and experimental variability. The number of iPSCs required to detect disease-associated differences in cell biology will depend on the size of the differences and the variability between iPSC lines. Our study contributes 11 new iPSC lines to the study of schizophrenia [18].
Another potential source of variation comes from the interclone variability. After selecting for fully reprogrammed iPSCs, interclonal variability was low, as demonstrated by the principal component analysis, which compared global transcriptome expression levels of different clones from each patient. In this analysis, clones from the same patient clustered together, demonstrating a high degree of similarity. It is interesting to note that the reprogramming method, presumed to be stochastic in nature, does not affect their global gene expression profile, as shown by the high correlation coefficients between clones and between iPSCs from different individuals.
Partial Reprogramming and Reprogramming Stability
The reprogramming of a somatic cell to a pluripotent cell is thought to be a stochastic process [19, 20]. It has been shown that along this reprogramming route, there are different tangents where iPSCs can stray from the “golden reprogramming path,” leading them to trapped stages of dedifferentiation [21]. It is not unlikely that inappropriate expression of the reprogramming factors at critical points along this reprogramming trajectory may increase the likelihood that a cell may end up trapped in a partially reprogrammed state. On rare occasions, these partially reprogrammed cells can spontaneously convert to fully reprogrammed cells [19] or be pushed to fully reprogrammed cells with epigenetic modifiers such as valproic acid [22]. However, the reverse case of a fully reprogrammed iPSC regressing to a partially reprogrammed state has not been reported. Our study shows that this is also possible (Fig. 6). Three cell lines (GU9563i-cont1, GU9569i-cont1, and GU9572i-cont1) showed initial expression of pluripotency markers by flow cytometry and PCR, and passed the teratoma assay. However, after subsequent passages they progressively lost the pluripotency cell surface marker SSEA4 and when analyzed by gene expression (PluriTest) clustered as partially reprogrammed cells. This suggests that over the culturing time, they regressed to a partially reprogrammed stage. On the basis of this observation, we propose that iPSC lines may need to be rechecked for pluripotency periodically. In addition, in line with a partially reprogrammed state, the SSEA4-low cells showed incomplete expression of the OCT4, NANOG, and KLF4 genes, together with a deregulation of 25% of the PluriNet genes (65 genes downregulated and 5 genes upregulated) (supplemental online Table 2).
Figure 6.
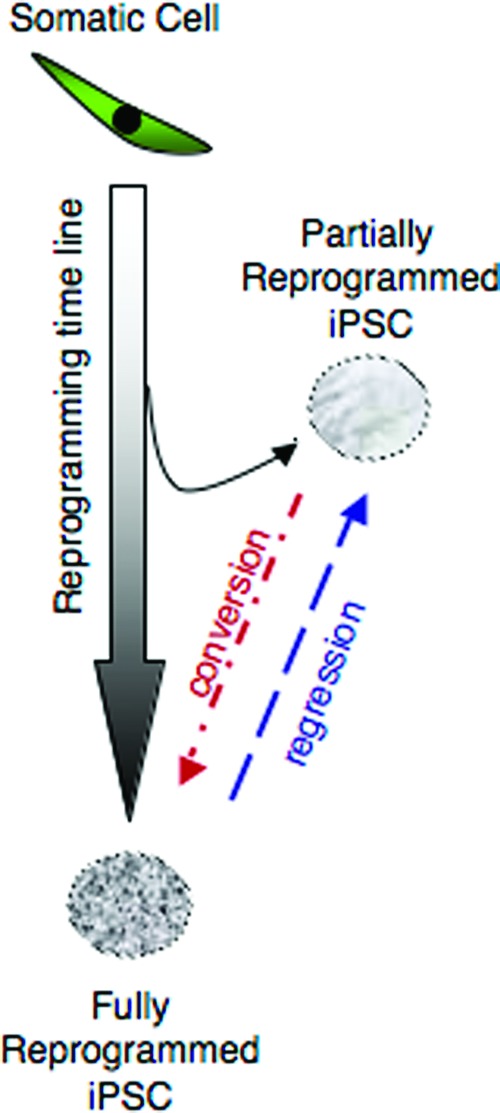
Diagram representing different outcomes of reprogramming progression for the generation of iPSC lines. The success of generating iPSCs depends on the appropriate progression through the reprogramming path from a somatic cell to the fully reprogrammed iPSC. Some cells will deviate from this path, reaching only a partially reprogrammed state. However, these cells may convert subsequently to the fully reprogrammed state. Our results demonstrated the converse, that fully reprogrammed iPSCs can regress to the partially reprogrammed state, even after previously fulfilling stringent definitions of pluripotency, including teratoma formation. Abbreviation: iPSC, induced pluripotent stem cell.
Chan et al. [19] reported that even though it is rare, a spontaneous conversion of a partially to a fully reprogrammed cell is possible. That was not the case in our study; the cells could not be converted to a fully reprogrammed state even by several rounds of manual picking.
SSEA4 has been used as an early predictor of pluripotency at early characterization stages of iPSC derivation [19]. On the basis of this observation, we used SSEA4 to select a pure population of pluripotent stem cells for gene expression analysis. However, we found a group of iPSCs with a low percentage of cells expressing SSEA4 protein (<20%). These cell lines proved to be partially reprogrammed, even though at the start of the characterization they could be defined as fully reprogrammed. Our results suggest that a useful indicator of pluripotency in iPSC colonies is a high percentage of cells positive for SSEA4. This correlates with high levels of expression of OCT4 and NANOG. Our results further suggest that the levels of expression of OCT4 and NANOG are more indicative of the fully reprogrammed state than the expression levels of SOX2 and cMYC, as confirmed by the PluriTest. This is consistent with studies showing that OCT4 and NANOG are core components of the pluripotency network [23].
Conclusion
In deriving iPSC lines as models for disorders affecting the brain, there remains a challenge for the iPSC field in general, namely, defining the pluripotency state of an individual cell line [16, 24, 25]. iPSC lines have inherent variability relating to the fibroblasts from which they are derived (e.g., karyotype, disease, genetic background), as well as variability imposed by the reprogramming process. In this report we have identified iPSC lines that can fulfill stringent criteria for defining pluripotency, such as teratoma assay and the PluriTest, but still differ on other criteria, such as transgene expression or pluripotency marker expression. This suggests that there are no shortcuts to defining pluripotency, and the analysis should be thorough. The PluriTest proves to be an effective test that should be included when assessing pluripotency. However, with our results, we cannot say this test should be used instead of the teratoma assay.
For disease modeling, it will be essential to assess a large number of iPSC lines that are relatively homogeneous and representative of the disease, as well as a similar number from healthy controls, to capture the biological variability of these populations and the differences between them. This may be more important for complex genetic diseases than for monogenic diseases, but in either case, differences between individuals must be distinguished from disease-associated differences. The concept behind iPSCs as disease models is to take somatic cells back to a ground state (the iPSC state) and then look for emergent disease-specific phenotypes as the cells are differentiated. This concept is straightforward, but care is needed to reduce the many sources of variability that may be introduced by the iPSC reprogramming procedure. It will be necessary to generate individual iPSCs such that patient and control cells are as similar as possible in their ground state in order to identify disease-associated variability above individual genetic/epigenetic and cell line variability. Our study shows that the cell lines under study are fully reprogrammed (iPSC SSEA4-high), pass the PluriTest, and cluster together by principal component analysis without showing segregation by disease, indicating low variability among donors and clones. These cell lines can be used now to investigate disease-specific questions.
Acknowledgments
This work was supported by grants to the National Centre for Adult Stem Cell Research from the Australian Stem Cell Centre (to A.M.V., E.J.W., and A.M.-S.) and the Australian Government Department of Health and Aging (to A.M.-S.). We thank the Stem Core Facility at the University of Queensland for PCR and teratoma assay services, Ross Brookwell from Sullivan Nicolaides Pathology for the karyotypes, and Shane Wilson for proofreading.
Author Contributions
A.M.V.: conception and design, administrative support, collection and/or assembly of data, data analysis and interpretation, manuscript writing, final approval of manuscript; N.A.M.: collection and/or assembly of data, data analysis and interpretation, final approval of manuscript; S.R. and B.B.: collection and/or assembly of data, final approval of manuscript; S.A.W.: conception and design, financial support, data analysis and interpretation, final approval of manuscript; E.J.W.: conception and design, financial support, administrative support, data analysis and interpretation, final approval of manuscript; A.M.-S.: conception and design, financial support, administrative support, provision of study material or patients, data analysis and interpretation, manuscript writing, final approval of manuscript.
Disclosure of Potential Conflicts of Interest
The authors indicate no potential conflicts of interest.
References
- 1.Vitale AM, Wolvetang E, Mackay-Sim A. Induced pluripotent stem cells: A new technology to study human diseases. Int J Biochem Cell Biol. 2011;43:843–846. doi: 10.1016/j.biocel.2011.03.013. [DOI] [PubMed] [Google Scholar]
- 2.Matigian NA, McCurdy RD, Feron F, et al. Fibroblast and lymphoblast gene expression profiles in schizophrenia: Are non-neural cells informative? PLoS One. 2008;3:e2412. doi: 10.1371/journal.pone.0002412. [DOI] [PMC free article] [PubMed] [Google Scholar]
- 3.Frumkin T, Malcov M, Telias M, et al. Human embryonic stem cells carrying mutations for severe genetic disorders. In Vitro Cell Dev Biol Anim. 2010;46:327–336. doi: 10.1007/s11626-010-9275-5. [DOI] [PubMed] [Google Scholar]
- 4.Pickering SJ, Minger SL, Patel M, et al. Generation of a human embryonic stem cell line encoding the cystic fibrosis mutation deltaF508, using preimplantation genetic diagnosis. Reprod Biomed Online. 2005;10:390–397. doi: 10.1016/s1472-6483(10)61801-9. [DOI] [PubMed] [Google Scholar]
- 5.Park IH, Arora N, Huo H, et al. Disease-specific induced pluripotent stem cells. Cell. 2008;134:877–886. doi: 10.1016/j.cell.2008.07.041. [DOI] [PMC free article] [PubMed] [Google Scholar]
- 6.Dimos JT, Rodolfa KT, Niakan KK, et al. Induced pluripotent stem cells generated from patients with ALS can be differentiated into motor neurons. Science. 2008;321:1218–1221. doi: 10.1126/science.1158799. [DOI] [PubMed] [Google Scholar]
- 7.Ebert AD, Yu J, Rose FF, Jr., et al. Induced pluripotent stem cells from a spinal muscular atrophy patient. Nature. 2009;457:277–280. doi: 10.1038/nature07677. [DOI] [PMC free article] [PubMed] [Google Scholar]
- 8.Brennand KJ, Simone A, Jou J, et al. Modeling schizophrenia using human induced pluripotent stem cells. Nature. 2011;473:221–225. doi: 10.1038/nature09915. [DOI] [PMC free article] [PubMed] [Google Scholar]
- 9.Soldner F, Hockemeyer D, Beard C, et al. Parkinson's disease patient-derived induced pluripotent stem cells free of viral reprogramming factors. Cell. 2009;136:964–977. doi: 10.1016/j.cell.2009.02.013. [DOI] [PMC free article] [PubMed] [Google Scholar]
- 10.Boulting GL, Kiskinis E, Croft GF, et al. A functionally characterized test set of human induced pluripotent stem cells. Nat Biotechnol. 2011;29:279–286. doi: 10.1038/nbt.1783. [DOI] [PMC free article] [PubMed] [Google Scholar]
- 11.Saha K, Jaenisch R. Technical challenges in using human induced pluripotent stem cells to model disease. Cell Stem Cell. 2009;5:584–595. doi: 10.1016/j.stem.2009.11.009. [DOI] [PMC free article] [PubMed] [Google Scholar]
- 12.Matigian N, Abrahamsen G, Sutharsan R, et al. Disease-specific, neurosphere-derived cells as models for brain disorders. Dis Model Mech. 2010;3:785–798. doi: 10.1242/dmm.005447. [DOI] [PubMed] [Google Scholar]
- 13.Luong MX, Auerbach J, Crook JM, et al. A call for standardized naming and reporting of human ESC and iPSC lines. Cell Stem Cell. 2011;8:357–359. doi: 10.1016/j.stem.2011.03.002. [DOI] [PubMed] [Google Scholar]
- 14.Cook AL, Vitale AM, Ravishankar S, et al. NRF2 activation restores disease related metabolic deficiencies in olfactory neurosphere-derived cells from patients with sporadic Parkinson's disease. PLoS One. 2011;6:e21907. doi: 10.1371/journal.pone.0021907. [DOI] [PMC free article] [PubMed] [Google Scholar]
- 15.Du P, Kibbe WA, Lin SM. Lumi: A pipeline for processing Illumina microarray. Bioinformatics. 2008;24:1547–1548. doi: 10.1093/bioinformatics/btn224. [DOI] [PubMed] [Google Scholar]
- 16.Maherali N, Hochedlinger K. Guidelines and techniques for the generation of induced pluripotent stem cells. Cell Stem Cell. 2008;3:595–605. doi: 10.1016/j.stem.2008.11.008. [DOI] [PubMed] [Google Scholar]
- 17.Müller FJ, Schuldt BM, Williams R, et al. A bioinformatic assay for pluripotency in human cells. Nat Methods. 2011;8:315–317. doi: 10.1038/nmeth.1580. [DOI] [PMC free article] [PubMed] [Google Scholar]
- 18.Brennand KJ, Gage FH. Concise review: The promise of human induced pluripotent stem cell-based studies of schizophrenia. Stem Cells. 2011;29:1915–1922. doi: 10.1002/stem.762. [DOI] [PMC free article] [PubMed] [Google Scholar]
- 19.Chan EM, Ratanasirintrawoot S, Park IH, et al. Live cell imaging distinguishes bona fide human iPS cells from partially reprogrammed cells. Nat Biotechnol. 2009;27:1033–1037. doi: 10.1038/nbt.1580. [DOI] [PubMed] [Google Scholar]
- 20.Yamanaka S. Elite and stochastic models for induced pluripotent stem cell generation. Nature. 2009;460:49–52. doi: 10.1038/nature08180. [DOI] [PubMed] [Google Scholar]
- 21.Subramanyam D, Blelloch R. Watching reprogramming in real time. Nat Biotechnol. 2009;27:997–998. doi: 10.1038/nbt1109-997. [DOI] [PubMed] [Google Scholar]
- 22.Hochedlinger K, Plath K. Epigenetic reprogramming and induced pluripotency. Development. 2009;136:509–523. doi: 10.1242/dev.020867. [DOI] [PMC free article] [PubMed] [Google Scholar]
- 23.Boyer LA, Lee TI, Cole MF, et al. Core transcriptional regulatory circuitry in human embryonic stem cells. Cell. 2005;122:947–956. doi: 10.1016/j.cell.2005.08.020. [DOI] [PMC free article] [PubMed] [Google Scholar]
- 24.Sipp D. Gold standards in the diamond age: The commodification of pluripotency. Cell Stem Cell. 2009;5:360–363. doi: 10.1016/j.stem.2009.09.005. [DOI] [PubMed] [Google Scholar]
- 25.Daley GQ, Lensch MW, Jaenisch R, et al. Broader implications of defining standards for the pluripotency of iPSCs. Cell Stem Cell. 2009;4:200–201. doi: 10.1016/j.stem.2009.02.009. author reply 202. [DOI] [PubMed] [Google Scholar]