Recent genome-wide association studies (GWAS) have identified common genetic risk variants for chronic lymphocytic leukemia (CLL).1–3 Testing SNPs individually for an association in GWAS necessitates the imposition of a very stringent P value to address multiple testing. While this reduces false positives, it may result in true associations being missed. Thus, any overall estimate of the total heritability that is, the proportion of the CLL risk ascribable to genetic variation, will be negatively biased. An alternative approach is to fit all the SNPs simultaneously providing an unbiased estimate of the heritability explained by all SNPs.4
We have applied this methodology to a GWAS of CLL. Briefly, 517 CLL cases were genotyped using HumanCNV370-Duo BeadChips (Illumina).1,2 For controls, we made use of Hap1.2M-Duo Custom array data generated on 2,930 individuals from Wellcome Trust Case-Control Consortium 2 (WTCCC2).5 We excluded samples with call rates below 90%, non-European background and cryptic relatedness assessed by estimation of identity by descent, along with SNPs having call rate below 95%, minor allele frequency (MAF) less than 1% in cases and controls, and evidence of departure from Hardy-Weinberg equilibrium (P<10–5 cases; P<0.05 controls). Performing a differential missingness test between cases and controls we excluded those SNPs with P<0.05. In addition, using PLINK6 we excluded individuals having a relatedness score over 0.05. This filtering resulted in 238,870 SNPs used for the analysis. A total of 63 samples were removed during quality control.
We estimated heritability using the methodology of Yang et al.7 and Lee et al.4 Briefly, the method fits a linear mixed model of the form: y=μ+g+e where y is the vector of disease status, μ is the mean vector, g is a vector of random additive genetic effects obtained from SNP data, and e is a vector of residual effects. The covariance structure fitted in the data is the individual relationship estimated from the SNPs, defined by:
where Ajk is the genetic relationship between individuals, j and k derived from the SNPs, σ2g is the additive genetic variance and σ2e is the residual variance. Under this model, disease heritability, h20 is defined by:
The estimate of variance explained by the SNPs on the observed 0–1 scale is linearly transformed to that on the unobserved continuous liability scale such that where K is the prevalence of the disease and z is the value of the standard normal probability density function at the threshold t. Using data from the SEER registry we set the prevalence of CLL to be 1 in 2,700. Estimation of the additive genetic variance was performed using restricted maximum likelihood via genome-wide complex trait analysis (GCTA) software.8 We followed the procedure of Yang et al.7 to adjust the crude heritability estimate,h=1, to account for missing LD between the genotyped SNPs and unknown causal variants. SNPs were randomly assigned into two groups with one of the groups being treated as representing ‘true’ causal variants. As advocated, we calibrated the prediction error using data on SNPs representing causal variants having MAF below 0.1.7
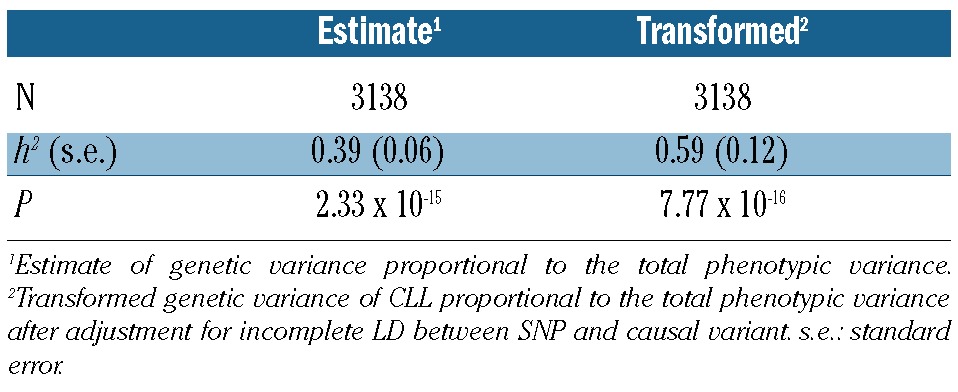
After transforming the data to account for disease prevalence, incomplete LD and ascertainment on the liability scale, the variance explained by all SNPs was 0.59 (95% CI: 0.35–0.83) (Table 1). The familial risk associated with CLL is amongst the highest of any cancer9 and our findings are compatible with polygenic susceptibility to CLL mediated through common SNPs in strong LD, with functional variants making a significant contribution to the heritable risk.
Table 1.
Estimated genetic variance of CLL explained by all SNPs.

The heritability we estimated is simply the additive variance as a proportion of the phenotypic variance and does not include non-additive genetic variance or gene-environment interactions. Although it is entirely possible that highly penetrant mutations for CLL may exist, linkage analysis of CLL families and mutational analysis of selected genes has so far not provided robust evidence for their existence. Similarly, part of the genetic variance could be mediated by a large number of rare disease-causing risk variants, although to date there is no reason to believe that the majority of the apparent missing genetic risk is solely explained by a restricted number of high-risk variants.
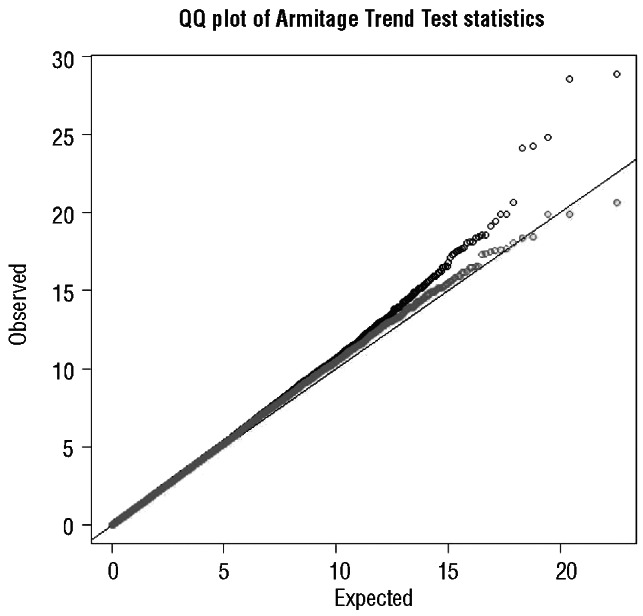
The receiver operator characteristic curve associated with the known common risk variants at 2q13, 2q37.1, 2q37.3, 6p25.3, 8q24.21, 11q24.1, 15q21.3, 15q23, 15q25.2, 16q24.1 and 19q13.32 is 0.67, thereby accounting for only approximately 5% of the total genetic variance.10 Predicated on the assumption of a polygenic basis to CLL, our heritability estimate suggests most of the genetic risk remains unexplained. While the existing SNPs have little diagnostic value given the probable polygenic basis to the familial risk of CLL, the harvesting of additional risk variants theoretically offers prospects for risk prediction based on profiling. The power of existing GWASs to identify common alleles conferring relative risks of 1.3 or greater (such as the 6p25.3 variant) is high. Hence, there may not be many additional SNPs with similar effects for alleles with frequencies greater than 0.3 in populations of European ancestry. In contrast, studies have had low power to detect alleles with smaller effects and/or MAF below 0.1. Evidence for the existence of additional risk variants for CLL is provided by Quantile-Quantile plots of observed and expected association test statistics from case-control analysis of our dataset (Figure 1). This shows that there is inflation of the test statistics at the upper tail of the distribution (P<10–4), even after exclusion of SNPs mapping to known loci (Figure 1). It is, therefore, likely that additional common low risk variants remain to be discovered and should be eminently harvestable in new larger GWAS or through further pooling of additional existing datasets. How much of the unaccounted heritable risk is truly embodied in a long tail of association is currently unknown but will impact on the ability to fully understand the genetic, and ultimately biological basis of CLL predisposition.
Figure 1.

Quantile-Quantile plots of observed test statistics (χ2) for association with CLL. The plot in blue shows test statistics for all SNPs, whereas the plot in green shows test statistics excluding SNPs mapping to previously identified risk loci. The black line represents the null hypothesis of no true association.
In conclusion, our findings provide evidence for a polygenic basis to susceptibility to CLL and a strong rationale for continuing to search for new risk variants through GWAS-based strategies.
Supplementary Material
Acknowledgments
Acknowledgments: the authors would like to thank all patients and individuals for their participation.
Footnotes
Funding: this work was primarily supported by the Leukaemia Lymphoma Research Fund (LRF05001 and 06002). Additional funding was provided by Cancer Research UK (C1298/A8362 supported by the Bobby Moore Fund) and the Arbib Fund. Maria Chiara Di Bernardo was supported by the NIH (CA148690). This study made use of genotyping data from the 1958 Birth Cohort kindly made available by the Wellcome Trust Case Control Consortium 2. A full list of the investigators who contributed to the generation of the data is available at http://www.wtccc.org.uk/. NHS funding for the Royal Marsden Biomedical Research Centre is acknowledged.
Information on authorship, contributions, and financial & other disclosures was provided by the authors and is available with the online version of this article at www.haematologica.org.
References
- 1.Di Bernardo MC, Crowther-Swanepoel D, Broderick P, Webb E, Sellick G, Wild R, et al. A genome-wide association study identifies six susceptibility loci for chronic lymphocytic leukemia. Nat Genet. 2008;40(10):1204–10 [DOI] [PubMed] [Google Scholar]
- 2.Crowther-Swanepoel D, Broderick P, Di Bernardo MC, Dobbins SE, Torres M, Mansouri M, et al. Common variants at 2q37.3, 8q24.21, 15q21.3 and 16q24.1 influence chronic lymphocytic leukemia risk. Nat Genet. 2010;42(2):132–6 [DOI] [PMC free article] [PubMed] [Google Scholar]
- 3.Crowther-Swanepoel D, Di Bernardo MC, Jamroziak K, Karabon L, Frydecka I, Deaglio S, et al. Common genetic variation at 15q25.2 impacts on chronic lymphocytic leukaemia risk. Br J Haematol. 2011;154(2):229–33 [DOI] [PubMed] [Google Scholar]
- 4.Lee SH, Wray NR, Goddard ME, Visscher PM. Estimating missing heritability for disease from genome-wide association studies. Am J Hum Genet. 2011;88(3):294–305 [DOI] [PMC free article] [PubMed] [Google Scholar]
- 5.Power C, Elliott J. Cohort profile: 1958 British birth cohort (National Child Development Study). Int J Epidemiol. 2006;35(1):34–41 [DOI] [PubMed] [Google Scholar]
- 6.Purcell S, Neale B, Todd-Brown K, Thomas L, Ferreira MA, Bender D, et al. PLINK: a tool set for whole-genome association and population-based linkage analyses. Am J Hum Genet. 2007;81(3):559–75 [DOI] [PMC free article] [PubMed] [Google Scholar]
- 7.Yang J, Benyamin B, McEvoy BP, Gordon S, Henders AK, Nyholt DR, et al. Common SNPs explain a large proportion of the heritability for human height. Nat Genet. 2010;42(7):565–9 [DOI] [PMC free article] [PubMed] [Google Scholar]
- 8.Yang J, Lee SH, Goddard ME, Visscher PM. GCTA: a tool for genome-wide complex trait analysis. Am J Hum Genet. 2011;88(1):76–82 [DOI] [PMC free article] [PubMed] [Google Scholar]
- 9.Sellick GS, Catovsky D, Houlston RS. Familial chronic lymphocytic leukemia. Semin Oncol. 2006;33(2):195–201 [DOI] [PubMed] [Google Scholar]
- 10.Wray NR, Yang J, Goddard ME, Visscher PM. The genetic interpretation of area under the ROC curve in genomic profiling. PLoS Genetics. 2010;6(2):e1000864. [DOI] [PMC free article] [PubMed] [Google Scholar]
Associated Data
This section collects any data citations, data availability statements, or supplementary materials included in this article.


