Abstract
The intensity of hemolytic anemia has been proposed as an independent risk factor for the development of certain clinical complications of sickle cell disease, such as pulmonary hypertension, hypoxemia and cutaneous leg ulceration. A composite variable derived from several individual markers of hemolysis could facilitate studies of the underlying mechanisms of hemolysis. In this study, we assessed the association of hemolysis with outcomes in sickle cell anemia. A hemolytic component was calculated by principal component analysis from reticulocyte count, serum lactate dehydrogenase, aspartate aminotransferase and total bilirubin concentrations in 415 hemoglobin SS patients. Association of this component with direct markers of hemolysis and clinical outcomes was assessed. As primary validation, both plasma red blood cell microparticles and cell-free hemoglobin concentration were higher in the highest hemolytic component quartile compared to the lowest quartile (P≤0.0001 for both analyses). The hemolytic component was lower with hydroxyurea therapy, higher hemoglobin F, and alpha-thalassemia (P≤0.0005); it was higher with higher systemic pulse pressure, lower oxygen saturation, and greater values for tricuspid regurgitation velocity, left ventricular diastolic dimension and left ventricular mass (all P<0.0001). Two-year follow-up analysis showed that a high hemolytic component was associated with an increased risk of death (hazard ratio, HR 3.44; 95% confidence interval, CI: 1.2–9.5; P=0.02). The hemolytic component reflects direct markers of intravascular hemolysis in patients with sickle cell disease and allows for adjusted analysis of associations between hemolytic severity and clinical outcomes. These results confirm associations between hemolytic rate and pulse pressure, oxygen saturation, increases in Doppler-estimated pulmonary systolic pressures and mortality (Clinicaltrials.gov identifier: NCT00492531).
Introduction
Sickle cell anemia is a hemoglobinopathy that is characterized by hemolysis. After adjustment for known modulators of disease severity such as hemoglobin F and alpha thalassemia, the baseline rate of hemolysis within an individual with sickle cell anemia is stable over time but heterogeneous among individuals.1,2 We have used principal component analysis to derive a hemolytic component from reticulocyte count, lactate dehydrogenase, aspartate transaminase and total bilirubin in prior epidemiological studies of sickle cell disease.3 This standard statistical data reduction approach uses conventional clinical measurements to explain the maximum shared variance among these indirect measures of hemolysis.4 Principal component analysis is a long-established statistical method for studying underlying mechanisms reflected in individual biological or physical measurements4,5 and, therefore, useful when the objective of the study is to investigate the role of an underlying mechanism.5 Some authors have questioned the validity of the hemolytic component as a variable to investigate underlying mechanisms of hemolysis in sickle cell anemia based on a lack of validation with direct markers of hemolysis; they have also challenged the relationship between the intensity of hemolytic anemia and clinical manifestations of sickle cell disease, such as pulmonary and systemic hypertension, low oxygen saturation, and history of cutaneous leg ulceration.6,7 Direct effects of intravascular hemolysis include increased cell-free plasma hemoglobin and release of sub-micron red blood cell (RBC) microparticles which contain a substantial amount of hemoglobin.8 The walk-PHaSST study (treatment of pulmonary hypertension and sickle cell disease with sildenafil therapy) was designed to develop a large, multi-center, observational cohort of patients with sickle cell disease and to conduct a smaller interventional trial of treatment with sildenafil in the subset of patients with elevated tri-cuspid regurgitation velocity.9 In this report, we first sought to confirm whether the hemolytic component reflects direct indicators of hemolysis in the Walk-PHaSST cohort and then to determine the clinical manifestations of a heightened level of hemolysis as reflected in the component in this new and large clinical cohort.
Design and Methods
Subject selection and clinical evaluation
This report focuses on patients with hemoglobin SS aged 12 years and over who were studied at steady state at 9 United States Centers and one United Kingdom Center as previously described.10 Local institutional review boards or ethics committees approved the protocol and written informed consent was obtained. Hemoglobin oxygen saturation was measured by pulse oximetry at room temperature and atmospheric oxygen pressure. Echocardiography was performed at the participating institutions and read centrally in the NHLBI echocardiography core laboratory. Cardiac measurements were performed according to the American Society of Echocardiography guidelines.11 Percentages of hemoglobin S, F and A were measured by high-performance liquid chromatography (HPLC) (Ultra Resolution System, Trinity Biotech). The -α3.7 and -α4.2 thalassemia alleles were detected by molecular methodology based on polymerase chain reaction at the University of Pittsburgh as previously described.12 Serum N-terminal pro-brain natriuretic peptide (NT-pro BNP) concentration was measured by a sandwich immunoassay using polyclonal antibodies that recognize epitopes located in the N-terminal segment (1– 6) of pro-BNP (1–108) (Elecsys analyser; Roche Diagnostics, Mannheim, Germany).
Derivation of a hemolytic component
Principal component analysis5 was used to derive a hemolytic component from lactate dehydrogenase (site-adjusted values from linear regression), aspartate aminotransferase (site-adjusted values from linear regression), total bilirubin and reticulocyte percent in 415 hemoglobin SS patients using the Stata 10.1 software package. For primary validation, it was also derived in a subset of 235 of these 415 hemoglobin SS patients without recent blood transfusion as documented by the absence of hemoglobin A measured by HPLC analysis. Note that both of these populations represent new validation cohorts, designed to independently test prior observations from a large pediatric sickle cell patient population.3
Plasma cell-free hemoglobin and red blood cell microparticles
A standardized protocol was instituted for obtaining and processing heparinized venous blood samples from each of the coordinating centers within one hour of the blood draw. Venous blood samples were centrifuged at ~1400× g for 10 min at either 4°C or room temperature, depending upon the availability of a refrigerated centrifuge at each of the centers. Plasma samples were collected, stored at −80°C, and subsequently shipped on dry ice to a central biorepository at the University of Pittsburgh. There, the frozen plasma samples were thawed carefully on ice, individual aliquots prepared for plasma hemoglobin ELISA and RBC microparticle analysis, and the aliquots were immediately refrozen at −80°C until the day of experimentation. Preliminary studies performed on fresh and thawed frozen plasma samples from the same healthy volunteer showed a similar relationship in microparticle counts across varying conditions (Online Supplementary Figure S1).
From the subgroup of patients who did not have hemoglobin A in their HPLC analysis of hemoglobin, we selected those in the highest (n=57) and lowest (n=57) quartiles of the hemolytic component distribution for measurement of plasma cell-free hemoglobin concentration by an anti-hemoglobin ELISA13 and RBC microparticles by flow cytometry.8 We have recently detailed a method of RBC microparticle enumeration for clinical plasma samples utilizing a flow cytometric approach.14 Briefly, a master mixture of Flow Cytometry Absolute Counting Standard microbeads (7.6 micron size) (Bangs Laboratories Inc., Fishers, IN, USA) and MegamixTM fluorescent beads of three diameters (0.5, 0.9 and 3 microns) (BioCytex, Marseille, France) at a known volumetric ratio were spiked into each sample and vigorously vortexed immediately prior to flow cytometric analysis on a FACSAria flow cytometer (BD Biosciences, San Jose, CA, USA). We defined RBC microparticles based upon the presence of a cell-specific antigen (glycophorin A) and surface phosphatidylserine using Annexin V binding. Although it is recognized that glycophorin A positive (A+) but Annexin V negative (A–) events of less than 1 micron in size occur and likely represent RBC microparticles, the definition we used is in agreement with that set forth by the International Society on Thrombosis and Hemostasis Scientific and Standardization Subcommittees for platelet microparticles.15
Glycophorin A+ Annexin V+ events, as defined by glycophorin A-PE and Annexin V-FITC immunostaining above isotype fluorescence threshold, were further validated as RBC microparticles by their light scatter distribution relative to the 0.5 and 0.9 micron fluorescent beads spiked into each sample. RBC microparticle (mp) counts were calculated using the following equation: [number of 7.6 micron counting beads added to each sample X (number of mp events/number of 7.6 micron bead events)]. As 10 μL of each sample was assayed, the calculated RBC mp count was divided by 10 in order to express units as “RBC mp counts per μL”.
Follow up for mortality
Study subjects from the Walk-PHASST observational study from 10 participating centers were followed for a median of 2.4 years (IQR 2.1–2.8 years). Over this period, life status was determined for a total of 395 out of 415 hemoglobin SS patients aged 12 years and over, and 16 deaths were observed. The association of the hemolytic component at study entry with mortality was examined using Kaplan-Meier survival curves and Cox’s proportional hazards models comparing the upper tertile with the lower two tertiles of hemolytic component (66.7th percentile,1.28 relative units). The potentially confounding effects of age, gender, hydroxyurea use, hemoglobin, fetal hemoglobin, and white blood cell count on the association between hemolytic component and mortality were examined using Cox’s proportional hazards regression.
Statistical analysis
Linear regression analysis was used to adjust lactate dehydrogenase and aspartate aminotransferase for site. Continuous variables with a skewed distribution were converted to a normal distribution using natural log or square root. Student’s t-test was used to compare plasma cell-free hemoglobin and plasma RBC microparticles between the highest and lowest quartiles of hemolytic component in patients with no hemoglobin A. Step-wise multiple linear regression was used to assess the independent effect of hemolytic component on clinical and echocardiographic parameters. Pair-wise correlation between predictors and Variance Inflation Factor was used to assess co-linearity in each model. A potential interaction between site and predictors was evaluated in each model. Missing values were the result of lack of laboratory or echocardiographic observations in random subgroups of patients. Analyses were performed using Stata 10.1 software (StataCorp, College Station, TX, USA).
Results
Hemolytic component
The hemolytic component derived from lactate dehydrogenase, aspartate aminotransferase, reticulocyte percentage and total bilirubin in 415 hemoglobin SS patients had a mean of 0 (SD=1.50) and predicted 55% of the variation among all four variables (Eigenvalue=2.20). Figure 1 demonstrates the relationship of the hemolytic component with the variables from which it was derived and the relationships among these variables.
Figure 1.
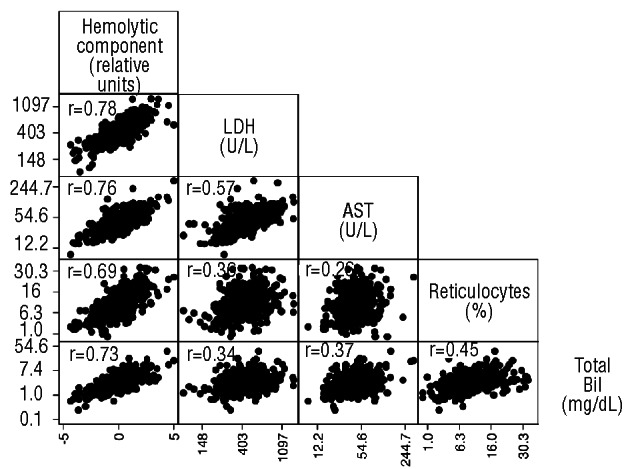
Relationships among the hemolytic component and the markers from which it is derived in all sickle cell anemia patients. Pearson’s correlation coefficient is provided for each relationship. All P<0.0001.
The hemolytic component has strong relationships with direct and indirect markers of intravascular hemolysis
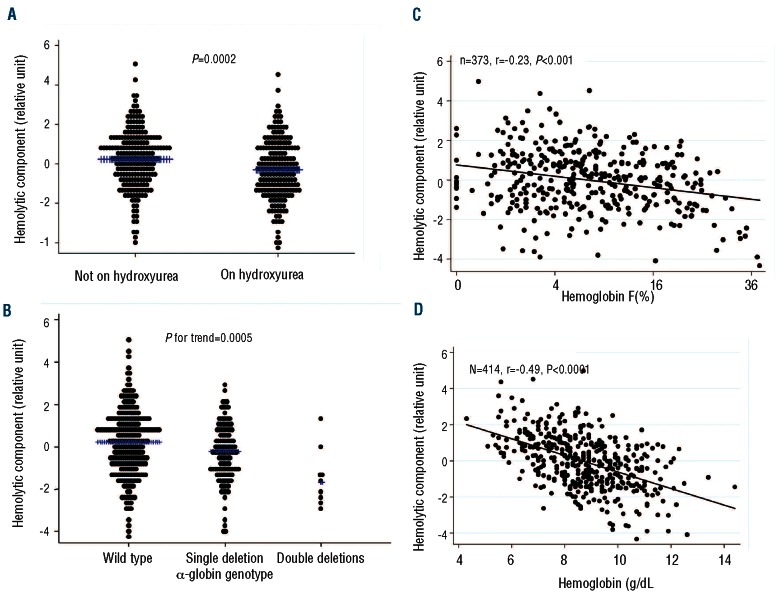
To determine whether the hemolytic component reflects direct indicators of intravascular hemolysis, we examined plasma concentrations of both RBC microparticles and cell free hemoglobin in the lowest and highest quartiles of hemolytic component. RBC microparticle counts (Figure 2; P=0.0001) and cell-free hemoglobin levels (Figure 3; P<0.0001) were significantly higher in the highest quartile of hemolytic component values compared to the lowest quartile. Out of 415 patients, 199 (48%) were receiving hydroxyurea treatment. The hemolytic component was lower with hydroxyurea therapy (Figure 4A; P=0.0002), α-thalassemia genotype (Figure 4B; P for trend=0.0005), and increasing percentage of hemoglobin F (Figure 4C; P<0.0001), supporting the hemolytic component’s relationship with the intensity of total hemolysis. The hemolytic component also correlated significantly and inversely with hemoglobin concentration (Figure 4D; P<0.0001). In multiple linear regression analysis, α-thalassemia single deletion (standardized beta = −0.15, P=0.002), double deletion (standardized beta = −0.23, P<0.0001), hemoglobin F (standardized beta = −0.40, P<0.0001), hemoglobin A (representing recent blood transfusion; standardized beta = −0.31, P<0.0001), female gender (standardized beta = −0.11, P=0.024), and hydroxyurea therapy (standardized beta = −0.11, P=0.038), were each independently associated with lower hemolytic component (Table 1).
Figure 2.
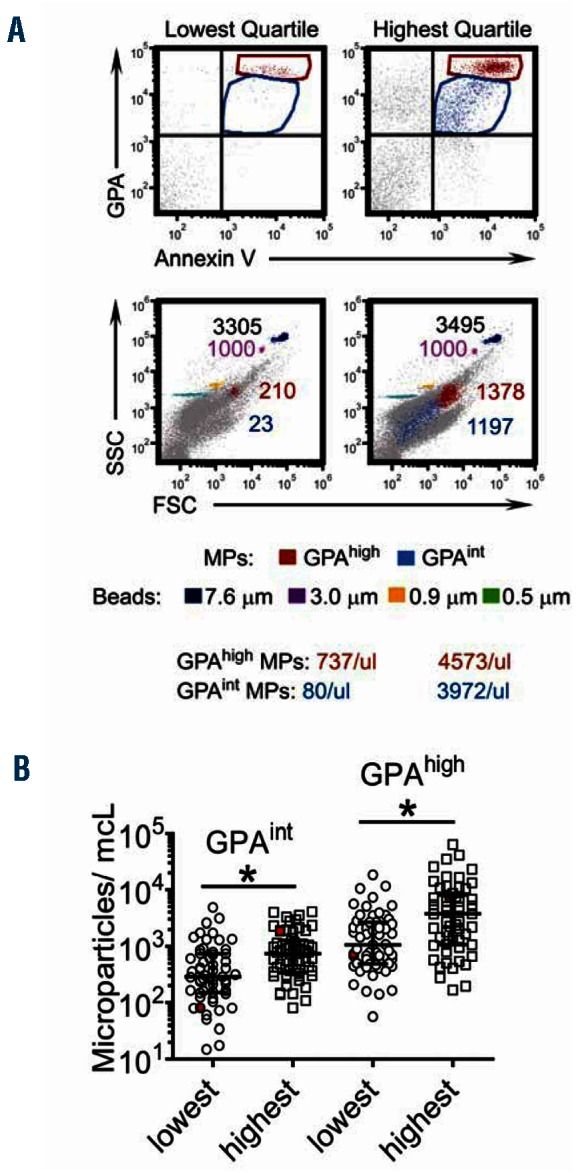
Distribution of plasma RBC microparticle counts, a direct marker of intravascular hemolysis, by extreme quartiles of hemolytic component in the subset of sickle cell anemia patients without detectable hemoglobin A. (A) Flow cytometric approach to identify plasma RBC microparticles. The 4-quadrant dot plots show two population events: glycophorin Ahigh (GPAhigh) Annexin V+ events (in red) and glycophorin Aintermediate (GPAint) Annexin V+ events (in blue) in both the lowest and highest quartile samples. The GPAhigh Annexin V+ and GPAint Annexin V+ events reflect two discrete populations that met the definition of RBC microparticles. The lower 2 panels indicate the side scatter (SSC) and forward scatter (FSC) distribution of the 7.6 micron counting bead (black), 3 micron (violet), 0.9 micron (orange), and 0.5 micron (green) beads relative to RBC microparticles (red and blue populations). Note that both y and x axes are in log scale. The number of events for each population is indicated in the corresponding color, with acquisition set to achieve 1000 events of 3 micron beads in each sample for an added measure of standardization. Calculation of RBC microparticle counts per microliter (μL) were obtained using [the absolute number of 7.6 micron beads added to each sample (ie. 116,000) X (ratio of 7.6 micron bead events: microparticle events)] divided by 10 as indicated in the Design and Methods section. (B) Distribution of GPAhigh and GPAint RBC microparticles per microliter (microparticles/μL) across the lowest and highest quartile of hemolytic component values. *, P=0.0001. Each point represents an individual sample and lines indicate the median and interquartile range for each group. Points represented in red reflect the 2 samples illustrated in the dot plots above in A.
Figure 3.
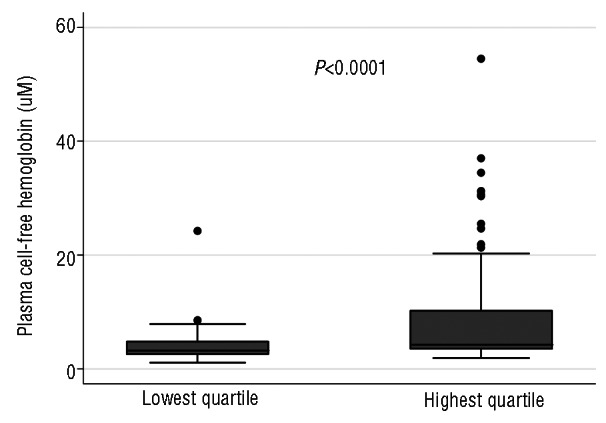
Distribution of plasma cell-free hemoglobin, a direct interquartile marker of intravascular hemolysis, by extreme quartiles of hemolytic component in the subset of sickle cell anemia patients without detectable hemoglobin A. Plasma cell-free hemoglobin concentrations are shown for the lowest and highest quartiles in microM heme. The box plots indicate the median and interquartile range. The whiskers indicate 1.5 times the interquartile range from the nearest quartile.
Figure 4.
Distribution of hemolytic component in all patients with sickle cell anemia according to variables known to influence or reflect hemolysis. (A) Hydroxyurea treatment (mean in each group shown by blue cross). (B) Alpha thalassemia genotype. (C) Percentage of hemoglobin F. (D) Hemoglobin concentration.
Table 1.
Independent predictors of hemolytic component in all sickle cell anemia patients from multiple linear regression analysis.
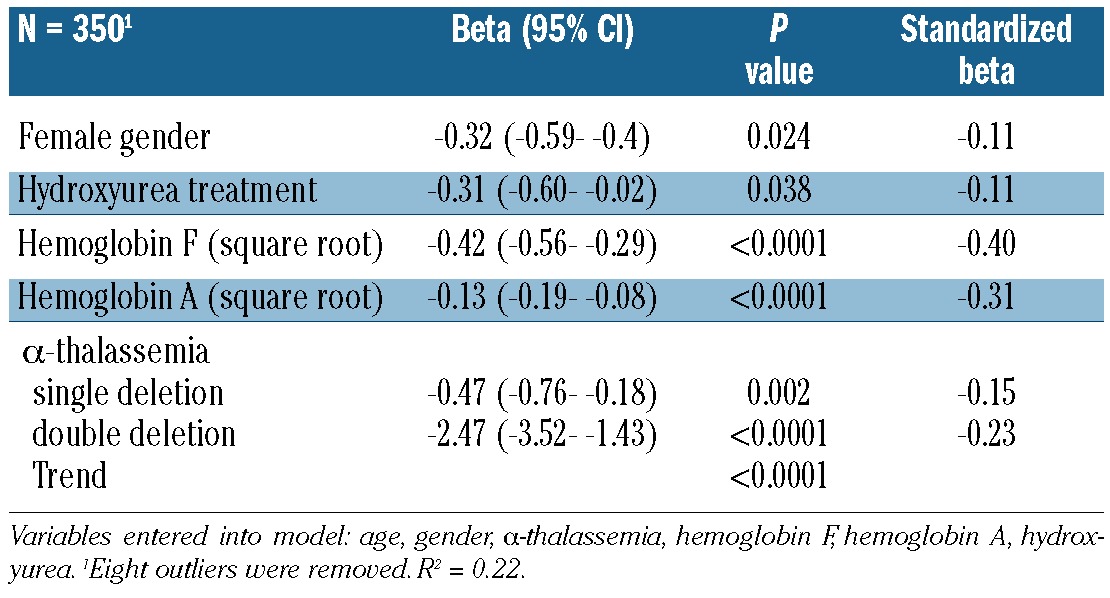
Figure 5.
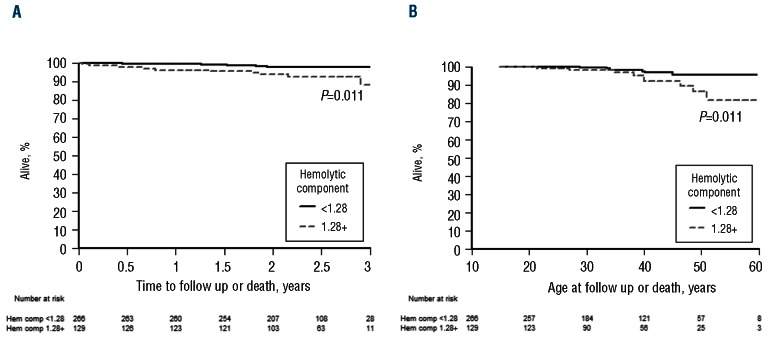
Survival in all patients with sickle cell anemia according to the hemolytic component. (A) According to duration of follow up. (B) According to age at death.
Association of the hemolytic component with clinical findings among all sickle cell anemia patients
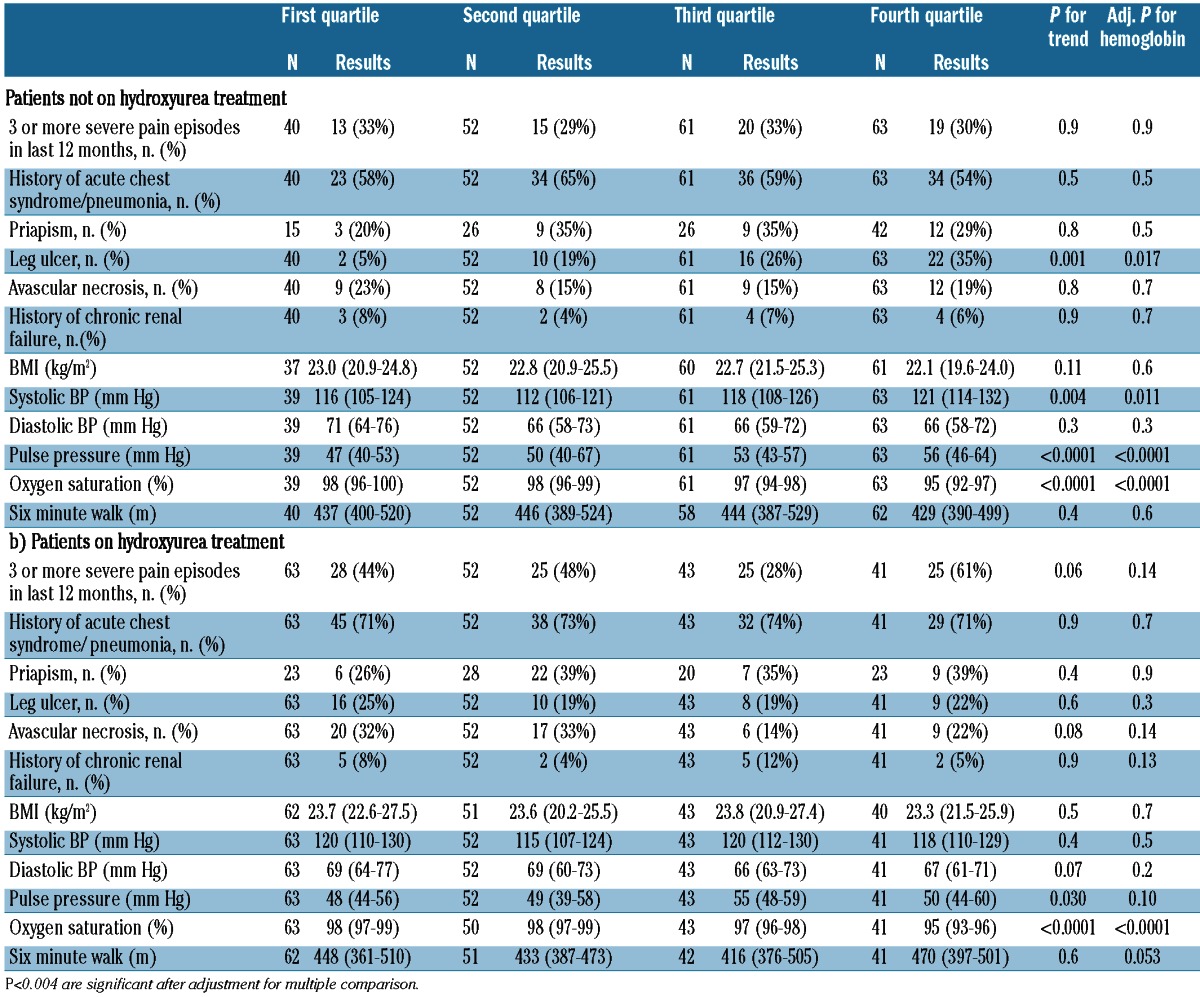
The hemolytic component was associated directly with systemic pulse pressure and inversely with hemoglobin oxygen saturation determined by pulse oximetry after accounting for multiple comparisons. The associations with oxygen saturation persisted after additionally adjusting for hemoglobin concentration and hydroxyurea therapy. The hemolytic component did not correlate with a history of leg ulcers among all patients, but it did so in the subgroup of patients not on hydroxyurea (P=0.001) (Tables 2 and 3).
Table 2.
Distribution of demographic and clinical variables by hemolytic component category in sickle cell anemia patients. Results are in median (interquartile range), unless otherwise indicated.
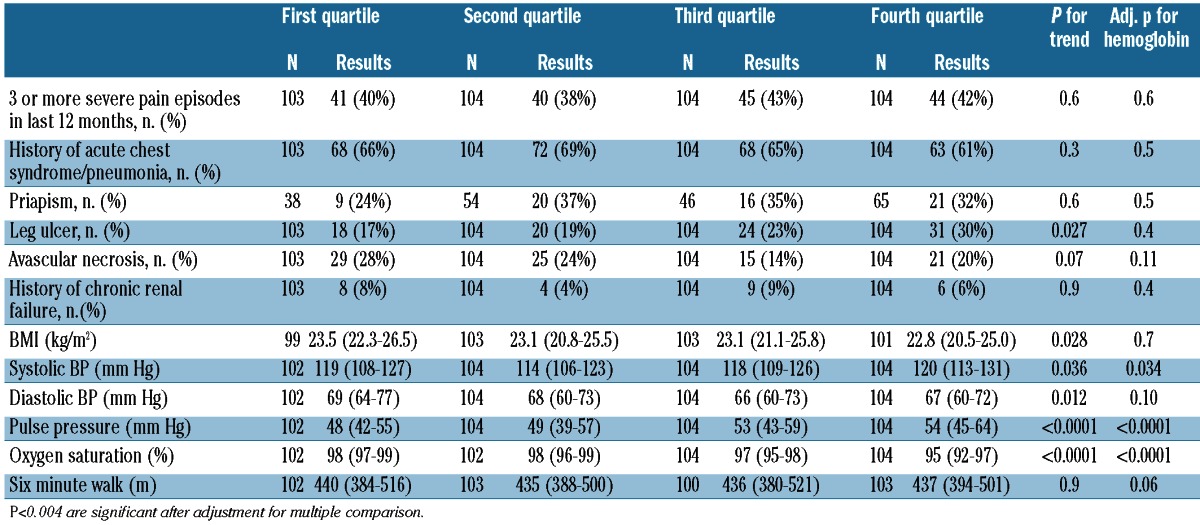
Table 3.
Distribution of demographic and clinical variables by hemolytic component category in sickle cell anemia patients by hydroxyurea treatment. Results are in median (interquartile range), unless otherwise indicated.
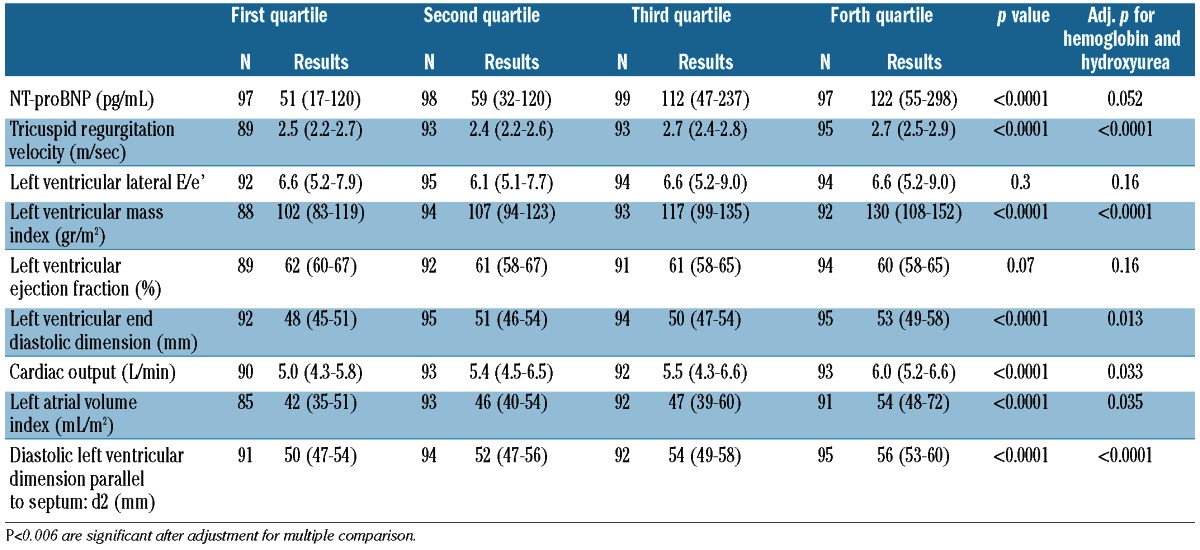
Association of hemolytic component with BNP and echocardiographic findings among all sickle cell anemia patients
The frequency of elevated tricuspid regurgitation velocity (>3.0 m/s) was 34 (9.2%) and the frequency of extremely elevated velocity (>3.5 m/s) was 11 (3.0%). The hemolytic component was associated positively with the NT-proBNP concentration, tricuspid regurgitation velocity, left ventricular mass index, cardiac output, left ventricular end-diastolic volume, left atrial volume index and left ventricular diastolic dimension after accounting for multiple comparisons. Correlation with tricuspid regurgitation velocity, left ventricular mass index and left ventricular diastolic dimension persisted after adjusting for hemoglobin concentration and hydroxyurea therapy (Table 4)
Table 4.
Distribution of laboratory and echocardiographic variables by hemolytic component category in sickle cell anemia patients. Results are in median (interquartile range), unless otherwise indicated.
Association of the hemolytic component with mortality
Using Kaplan-Meier survival analysis, a hemolytic component value in the upper tertile was associated with an increase in the risk of death over a median of 2.4 years of follow up (Figure 4; P=0.011). The risk of mortality associated with a hemolytic component value in the upper tertile was more than three times higher relative to a value in the lower two tertiles as determined using Cox’s proportional-hazards regression (HR 3.44; 95% CI: 1.2–9.5). Adjustment for age, gender, hydroxyurea use, hemoglobin, and white cell count had little effect on the magnitude or significance of the association between mortality and hemolytic component, while adjustment for fetal hemoglobin resulted in an elevated but not significant risk of death (HR 2.21; 95% CI: 0.7–6.7).
Discussion
The results of this study support the concept that a statistical approach to identify shared variability among indirect hemolytic markers can produce a variable that reflects intravascular hemolytic rate. This provides a validated value for hemolytic rate that facilitates studies of the underlying mechanisms of hemolysis and that allows for adjustment of confounding variables, including hemoglobin level, and analysis of associated clinical phenotypes. While this study focuses on sickle cell anemia, it is likely that the hemolytic component could be applied to the clinical study of other hemolytic disorders, including extravascular hemolytic disorders.
There is considerable data to suggest that the rate of hemolysis and the degree of anemia have both overlapping, and divergent pathophysiological and clinical consequences in sickle cell anemia. A decreased hemoglobin concentration leads to decreased delivery of oxygen to the tissues. Intravascular hemolysis leads to the release of hemoglobin and arginase-1 into the plasma, the scavenging of plasma NO by cell-free hemoglobin, and the depletion by arginase-1 of plasma arginine, the obligate substrate for the NO synthases.16,17 These processes may contribute to reduced NO bioavailability and vascular dysfunction. Recent studies suggest that hemolysis also increases plasma levels of hemin, which may activate the innate immune system and drive inflammatory respons-es.18,19 Hemolysis also drives platelet and hemostatic activation and is proposed to generate reactive oxygen species and activate vascular oxidases.20–23 A progressive vasculopathy related to hemolytic severity develops in some patients with sickle cell disease24,25 and is characterized by systemic hypertension, Doppler-echocardiography estimated elevation in systolic pulmonary artery pressure, endothelial dysfunction, intimal and smooth muscle proliferative changes in conduit blood vessels, and increased risk of death.26,27 While this hypothesis for phenotypic manifestations determined in part by the process of intravascular hemolysis has been challenged,6,7,28 our study provides substantial support for this model. The calculation of a hemolytic component resolves the problem of dealing with correlated predictors in multivariate analyses, allows for adjustment of important potential confounders, and allows for adjustment in multi-center studies for site variability in laboratory assay protocols and standards.
The current validated analysis of hemolytic rates in this large cohort of patients with homozygous hemoglobin-S disease suggests that hemolytic anemia in general, and intravascular hemolysis specifically, may constitute an independent risk factor for the development or manifestation of certain clinical complications or endophenotypes (subphenotypes).29,30 This study also confirms prior reported associations using single indirect biomarkers of hemolysis such as lactate dehydrogenase, including high pulse pressure, Doppler-estimated increase in systolic pulmonary artery pressure, low hemoglobin-oxygen saturation and prospective risk of death.27,31 The mechanism for the association between high degree of hemolysis and lower oxygen saturation is not known, but it is hypothesized to represent dysregulation of blood flow to the lung, causing imbalance in ventilation and perfusion matching.30,32 We were unable to confirm prior observations on the association between self-reported history of priapism and hemolytic anemia. In addition, there were not sufficient stroke events in our study to evaluate this complication. These studies also confirm a lack of association with self-reported history of rates of vaso-occlusive pain crisis and acute chest syndrome, which have been prospectively shown to correlate with higher steady state hemoglobin values in prior registry studies of sickle cell disease patients.33,34 Interestingly, this paradox was evident in the Co-operative Study of Sickle Cell Anemia, in which a high steady state hemoglobin value was associated with increased risk of vaso-occlusive crisis and the acute chest syndrome, but low hemoglobin was associated with increased risk of stroke and death.33–36
The use of a validated hemolytic component may be useful in future clinical trials to stratify patients and direct personalized treatment approaches to disease prognostication and therapeutic intervention. For example, a drug that inhibits hemolysis directly, such as the Gardos channel inhibitor senicapoc, may not be effective in reducing vaso-occlusive events and, in fact, increased vaso-occlusive events significantly in patients not taking hydroxyurea.37 This drug may have been effective in patients with more severe hemolytic anemia, as characterized by a high quartile hemolytic component and, if taken with hydroxyurea to limit vaso-occlusive complications, could conceivably improve hemoglobin oxygen saturations and reduce the risk of pulmonary and systemic hypertension, leg ulcers, and death.38,39 We included patients on hydroxyurea in order to have a representative sample of sickle cell anemia patients and to ensure that our findings have practical application. Furthermore, a validated hemolytic component may be useful to explore as a potential biomarker to assess efficacy in future clinical therapeutic trials. RBC microparticle numbers are increased in both steady-state and sickle cell crisis,40 inversely correlate with Hb levels in crisis and steady-state,40 and positively correlate with plasma free Hb levels in steady state.41 We have recently validated our methods for enumerating RBC microparticles in clinical plasma specimens.25 As detailed in the Design and Methods section, a standardized protocol was instituted for obtaining and processing heparinized venous blood samples from each of the co-ordinating centers within one hour of the blood draw. All samples were processed and handled in the same manner, and batched for flow cyto-metric analysis in a blinded fashion thus making relative quantitation of RBC microparticles in stored plasma specimens feasible. We do not have the data to investigate any role of auto-splenectomy on hemolytic variables and number of circulating red cell microparticles in this study, but this should be evaluated in future studies with defined splenic status or before and after splenectomy. It has been reported that splenectomy in thalassemia intermedia patients is associated with higher plasma hemoglobin and red cell microparticle levels.42
There are a number of limitations to this study. Episodes of painful vaso-occlusive crisis, acute chest syndrome and priapism were self-reported and, therefore, subject to recall bias. The laboratory measurements used were not centrally analyzed, hence the need for ‘site-adjusted’ values. The total bilirubin concentration rather than the indirect bilirubin concentration was used to calculate the hemolytic component because direct bilirubin concentrations were not measured. Patients receiving treatment with hydroxyurea were included in this study, and hydroxyurea is likely to have other effects on sickle cell complications than just reducing hemolysis. The pulse ox test was performed at all participating centers without standardization and, therefore, may have limited accuracy in monitoring oxygen saturation43 in certain circumstances such as the presence of methemoglobinemia. However, a number of studies have indicated that pulse oximetry is reliable for diagnosing hypoxia during steady state conditions and with acute complications in sickle cell disease patients.44-46 Details of deaths were not available from Walk-PHASST because of lack of funds for follow up beyond alive or dead status. There is a possibility that some of the fatal events were not related to sickle cell disease and this could not be accounted for by the survival analysis.
In summary, we found that the hemolytic component correlated with direct markers of intravascular hemolysis in patients with sickle cell anemia, namely plasma red blood cell microparticles and cell-free hemoglobin concentration. It also correlated with measures known to influence total hemolytic rate, namely hemoglobin F percent and the presence of alpha-thalassemia. Thus, this variable produced by a data reduction statistical methodology can potentially help in studies of the underlying mechanisms of hemolysis. Even after adjustment for hemoglobin concentration and hydroxyurea therapy, higher hemolytic component was associated with higher systemic pulse pressure, lower oxygen saturation, greater tricuspid regurgitation velocity and left ventricular diastolic dimension and mass, and increased risk of death. Thus, the hemolytic component reflects direct markers of intravascular hemolysis in patients with sickle cell disease, correlates with important clinical outcomes, and allows for adjusted analysis of associations between hemolytic severity and clinical outcomes.
Supplementary Material
Footnotes
Authorship and Disclosures
Information on authorship, contributions, and financial & other disclosures was provided by the authors and is available with the online version of this article at www.haematologica.org.
Funding
This work was supported by funds from the National Heart, Lung, and Blood Institute, National Institutes of Health, Department of Health and Human Services, under contract HHSN268200617182C. This work was also supported in part by NIH CTSA grant UL1 RR024131 (to CRM), grant ns. 2 R25 HL003679–08 and 1 R01 HL079912–02 from NHLBI (to VRG), by Howard University GCRC grant n. 2MOI RR10284– 10 from NCRR, NIH, Bethesda, MD, by R01HL086884 and R01HL086884 03S1 (to JSL), by NIH grants R01HL098032 and RO1HL096973 (to MTG), by the Institute for Transfusion Medicine and the Hemophilia Center of Western Pennsylvania and by the intramural research program of the National Institutes of Health.
References
- 1.Taylor JG, Nolan VG, Mendelsohn L, Kato GJ, Gladwin MT, Steinberg MH. Chronic hyper-hemolysis in sickle cell anemia: association of vascular complications and mortality with less frequent vasoocclusive pain. PLoS ONE. 2008;3(5):e2095. [DOI] [PMC free article] [PubMed] [Google Scholar]
- 2.Gordeuk VR, Minniti CP, Nouraie M, Campbell AD, Rana SR, Luchtman-Jones L, et al. Elevated tricuspid regurgitation velocity and decline in exercise capacity over 22 months of follow up in children and adolescents with sickle cell anemia. Haematologica. 2011;96(1):33–40 [DOI] [PMC free article] [PubMed] [Google Scholar]
- 3.Minniti CP, Sable C, Campbell A, Rana S, Ensing G, Dham N, et al. Elevated tricuspid regurgitant jet velocity in children and adolescents with sickle cell disease: association with hemolysis and hemoglobin oxygen desaturation. Haematologica. 2009; 94(3):340–7 [DOI] [PMC free article] [PubMed] [Google Scholar]
- 4.Van Belle G, Fisher LD, Heagerty PJ, Lumley T. Biostatistics: A methodology for the health sciences 2ed Hoboken: John Wiley & Sons; 2004 [Google Scholar]
- 5.Genser B, Cooper PJ, Yazdanbakhsh M, Barreto ML, Rodrigues LC. A guide to modern statistical analysis of immunological data. BMC Immunol. 2007;8:27. [DOI] [PMC free article] [PubMed] [Google Scholar]
- 6.Hebbel RP. Reconstructing sickle cell disease: A data-based analysis of the “hyperhemolysis paradigm” for pulmonary hypertension from the perspective of evidence-based medicine. Am J Hematol. 2011;86 (2):123–54 [DOI] [PubMed] [Google Scholar]
- 7.Bunn HF, Nathan DG, Dover GJ, Hebbel RP, Platt OS, Rosse WF, et al. Pulmonary hypertension and nitric oxide depletion in sickle cell disease. Blood. 2010;116(5):687–92 [DOI] [PubMed] [Google Scholar]
- 8.Donadee C, Raat NJ, Kanias T, Tejero J, Lee JS, Kelley EE, et al. Nitric oxide scavenging by red blood cell microparticles and cell-free hemoglobin as a mechanism for the red cell storage lesion. Circulation. 2011;124(4):465–76 [DOI] [PMC free article] [PubMed] [Google Scholar]
- 9.Machado RF, Barst RJ, Yovetich NA, Hassell KL, Kato GJ, Gordeuk VR, et al. Hospitalization for pain in patients with sickle cell disease treated with sildenafil for elevated TRV and low exercise capacity. Blood. 2011;118(4):855–64 [DOI] [PMC free article] [PubMed] [Google Scholar]
- 10.Sachdev V, Kato GJ, Gibbs JS, Barst RJ, Machado RF, Nouraie M, et al. Echocardiographic markers of elevated pulmonary pressure and left ventricular diastolic dysfunction are associated with exercise intolerance in adults and adolescents with homozygous sickle cell anemia in the United States and United Kingdom. Circulation. 2011;124(13):1452–60 [DOI] [PMC free article] [PubMed] [Google Scholar]
- 11.Lang RM, Bierig M, Devereux RB, Flachskampf FA, Foster E, Pellikka PA, et al. Recommendations for chamber quantification: a report from the American Society of Echocardiography’s Guidelines and Standards Committee and the Chamber Quantification Writing Group, developed in conjunction with the European Association of Echocardiography, a branch of the European Society of Cardiology. J Am Soc Echocardiogr. 2005;18(12):1440–63 [DOI] [PubMed] [Google Scholar]
- 12.Tan AS, Quah TC, Low PS, Chong SS. A rapid and reliable 7-deletion multiplex polymerase chain reaction assay for alphathalassemia. Blood. 2001;98(1):250–1 [DOI] [PubMed] [Google Scholar]
- 13.Wang X, Tanus-Santos JE, Reiter CD, Dejam A, Shiva S, Smith RD, et al. Biological activity of nitric oxide in the plasmatic compartment. Proc Natl Acad Sci USA. 2004;101(31):11477–82 [DOI] [PMC free article] [PubMed] [Google Scholar]
- 14.Xiong Z, Oriss TB, Cavaretta JP, Rosengart MR, Lee JS. Red cell microparticle enumeration: validation of a flow cytometric approach. Vox Sang. 2012;103(1):42–8 [DOI] [PMC free article] [PubMed] [Google Scholar]
- 15.Lacroix R, Robert S, Poncelet P, Kasthuri RS, Key NS, Dignat-George F. Standardization of platelet-derived microparticle enumeration by flow cytometry with calibrated beads: results of the International Society on Thrombosis and Haemostasis SSC Collaborative workshop. J Thromb Haemost. 2010;8(11):2571–4 [DOI] [PubMed] [Google Scholar]
- 16.Reiter CD, Wang X, Tanus-Santos JE, Hogg N, Cannon RO, Schechter AN, et al. Cell-free hemoglobin limits nitric oxide bioavailability in sickle-cell disease. Nat Med. 2002;8(12):1383–1389 [DOI] [PubMed] [Google Scholar]
- 17.Morris CR, Kato GJ, Poljakovic M, Wang X, Blackwelder WC, Sachdev V, et al. Dysregulated arginine metabolism, hemolysis-associated pulmonary hypertension, and mortality in sickle cell disease. JAMA. 2005;294(1):81–90 [DOI] [PMC free article] [PubMed] [Google Scholar]
- 18.Figueiredo RT, Fernandez PL, Mourao-Sa DS, Porto BN, Dutra FF, Alves LS, et al. Characterization of heme as activator of Toll-like receptor 4. J Biol Chem. 2007; 282(28):20221–9 [DOI] [PubMed] [Google Scholar]
- 19.Larsen R, Gozzelino R, Jeney V, Tokaji L, Bozza FA, Japiassu AM, et al. A central role for free heme in the pathogenesis of severe sepsis. Sci Transl Med. 2010;2(51):51ra71. [DOI] [PubMed] [Google Scholar]
- 20.Villagra J, Shiva S, Hunter LA, Machado RF, Gladwin MT, Kato GJ. Platelet activation in patients with sickle disease, hemolysis-associated pulmonary hypertension, and nitric oxide scavenging by cell-free hemoglobin. Blood. 2007;110(6):2166–72 [DOI] [PMC free article] [PubMed] [Google Scholar]
- 21.Hu W, Jin R, Zhang J, You T, Peng Z, Ge X, et al. The critical roles of platelet activation and reduced NO bioavailability in fatal pulmonary arterial hypertension in a murine hemolysis model. Blood. 116(9):1613–22 [DOI] [PMC free article] [PubMed] [Google Scholar]
- 22.Qin X, Hu W, Song W, Blair P, Wu G, Hu X, et al. Balancing role of nitric oxide in complement-mediated activation of platelets from mCd59a and mCd59b double-knockout mice. Am J Hematol. 2009;84(4):221–7 [DOI] [PMC free article] [PubMed] [Google Scholar]
- 23.Ataga KI, Moore CG, Hillery CA, Jones S, Whinna HC, Strayhorn D, et al. Coagulation activation and inflammation in sickle cell disease-associated pulmonary hypertension. Haematologica. 2008;93 (1):20–6 [DOI] [PubMed] [Google Scholar]
- 24.Hsu LL, Champion HC, Campbell-Lee SA, Bivalacqua TJ, Manci EA, Diwan BA, et al. Hemolysis in sickle cell mice causes pulmonary hypertension due to global impairment in nitric oxide bioavailability. Blood. 2007;109(7):3088–98 [DOI] [PMC free article] [PubMed] [Google Scholar]
- 25.Kaftory A, Hegesh E. Improved determination of cytochrome b5 in human erythrocytes. Clin Chem. 1984;30(8):1344–7 [PubMed] [Google Scholar]
- 26.Castro O, Hoque M, Brown BD. Pulmonary hypertension in sickle cell disease: cardiac catheterization results and survival. Blood. 2003;101(4):1257–61 [DOI] [PubMed] [Google Scholar]
- 27.Gladwin MT, Sachdev V, Jison ML, Shizukuda Y, Plehn JF, Minter K, et al. Pulmonary hypertension as a risk factor for death in patients with sickle cell disease. N Engl J Med. 2004;350(9):886–95 [DOI] [PubMed] [Google Scholar]
- 28.Eckman JR, Embury SH. Sickle cell anemia pathophysiology: Back to the data. Am J Hematol. 2011;86(2):121–2 [DOI] [PubMed] [Google Scholar]
- 29.Gladwin MT, Barst RJ, Castro OL, Gordeuk VR, Hillery CA, Kato GJ, et al. Pulmonary hypertension and NO in sickle cell. Blood. 2010;116(5):852–4 [DOI] [PMC free article] [PubMed] [Google Scholar]
- 30.Kato GJ, Gladwin MT, Steinberg MH. Deconstructing sickle cell disease: reappraisal of the role of hemolysis in the development of clinical subphenotypes. Blood. Rev 2007;21(1):37–47 [DOI] [PMC free article] [PubMed] [Google Scholar]
- 31.Kato GJ, McGowan V, Machado RF, Little JA, Taylor Jt, Morris CR, et al. Lactate dehydrogenase as a biomarker of hemolysis-associated nitric oxide resistance, priapism, leg ulceration, pulmonary hypertension, and death in patients with sickle cell disease. Blood. 2006;107(6):2279–85 [DOI] [PMC free article] [PubMed] [Google Scholar]
- 32.Quinn CT, Ahmad N. Clinical correlates of steady-state oxyhaemoglobin desaturation in children who have sickle cell disease. Br J Haematol. 2005;131(1):129–34 [DOI] [PMC free article] [PubMed] [Google Scholar]
- 33.Castro O, Brambilla DJ, Thorington B, Reindorf CA, Scott RB, Gillette P, et al. The acute chest syndrome in sickle cell disease: incidence and risk factors. The Cooperative Study of Sickle Cell Disease. Blood. 1994;84(2):643–9 [PubMed] [Google Scholar]
- 34.Platt OS, Thorington BD, Brambilla DJ, Milner PF, Rosse WF, Vichinsky E, et al. Pain in sickle cell disease. Rates and risk factors. N Engl J Med. 1991;325(1):11–6 [DOI] [PubMed] [Google Scholar]
- 35.Platt OS, Brambilla DJ, Rosse WF, Milner PF, Castro O, Steinberg MH, et al. Mortality in sickle cell disease. Life expectancy and risk factors for early death. N Engl J Med. 1994;330(23):1639–44 [DOI] [PubMed] [Google Scholar]
- 36.Ohene-Frempong K, Weiner SJ, Sleeper LA, Miller ST, Embury S, Moohr JW, et al. Cerebrovascular accidents in sickle cell disease: rates and risk factors. Blood. 1998; 91(1):288–94 [PubMed] [Google Scholar]
- 37.Ataga KI, Reid M, Ballas SK, Yasin Z, Bigelow C, James LS, et al. Improvements in haemolysis and indicators of erythrocyte survival do not correlate with acute vasoocclusive crises in patients with sickle cell disease: a phase III randomized, placebo-controlled, double-blind study of the gardos channel blocker senicapoc (ICA-17043). Br J Haematol. 2011;153(1):92–104 [DOI] [PubMed] [Google Scholar]
- 38.Castro OL, Gordeuk VR, Gladwin MT, Steinberg MH. Senicapoc trial results support the existence of different sub-pheno-types of sickle cell disease with possible drug-induced phenotypic shifts. Br J Haematol. 2011;155(5):636–8 [DOI] [PubMed] [Google Scholar]
- 39.Minniti CP, Wilson J, Mendelsohn L, Rigdon GC, Stocker JW, Remaley AT, et al. Anti-haemolytic effect of senicapoc and decrease in NT-proBNP in adults with sickle cell anaemia. Br J Haematol. 2011; 155(5):634–6 [DOI] [PMC free article] [PubMed] [Google Scholar]
- 40.Beutler E. Red Cell Metabolism: A Manual of Biochemical Methods. 2 ed: Grune and Stratton; 1984 [Google Scholar]
- 41.Cannan RK. Proposal for a certified standard for use in hemoglobinometry; second and final report. J Lab Clin Med. 1958;52(3):471–6 [PubMed] [Google Scholar]
- 42.Westerman M, Pizzey A, Hirschman J, Cerino M, Weil-Weiner Y, Ramotar P, et al. Microvesicles in haemoglobinopathies offer insights into mechanisms of hypercoagulability, haemolysis and the effects of therapy. Br J Haematol. 2008;142(1):126–35 [DOI] [PubMed] [Google Scholar]
- 43.Blaisdell CJ, Goodman S, Clark K, Casella JF, Loughlin GM. Pulse oximetry is a poor predictor of hypoxemia in stable children with sickle cell disease. Arch Pediatr Adolesc Med. 2000;154(9):900–3 [DOI] [PubMed] [Google Scholar]
- 44.Rackoff WR, Kunkel N, Silber JH, Asakura T, Ohene-Frempong K. Pulse oximetry and factors associated with hemoglobin oxygen desaturation in children with sickle cell disease. Blood. 1993;81(12):3422–7 [PubMed] [Google Scholar]
- 45.Ortiz FO, Aldrich TK, Nagel RL, Benjamin LJ. Accuracy of pulse oximetry in sickle cell disease. Am J Respir Crit Care Med. 1999; 159(2):447–51 [DOI] [PubMed] [Google Scholar]
- 46.Kress JP, Pohlman AS, Hall JB. Determination of hemoglobin saturation in patients with acute sickle chest syndrome: a comparison of arterial blood gases and pulse oximetry. Chest. 1999;115(5):1316–20 [DOI] [PubMed] [Google Scholar]
Associated Data
This section collects any data citations, data availability statements, or supplementary materials included in this article.


