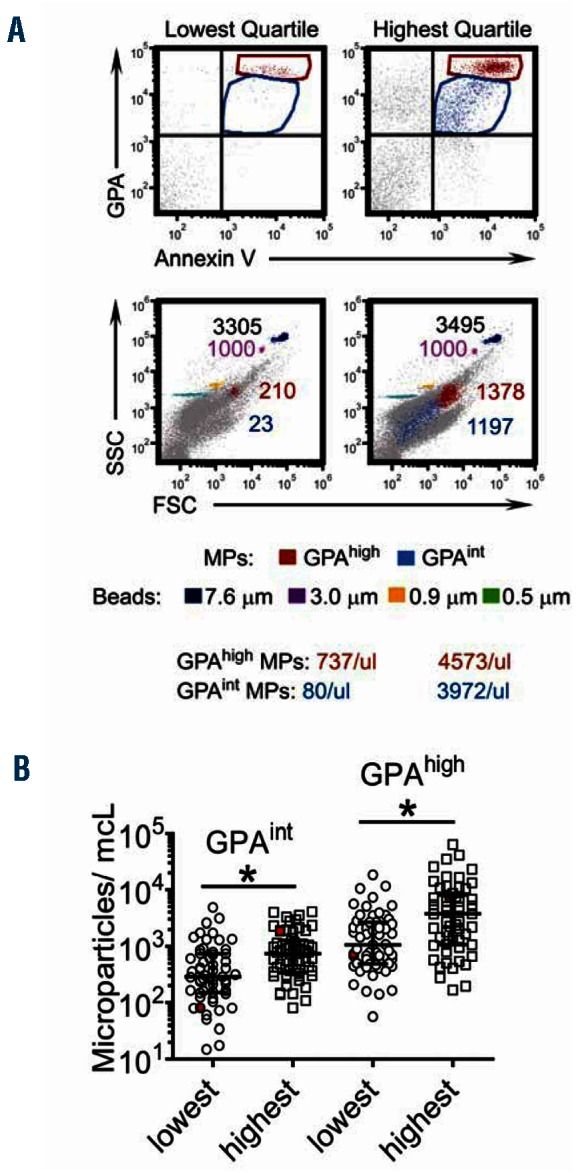
Figure 2.

Distribution of plasma RBC microparticle counts, a direct marker of intravascular hemolysis, by extreme quartiles of hemolytic component in the subset of sickle cell anemia patients without detectable hemoglobin A. (A) Flow cytometric approach to identify plasma RBC microparticles. The 4-quadrant dot plots show two population events: glycophorin Ahigh (GPAhigh) Annexin V+ events (in red) and glycophorin Aintermediate (GPAint) Annexin V+ events (in blue) in both the lowest and highest quartile samples. The GPAhigh Annexin V+ and GPAint Annexin V+ events reflect two discrete populations that met the definition of RBC microparticles. The lower 2 panels indicate the side scatter (SSC) and forward scatter (FSC) distribution of the 7.6 micron counting bead (black), 3 micron (violet), 0.9 micron (orange), and 0.5 micron (green) beads relative to RBC microparticles (red and blue populations). Note that both y and x axes are in log scale. The number of events for each population is indicated in the corresponding color, with acquisition set to achieve 1000 events of 3 micron beads in each sample for an added measure of standardization. Calculation of RBC microparticle counts per microliter (μL) were obtained using [the absolute number of 7.6 micron beads added to each sample (ie. 116,000) X (ratio of 7.6 micron bead events: microparticle events)] divided by 10 as indicated in the Design and Methods section. (B) Distribution of GPAhigh and GPAint RBC microparticles per microliter (microparticles/μL) across the lowest and highest quartile of hemolytic component values. *, P=0.0001. Each point represents an individual sample and lines indicate the median and interquartile range for each group. Points represented in red reflect the 2 samples illustrated in the dot plots above in A.
