

Abstract
Ca2+ waves were probably first observed in the early 1940s. Since then Ca2+ waves have captured the attention of an eclectic mixture of mathematicians, neuroscientists, muscle physiologists, developmental biologists, and clinical cardiologists. This review discusses the current state of mathematical models of Ca2+ waves, the normal physiological functions Ca2+ waves might serve in cardiac cells, as well as how the spatial arrangement of Ca2+ release channels shape Ca2+ waves, and we introduce the idea of Ca2+ phase waves that might provide a useful framework for understanding triggered arrhythmias. This article is part of a Special Issue entitled ‘Calcium Signaling in Heart’.
Keywords: Ca2+ waves, Mathematical models, Ca2+ sparks, Arrhythmias
1. Introduction
In a charming recollection of his life’s work Natori [1] writes that in 1940s and 50s he and his colleagues observed propagating contractions in skeletal muscle fibers following cessation of repetitive electrical stimulation or application of caffeine. Although at that time Natori did not know their origin, these propagating contractions bore the hallmarks of what we now recognize to be propagating Ca2+ waves: they propagated with a velocity of about 30–100 μm/s, they propagated without decrement, they annihilated each other upon collision, and they could be initiated with caffeine. These observations by Natori were perhaps the first, albeit indirect, evidence of Ca2+ waves.
In 1970 Ford and Podolsky [2] and Endo et al. [3] discovered, in skeletal muscle, the basic mechanism underlying the generation of Ca2+ waves: the regenerative release of Ca2+ by the sarcoplasmic reticulum (SR) or Ca2+-induced Ca2+ release (CICR). Indeed, Endo et al. had observed, similar to Natori, regions of highly shortened sarcomeres that moved slowly from one end of the fiber to the other, which they explained would arise from CICR.
Fabiato [4] just two years later extended the domain of Ca2+ waves to single isolated ventricular myocytes. He observed contracted regions that could propagate 20–50 μm within a cell at a velocity of 50–100 μm/s. Based on a series of elegant experiments Fabiato concluded that these regions of propagating contraction reflected an underlying wave of regenerative Ca2+ release.
In these early works local sarcomeric contractions served as the Ca2+ “indicator”. The advent of exogenous Ca2+ indicators such as aequorin enabled direct visualization of Ca2+ waves in non-muscle cells such as the fish egg [5] when activated by sperm or local application of a high concentration of Ca2+. Gilkey et al. [6] show dramatic images of a ring of aequorin luminescence traversing a spherical egg.
The development of second generation fluorescent indicators with high quantum yield [7] and conjugated to an acetoxymethyl ester, which allowed loading of cells simply by incubation, revolutionized the study of Ca2+ dynamics. The first visualization of Ca2+ waves in the isolated ventricular myocyte using the newly developed fluorescent indicator (fura-2) was carried out in 1987 by Wier et al. [8].
2. Current state of mathematical models of Ca2+ waves
Endo et al. in 1970 had explained the formation and propagation of Ca2+ waves in terms of CICR. This classical explanation remains at the core of current understanding of Ca2+ waves and all mathematical models of Ca2+ waves include CICR. The first mathematical model of Ca2+ waves by Backx et al. [9] assumed that Ca2+ release occurred continuously in space. Although Backx et al. could not have known it at that time (1989), this assumption was fundamentally wrong. In his seminal 1992 paper [10], Stern resolved the longstanding paradox of graded Ca2+ release in the face of CICR by positing that Ca2+ release did not occur continuously in space but rather only at discrete sites that were spatially separated from each other. In the following year Cheng et al. [11] published their remarkable discovery of Ca2+ sparks, which provided striking experimental support for Stern’s hypothesis that Ca2+ release occurs at discrete sites. Confocal imaging [12–17] of fluorescently labeled antibodies to ryanodine receptors (RyRs, the Ca2+ release channel of the SR) and electron microscopy [18] provided the structural underpinnings for Stern’s local control hypothesis. These studies showed that the RyRs occurred in discrete clusters arranged in a fairly regular lattice (Fig. 1). The cluster of RyRs forms a Ca2+ release unit (CRU, see [18,19]) contains ~70 [14,15] to about 250 [15,18] RyR molecules although the latest estimate based on super-resolution microscopy has put the number to be about 14 [17]. The number of RyRs in a cluster is important because it determines the maximum Ca2+ flux, which is an important determinant of whether Ca2+ waves can form and propagate.
Fig. 1.
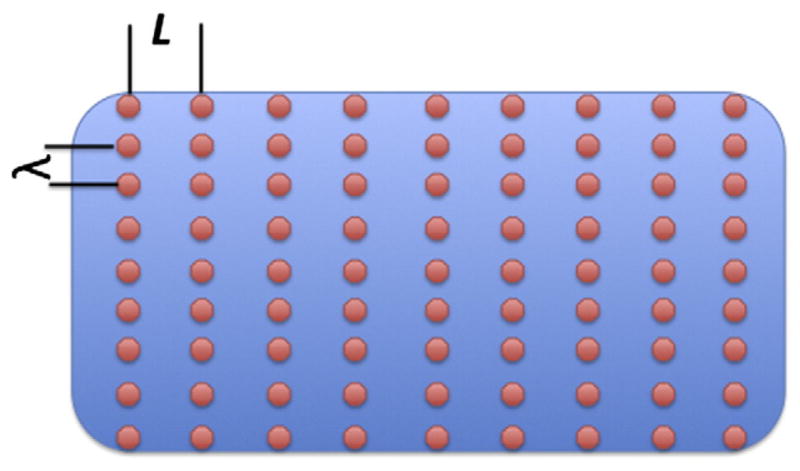
Schematic of CRUs in myocytes. The CRUs are aligned on the z-disk spaced L≈2μm apart. λ is the nearest neighbor distance between CRUs in the plane of the z-disk. λ ranges between ~0.4 and ~1 μm ([14,15,17]).
Most mathematical models for Ca2+ waves now assume that CRUs are spatially discrete and all models are of the fire–diffuse–fire type. In fire–diffuse–fire models, Ca2+ released from one CRU diffuses to a neighboring CRU triggering regenerative SR Ca2+ release. Ca2+ wave models differ in the number of dimensions (1-dimensional (1-d), [9,20,21]; 2-d, [22–24]; 3-d, [16,25]; whether release is deterministic [20,21,24,26,27] or stochastic [16,22,25,28]; and whether SR Ca2+ concentration is explicitly included in the model [21,29–31] or not [16,22,24,25,28].
Keizer et al. [20,26] developed the first mathematical model of Ca2+ waves based on discrete Ca2+ release sites. This was a simple 1-d, deterministic, linear diffusion model. In this model a fixed amount of Ca2+ was released from one CRU and the adjacent CRU fired if and when the ambient cytoplasmic Ca2+concentration ([Ca]i) exceeded some threshold. Because of its simplicity, the model revealed the factors essential for wave propagation on lattices: the amount of Ca2+ released, the threshold or sensitivity of Ca2+ release, and the lattice spacing. Later models have underscored the importance of these factors [22,24,25,28].
We later developed the first stochastic model of Ca2+ sparks and waves where the probability of a spark occurring depended on the local [Ca]i [22]. In this 2-d model the CRUs were asymmetrically distributed (2 μm along the longitudinal axis of the myocyte and 0.4 or 0.8 μm along the transverse axis) to match ultrastructural (see references above) and spark data [32]. At the time we undertook this project it seemed like a straightforward modeling problem to generate realistic Ca2+ waves from realistic stochastically occurring sparks based on realistic spacing of CRUs. It turned out that our model could satisfy most but not all experimental constraints. So far, no model we know satisfies all known experimental constraints.
Here are the challenges in developing models for Ca2+ waves. First, the sensitivity of RyRs to Ca2+ appears to be low; estimates range from 15 to 100 μM [33,34]. This means that as a Ca2+ wave propagates in the longitudinal direction, [Ca]i must reach more than about 10 μM in order for the CRUs to have a high probability of firing and thus sustaining the wave propagation. However, this high Ca2+ concentration is incompatible with the ~1 μM concentration measured during a wave [35,36].
Second, if the RyR Ca2+ sensitivity was assumed to be ~1 μM then models could generate Ca2+ waves that raise [Ca]i to only ~1 μM. However, these models would need to be deterministic and could not use stochastic models of sparks because when the RyR sensitivity is so high, the models become stochastically unstable. That is, such high sensitivity leads to a very high frequency of sparks and the initiation of so many Ca2+ waves (like raindrops on a pond) that no well-defined traveling wave can be observed [22,24].
Keller et al. [37] have proposed a “wave front sensitization” mechanism that allows Ca2+ waves to propagate with ~1 μM amplitude while still maintaining low Ca2+ release sensitivity of the CRUs. Their idea depends on the strong effect of an increased luminal SR Ca2+ content has on increasing the sensitivity of Ca2+ release [38–44]. Shannon et al. [41] found that the SR fractional release Ca2+ release increased slowly and linearly with the SR Ca2+ content (free [Ca]SR and total Ca2+) but then rose very steeply when [Ca]SR exceeded a threshold concentration about 500 μM. (We use the term “threshold” as a convenient shorthand to indicate where the fractional release curve begins to rapidly increase without implying the existence of a discontinuity.) With the wave front sensitization mechanism, Ca2+ released at the leading edge of the wave, diffuses through the cytoplasm and is taken up by SR in front of the wave. If the amount of Ca2+ taken up causes [Ca]SR to exceed the threshold then SR Ca2+ release occurs thereby maintaining the propagation of the wave. Modeling [29,31] has shown the feasibility of this mechanism but requires that Ca2+ diffusion in the SR relative to cytoplasmic diffusion be slow enough so that the build up of [Ca]SR at the front of the wave is not dissipated by retrograde diffusion. The wave front sensitization mechanism neatly resolves the seemingly incompatible requirements of low RyR Ca2+ sensitivity and low Ca2+ wave concentration and this mechanism readily explains the long known observation that Ca2+ waves occur under conditions that cause SR Ca2+ overload [4].
While the wave front sensitization mechanism obviates the need for high cytosolic Ca2+ concentrations to maintain wave propagation it still does not clear the way for a self-consistent model of Ca2+ waves. The third challenge in developing models of Ca2+ waves based on Ca2+ sparks is the fundamental lack of an adequate model of Ca2+ sparks. Spark models based on relatively small Ca2+ currents (ICRU ~1 pA) through the CRUs produce Ca2+ transients of reasonable magnitudes but the spatial spread of the computed spark (the full-width at half maximum, FWHM) is ~1 μm [45,46] about half of what is experimentally observed [32,47,48]. Because the spark image is a 2-dimensional projection of the 3-dimensional sphere (or paraboloid) of Ca2+-bound fluorescent indicator, doubling of the FWHM requires the amount of released Ca2+ to increase by a factor of ~8 [49]. Larger estimates of ICRU (~10–20 pA) based on noise analysis [50] or back calculation from the spark properties [49,51,52] produce sparks that have the right FWHM but produce Ca2+ waves that have too high average [Ca]i (~10–100 μM, [22,24,25]).
The problem of needing to use large ICRU to get sparks with FWHM ~2 μm may stem from a wrong diffusion model. In current spark models, there is no coupling between the movement of Ca2+ and other molecules, except through the chemical reactions involving Ca2+ and buffers. However, the movement of Ca2+ (when measured with respect to a fixed reference frame as in all confocal measurements of sparks) is necessarily coupled to the movement of all other molecules and ions (water and K+, for example) to some extent [53,54]. Such coupling might result in a larger spatial spread of Ca2+ and Ca2+-bound indicator (i.e., a larger spark) for a smaller total amount of released Ca2+ than predicted by current linear diffusion models. Diffusion is difficult to model from first principles because the interaction of all species must be considered in writing the conservation equations (mass, momentum, energy). Tan et al. [55] approach the spark width problem differently by assuming that diffusion is non-Fickian. They show that a subdiffusion model can produce sparks of ~2μm width using a current of 2 pA. Although Tan et al. do not specify the physical mechanism underlying anomalous subdiffusion their work is an important call to look more deeply into the mechanism of diffusion not only of Ca2+ but all molecular and ionic species in a complex milieu such as the cytoplasm.
3. Physiological Ca2+ waves in myocytes
Ca2+ waves in mammalian ventricular myocytes are generally viewed as pathological and underlie triggered arrhythmias (see below but see [38] for an alternative viewpoint). Here we examine the role that Ca2+ waves may play in the normal functioning of non-mammalian ventricular myocytes, atrial myocytes, and Purkinje cells and how the spatial arrangement of Ca2+ release channels could affect cellular function.
3.1. To wave or not to wave
Non-mammalian ventricular myocytes [56] and atrial cells lack t-tubules although rat and mouse atrial cells do have a transverse axial tubular system (TATS) that predominantly runs longitudinally [57–60]. Excitation–contraction (E–C) coupling in these cells is initiated only at the cell periphery (or occasionally at sparsely distributed sites within the cell [60]) where the dihydropyridine receptors CaV1.2 and RyRs are in close apposition [56], Fig. 2. Full activation of myofibrils requires that [Ca]i reach a sufficiently high level throughout the myocyte within the period of the heartbeat. To achieve full and rapid myofibrillar activation, cells lacking t-tubules could adopt a strategy of being thin or use Ca2+ waves that start at the cell surface and propagate radially to the cell center (centripetal waves). Diffusion occurs quickly for short distances so thin cells could depend solely on Ca2+ diffusing from the sarcolemmal surface. However, the time scale for diffusion increases quadratically with distance so myofibrils at the core of myocytes with larger cross sections might not be fully activated within the period of the heartbeat. Ca2+ waves, which involve diffusion and sequential activation CRUs, change the time scale of activation from a quadratic to a linear function of distance. Moreover, large surface-to-core Ca2+ concentration gradients that occur when Ca2+ enters only from the surface sarcolemma are reduced with Ca2+ waves. Accordingly, we might expect that species with wider cells would have evolved mechanisms that support Ca2+ waves. Centripetally propagating Ca2+ waves have been observed in guinea pig [61], cat [62], and rat [60,63,64] atrial myocytes.
Fig. 2.
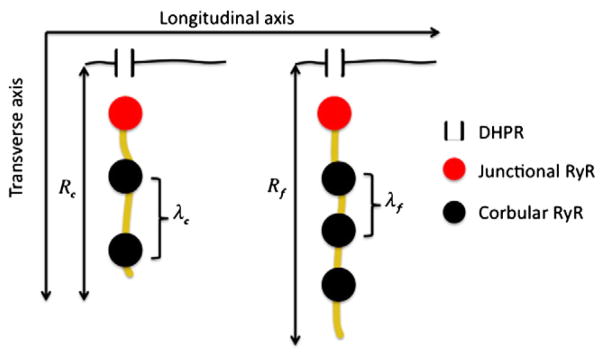
Schematic of spatial distribution of Ca2+ handling molecules in chicken (c) and finch (f).
Recent measurements of Perni et al. [56] on lizard, chicken, and finch ventricular myocytes allow us to make rough quantitative estimates that may distinguish between these two strategies. The choice of strategy is constrained by the heart rate, the cross-sectional size of the cell, and Ca2+ handling properties. The heart rates (ν) for the lizard, chicken, and finch are, respectively, 40–140, 275, and 500 beats/min. The mean myocyte cross-sectional radii(R) are 2.7 μm, 4.6 μm, and 6.9 μm for the lizard, chicken, and finch. Because Ca2+ waves propagate by sequential activation of CRUs, the ability of a myocyte to support a wave and the wave velocity depend on the distance between the CRUs. Perni et al. found the edge-to-edge distances between CRUs (λ) in the corbular/extended SR are 235 nm and 126 nm for the chicken and finch; no datum is given for the lizard. There is insufficient data on Ca2+ handling for the chicken and finch to model Ca2+ waves so we ask whether these two species are dynamically equivalent. That is, if we suppose a Ca2+ wave can propagate in the chicken myocyte at a speed sufficient to activate the cell within the time of its heart beat, then could a Ca2+ wave also activate the finch myocyte during period of its heart beat assuming that Ca2+ handling were the same in both species? To answer this we adopt the simplest wave propagation model where we suppose that the CRU fires when the ambient [Ca]i exceeds some threshold. The time (τ) for a diffusive process (for simple linear diffusion) scales quadratically with distance, τ~λ2/D, where λ is a characteristic length and D is the diffusion coefficient. In this case let λ be the edge-to-edge distance between CRUs and we estimate the time between when Ca2+ is released from one CRU and when the threshold concentration is reached at the adjacent CRU by τ=βλ2; a more accurate estimate can be found in [65] but this simple formula is sufficient here. The number of CRUs from the cell periphery to the center is n=R/λ. A steadily propagating wave will take time T=nτ=(R/λ)βλ2=Rβλ to travel from the surface to the center. We choose β so that the total time Tc for the chicken matches the observed heart rate. Thus β =(Rcλcvc)−1, where the subscript c refers to the chicken. Perni et al.’s data give β=0.4 s/μm2. Let us see if we can recover the time for a wave in the finch myocyte to reach the center, Tf, using this β value. By using the same β value we are assuming that Ca2+ handling is identical in the chicken and finch. The wave propagation time is Tf = βRfλf =(0.4 s/μm2)(3.45μm)(0.126μm)=0.17 s. This value is close to the observed heart beat period of 0.12 s, which suggests closer edge-to-edge CRU spacing in the finch had evolved so that a Ca2+ wave could propagate throughout the myocyte within the time of the heartbeat.
We can apply a similar analysis to see if the finch could use only the Ca2+ that enters through activation of the peripheral couplings on the cell surface. In this case our time scale τ is the characteristic time for the concentration at the center to reach some specified level, τ=βR2. We choose β so that τc equals the observed chicken heartbeat period τc =1/vc, which gives . When we use this β to calculate τf we get . This value is far larger than the observed period of 0.12 s. The analysis suggests that the finch, because of the myocytes’ large cross section and rapid heart rate, could not survive solely on Ca2+ released from CRUs at the peripheral couplings but require Ca2+ waves that travel centripetally from surface to center.
Applying the same analysis to the lizard we find that τe =0.08 s, which is well below the observed cycle length of 0.43 to 1.49 s. This suggests that because of the low heart rate and the thinness of the cell, the lizard could activate all its myofibrils just from Ca2+ coming from the peripheral couplings (provided the quantity of Ca2+ in these stores is adequate) obviating the need for Ca2+ waves.
These calculations provide a teleological glimpse into how Mother Nature could modify structures to attain her goals. There is a common need in the ventricular and atrial myocyte to activate all myofibrils but in the face of different constraints of force (~R2) and heart rate. If the biochemical machinery (actin, myosin, RyRs, SERCA) is similar in different species then it suggests that adaptation occurs by the (presumably) easier pathway of altering structures (changing number and distances between CRUs) rather than changing the biochemical machinery.
3.2. Layered structure of Ca2+ handling molecules in Purkinje and atrial cells
The spatial distribution of type 2 RyRs (RyR2) in both atrial and Purkinje cells in the central (a few μm away from the surface) is fairly represented by the cartoon in Fig. 1. That figure does not depict the more complex layering of different Ca2+ handling molecules near the sarcolemmal surface seen in atrial cells [63,66], neonatal myocytes [67–70], and Purkinje cells [71]. The canine Purkinje cell has overlapping concentric layers of IP3R1, RyR3, and RyR2 [71] shown schematically in Fig. 3. Within 2 μm of the surface is a mixture of RyR1, RyR3, and type 1 IP3 receptors (IP3R1), with more RyR3 than RyR2. The layer between 2 and 4 μm from the surface is filled primarily with RyR3 and is virtually devoid of RyR2. From 4 to 6 μm the ratio of RyR2 to RyR3 increases and from 6 μm to the center (about 12–15 μm from the surface, [72]) is filled principally with RyR2 although IP3R1 is sparsely scattered throughout this region.
Fig. 3.

Layers of RyR3, RyR2, and IP3R1 in canine Purkinje cells. Redrawn from [71].
In a series of papers Boyden and her colleagues [71–74] have found 3 types of Ca2+ waves. One type propagates just along the surface parallel to the cell’s long axis; the second type is a local wavelet that propagates perpendicular to the surface and limited to the subsarcolemmal space, which they define to be within 6 μm of the surface, the furthest extent of RyR3s. The third type, the cell-wide wave, is similar to those seen in ventricular myocytes that propagate longitudinally.
The function the layered structures of IP3R1s and RyRs serve is unknown. Stuyver et al. [71] speculate that the higher Ca2+ sensitivity of RyR3s will more readily respond to Ca2+ entry through the DHPRs and generate subsarcolemmal wavelets, which can then develop into cell-wide waves. This interpretation must be regarded with caution since the functional properties of RyR3 depend on SR loading [75] and on specific tissue [76]. Application of an IP3 antagonist reduced the number of wavelets and cell-wide waves [71,74]. This suggests that activation of the IP3R1s could be enhancing the open probability of individual clusters of RyR2s and/or the diffusive coupling of separate CRUs by locally releasing Ca2+ into the subsarcolemmal space.
Rat atrial cells have a somewhat similar layered structure with type 2 IP3R colocalized with RyR2 at the periphery [63,66]. A 2 μm gap exists between this surface layer of IP3R2+RyR2 and the central core of RyR2. It is not known whether RyR3 is present in rat atrial cells and whether the 2 μm gap might be filled with RyR3s. Activation of IP3R2s by IP3 agonists increased the spark frequency at the periphery and triggered extra diastolic Ca2+ transients during pacing [66]. Modeling studies of atrial cells show that the 2 μm gap between the surface layer and central core of RyR2s is a significant barrier to centripetal Ca2+ wave propagation [24].
In cat atrial cells activation of IP3R2 by endothelin generated robust Ca2+ waves during pacing and, as with the rat atrial cells, extra diastolic Ca2+ release [77]. Interestingly, exposing permeabilized cells to IP3 or an IP3 agonist increased spark frequency throughout the myocyte suggesting that, unlike rat atrial cells, IP3R2s are not restricted to the periphery. Indeed, silencing the RyRs with tetracaine revealed elementary Ca2+ release from IP3R2 throughout the myocyte [77].
The aggregate of these studies suggests an interplay between IP3Rs and RyRs with the former modulating the probability that the RyRs would generate cell-wide Ca2+ waves. Why would this modulation be needed? As discussed earlier, cells without t-tubules must rely on Ca2+ released from junctional CRUs at the cell surface and from Ca2+ entry from surface DHPRs and Na+–Ca2+ exchanger (a prominent source of Ca2+ in neonatal cells [68,70]) or release from central CRUs presumably as a centripetal wave. It is a geometrical fact that an annulus close to the surface contains a disproportionate share of the cell volume. Therefore, even if Ca2+ elevation were restricted to near the surface, a sufficient fraction of the myofibrils might still be activated to meet the contractile demands. However, as the demands for greater contractile force or speed increase the IP3 signaling pathway might tune the sensitivity of the RyRs, perhaps by triggering IP3R Ca2+ release that raises the local [Ca]i around the RyRs, and increasing the probability of initiating a cell-wide wave. This scenario might be appealing but we should note that the studies on Purkinje and atrial cells indicate that IP3 stimulation tended to be proarrhythmic.
A number of important questions remain. What role does RyR3 in the Purkinje cell play? If we looked for RyR3s, would we find them in atrial cells with the spatial distribution seen in Purkinje cells? Canine Purkinje cells have type 1 but not type 2 IP3Rs [71] whereas the rat atrial cell has type 2. Do the differences in Ca2+ inactivation and Ca2+ and IP3 sensitivities between these two types [78] play a functional role in the generating waves? There may be a greater imperative to generate cell-wide waves in Purkinje cells to fully activate myofibrils because their diameter is about twice that of atrial cells [72]. Although Purkinje cells are not devoid of t-tubules the volume density is low compared to that in the ventricles [79] so it is unlikely t-tubules play a significant part in coordinating contraction in these cells. Perhaps the molecular differences in IP3Rs and RyRs and their spatial distribution in Purkinje and atrial cells might reflect the differing demands for generating Ca2+ waves.
4. Ca2+ waves and pathology
The elevation of [Ca]i by Ca2+ waves can generate a transient inward current via the Na+-Ca2+ exchanger and other Ca2+ activated currents [80–85]. Depolarization induced by this inward current can sometimes be sufficiently large to trigger an action potential (AP, [73,83,85,86]) in single myocytes. One miscreant myocyte cannot, however, trigger an ectopic beat because it cannot source enough current to depolarize neighboring cells sufficiently to trigger another round of APs. This is the source-sink mismatch problem. Modeling studies show that a very large number of myocytes must synchronously release Ca2+ in order for the aggregate to overcome the source-sink mismatch and generate an ectopic beat [87,88]. The number depends strongly on the number of spatial dimensions, the smallest being for 1-dimensional tissue such as Purkinje fibers. Pathological conditions that reduce repolarization reserve or reduce electrical coupling (such as fibrosis) can greatly reduce the number. Still, even for conditions favoring ectopic beat generation, synchronous spontaneous Ca2+ release (SCR) must occur in 10,000 or more cells to generate an ectopic beat [87]. These modeling results are consistent with experiments by Katra and Laurita [89] in a canine wedge model showing after depolarizations occur when SCR occurs over a relatively large area (~3×3 mm2). Based on combined optical mapping of Ca2+ and membrane potential in whole rabbit hearts, Myles et al. [90] estimated that the number of cells needed to produce a premature ventricular complex (PVC) is ~12,000 in 2-d and ~2×10⁶ in 3-d, close to the model estimates of 8000 and 0.8×10⁶ respectively.
The key question is how to get 10,000 or more cells to spontaneously release Ca2+ at about the same time. There are two possible mechanisms: synchronization occurs because cells are coupled, i.e., not acting independently; or cells act independently and happen to all fire at about the same time. Coupling could occur via diffusion of Ca2+ through gap junctions but this is unlikely because the probability of cell-to-cell wave propagation is low [91,92]. Cells could be mechanically coupled. SCR that initiates a contraction and relaxation cycle in one myocyte can trigger Ca2+ release from myofilaments in a neighboring mechanically coupled myocyte, which could then trigger spontaneous release from the SR [93–95]. The velocity of this mechanically triggered Ca2+ and contraction wave is ~1 to 17 mm/s [96], orders of magnitude higher than velocity of Ca2+ waves (~100μm/s) generated within a single myocyte by the fire–diffuse–fire mechanism. The very high velocity of these mechanical waves makes them a possible mechanism for synchronizing the spontaneous release of ~10,000 cells. However, in two cited studies [89,90] mechanical movement was arrested so mechanical coupling could not have been the cause of synchronization.
Alternatively, synchronous SCR can also occur without any cell-to-cell coupling, similar to the sudden (within ~1 month) emergence of billions of cicadas every ~17 years. Two ingredients are needed for synchronization to work by this mechanism: a synchronizing event, such as an AP, that simultaneously puts ~10,000 cells into the same starting state and a population of cells that will, in time, independently spontaneously release Ca2+. The time between the synchronizing event and when SCR first occurs is called the first latency time and the distribution of these times in the population is the first latency distribution. If the first latency distribution is narrow then spontaneous Ca2+ release will occur nearly synchronously in many cells. The important question is what factors control the width of the first latency distribution. There are many possibilities including SR load and RyR restitution time ([97] for review). In an experimental and theoretical study Wasserstrom et al. [92] showed that the first latency distribution becomes narrower with increasing SR Ca2+ load. In other words, higher SR Ca2+ load leads to more synchronous Ca2+ release.
The existence of a synchronizing event allows the definition of a Ca2+ “phase wave”. The idea of a phase wave can be illustrated with a line of equidistantly spaced clocks (say 1 m apart) whose initial time is set in proportion to the distance from the origin, say −1 s apart so clock zero starts at 12:00, clock 1 starts at 11:59, etc. If the clocks are allowed to run and we follow the position of the clock hitting the 12:00 mark (the “phase” marker) then it would appear that a wave is propagating at 1 m/s. In a myocyte a phase wave is the apparent propagation of a wave front as CRUs exit from their refractory period and spontaneously release Ca2+. A Ca2+ phase wave differs from a “diffusion” wave generated by the fire–diffuse–fire mechanism because nothing, Ca2+ in particular, is actually diffusing. Because nothing is diffusing, phase waves can go through barriers, can pass through each other without annihilation, and can have infinite velocity.
Phase waves and diffusion waves can coexist but it becomes more sensible to talk about phase waves as the first latency distribution of CRU release becomes increasingly narrow [92]. As the first latency distribution narrows many CRUs fire in close succession that can initiate diffusion waves at multiple sites. As the number of initiation sites increases, it becomes harder to discern diffusion waves, ultimately fusing into a cell-wide synchronous SCR. As Ca2+ release becomes more synchronous within the cell, the greater its effectiveness in triggering an AP [81]. Therefore, the notion of phase waves may provide a more useful framework to address the synchronization of spontaneous Ca2+ release between cells and within cells.
Ca2+ waves have a long history. Ca2+ waves are deceptively easy to model, yet models remain fundamentally incomplete. Important questions remain as to the how the spatial distribution of RyRs and IP3Rs shape the initiation and propagation of Ca2+ waves in atrial cells, Purkinje cells, and perhaps in non-mammalian ventricular myocytes. Ca2+ diffusion waves are important for activating contraction in atrial, Purkinje, and non-mammalian ventricular myocytes. Ca2+ phase waves may be more important for understanding the origins of triggered arrhythmias than Ca2+ diffusion waves.
Acknowledgments
This work was supported by NIH grants R01 HL090880 (to LTI and YC) and R03 AG031944 (YC) and startup funds from the University of California, Davis.
Footnotes
Disclosures
None declared.
References
- 1.Natori R. Skinned fibres of skeletal muscle and the mechanism of muscle contraction. A chronological account of the author’s investigations into muscle physiology. Jikeikai Med J. 1986;33:1–74. [Google Scholar]
- 2.Ford LE, Podolsky RJ. Regenerative calcium release within muscle cells. Science. 1970;167:58–9. doi: 10.1126/science.167.3914.58. [DOI] [PubMed] [Google Scholar]
- 3.Endo M, Tanaka M, Ogawa Y. Calcium induced release of calcium from the sarcoplasmic reticulum of skinned skeletal muscle fibers. Nature. 1970;228:34–6. doi: 10.1038/228034a0. [DOI] [PubMed] [Google Scholar]
- 4.Fabiato A, Fabiato F. Excitation–contraction coupling of isolated cardiac fibers with disrupted or closed sarcolemmas. Calcium-dependent cyclic and tonic contractions. Circ Res. 1972;31:293–307. doi: 10.1161/01.res.31.3.293. [DOI] [PubMed] [Google Scholar]
- 5.Ridgway EB, Gilkey JC, Jaffe LF. Free calcium increases explosively in activating medaka eggs. Proc Natl Acad Sci. 1977;74:623–7. doi: 10.1073/pnas.74.2.623. [DOI] [PMC free article] [PubMed] [Google Scholar]
- 6.Gilkey JC, Jaffe LF, Ridgway EB, Reynolds GT. A free calcium wave traverses the activating egg of the medaka, Oryzias latipes. J Cell Biol. 1978;76:448–66. doi: 10.1083/jcb.76.2.448. [DOI] [PMC free article] [PubMed] [Google Scholar]
- 7.Grynkiewicz G, Poenie M, Tsien RY. A new generation of Ca2+ indicators with greatly improved fluorescence properties. J Biol Chem. 1985;260:3440–50. [PubMed] [Google Scholar]
- 8.Wier WG, Cannell MB, Berlin JR, Marban E, Lederer WJ. Cellular and subcellular heterogeneity of [Ca2+]i in single heart cells revealed by fura-2. Science. 1987;235:325–8. doi: 10.1126/science.3798114. [DOI] [PubMed] [Google Scholar]
- 9.Backx PH, De Tombe PP, Van Deen JHK, Mulder BJM, Ter Keurs HEDJ. A model of propagating calcium-induced calcium release mediated by calcium diffusion. J Gen Physiol. 1989;93:963–77. doi: 10.1085/jgp.93.5.963. [DOI] [PMC free article] [PubMed] [Google Scholar]
- 10.Stern MD. Theory of excitation–contraction coupling in cardiac muscle. Biophys J. 1992;63:497–517. doi: 10.1016/S0006-3495(92)81615-6. [DOI] [PMC free article] [PubMed] [Google Scholar]
- 11.Cheng H, Lederer WJ, Cannell MB. Calcium sparks: elementary events underlying excitation-contraction coupling in heart muscle. Science. 1993;262:740–4. doi: 10.1126/science.8235594. [DOI] [PubMed] [Google Scholar]
- 12.Carl SL, Felix K, Caswell AH, Brandt NR, Ball WJ, Vaghy PL, et al. Immunolocalization of sarcolemmal dihydropyridine receptor and sarcoplasmic reticular triadin and ryanodine receptor in rabbit ventricle and atrium. J Cell Biol. 1995;129:673–82. doi: 10.1083/jcb.129.3.673. [DOI] [PMC free article] [PubMed] [Google Scholar]
- 13.Scriven DRL, Dan P, Moore EDW. Distribution of proteins implicated in excitation–contraction coupling in rat ventricular myocytes. Biophys J. 2000;79:2682–91. doi: 10.1016/S0006-3495(00)76506-4. [DOI] [PMC free article] [PubMed] [Google Scholar]
- 14.Chen-Izu Y, McCulle SL, Ward CW, Soeller C, Allen BM, Rabang C, et al. Three-dimensional distribution of ryanodine receptor clusters in cardiac myocytes. Biophys J. 2006;91:1–13. doi: 10.1529/biophysj.105.077180. [DOI] [PMC free article] [PubMed] [Google Scholar]
- 15.Soeller C, Crossman D, Gilbert R, Cannell MB. Analysis of ryanodine receptor clusters in rat and human cardiac myocytes. Proc Natl Acad Sci U S A. 2007;104:14958–63. doi: 10.1073/pnas.0703016104. [DOI] [PMC free article] [PubMed] [Google Scholar]
- 16.Soeller C, Jayasinghe ID, Li P, Holden AV, Cannell MB. Three-dimensional high-resolution imaging of cardiac proteins to construct models of intracellular Ca2+ signalling in rat ventricular myocytes. Exp Physiol. 2009;94:496–508. doi: 10.1113/expphysiol.2008.043976. [DOI] [PubMed] [Google Scholar]
- 17.Baddeley D, Jayasinghe ID, Lam L, Rossberger S, Cannell MB, Soeller C. Optical single-channel resolution imaging of the ryanodine receptor distribution in rat cardiac myocytes. Proc Natl Acad Sci U S A. 2009;106:22275–80. doi: 10.1073/pnas.0908971106. [DOI] [PMC free article] [PubMed] [Google Scholar]
- 18.Franzini-Armstrong C, Protasi F, Ramesh V. Shape, size, and distribution of Ca2+ release units and couplons in skeletal and cardiac muscles. Biophys J. 1999;77:1528–39. doi: 10.1016/S0006-3495(99)77000-1. [DOI] [PMC free article] [PubMed] [Google Scholar]
- 19.Cheng H, Lederer WJ. Calcium sparks. Physiol Rev. 2008;88:1491–545. doi: 10.1152/physrev.00030.2007. [DOI] [PubMed] [Google Scholar]
- 20.Keizer J, Smith GD. Spark-to-wave transition: saltatory transmission of calcium waves in cardiac myocytes. Biophys Chem. 1998;72:87–100. doi: 10.1016/s0301-4622(98)00125-2. [DOI] [PubMed] [Google Scholar]
- 21.Thul R, Smith GD, Coombes S. A bidomain threshold model of propagating calcium waves. J Math Biol. 2008;56:435–63. doi: 10.1007/s00285-007-0123-5. [DOI] [PubMed] [Google Scholar]
- 22.Izu LT, Wier WG, Balke CW. Evolution of cardiac calcium waves from stochastic calcium sparks. Biophys J. 2001;80:103–20. doi: 10.1016/S0006-3495(01)75998-X. [DOI] [PMC free article] [PubMed] [Google Scholar]
- 23.Wussling MHP, Krannich K, Drygalla V, Podhaisky H. Calcium waves in agarose gel with cell organelles: implications of the velocity curvature relationship. Biophys J. 2000;80:2658–66. doi: 10.1016/S0006-3495(01)76235-2. [DOI] [PMC free article] [PubMed] [Google Scholar]
- 24.Thul R, Coombes S, Roderick HL, Bootman MD. Subcellular calcium dynamics in a whole-cell model of an atrial myocyte. Proc Natl Acad Sci U S A. 2012;109:2150–5. doi: 10.1073/pnas.1115855109. [DOI] [PMC free article] [PubMed] [Google Scholar]
- 25.Izu LT, Means SA, Shadid JN, Chen-Izu Y, Balke CW. Interplay of ryanodine receptor distribution and calcium dynamics. Biophys J. 2006;91:95–112. doi: 10.1529/biophysj.105.077214. [DOI] [PMC free article] [PubMed] [Google Scholar]
- 26.Keizer J, Smith GD, Ponce-Dawson S, Pearson JE. Saltatory propagation of Ca2+ waves by Ca2+ sparks. Biophys J. 1998;75:595–600. doi: 10.1016/S0006-3495(98)77550-2. [DOI] [PMC free article] [PubMed] [Google Scholar]
- 27.Subramanian S, Viatchenko-Karpinski S, Lukyanenko V, Gyorke S, Wiesner TF. Underlying mechanisms of symmetric calcium wave propagation in rat ventricular myocytes. Biophys J. 2001;80:1–11. doi: 10.1016/S0006-3495(01)75991-7. [DOI] [PMC free article] [PubMed] [Google Scholar]
- 28.Lu L, Xia L, Ye X, Cheng H. Simulation of the effect of rogue ryanodine receptors on a calcium wave in ventricular myocytes with heart failure. Phys Biol. 2010;7:026005. doi: 10.1088/1478-3975/7/2/026005. [DOI] [PubMed] [Google Scholar]
- 29.Ramay HR, Jafri MS, Lederer WJ, Sobie EA. Predicting local SR Ca(2+) dynamics during Ca(2+) wave propagation in ventricular myocytes. Biophys J. 2010;98:2515–23. doi: 10.1016/j.bpj.2010.02.038. [DOI] [PMC free article] [PubMed] [Google Scholar]
- 30.Swietach P, Spitzer KW, Vaughan-Jones RD. Ca2+-mobility in the sarcoplasmic reticulum of ventricular myocytes is low. Biophys J. 2008;95:1412–27. doi: 10.1529/biophysj.108.130385. [DOI] [PMC free article] [PubMed] [Google Scholar]
- 31.Swietach P, Spitzer KW, Vaughan-Jones RD. Modeling calcium waves in cardiac myocytes: importance of calcium diffusion. Front Biosci. 2010;15:661–80. doi: 10.2741/3639. [DOI] [PMC free article] [PubMed] [Google Scholar]
- 32.Parker I, Zang W-J, Wier WG. Ca2+ sparks involving multiple Ca2+ release sites along Z-lines in rat heart cells. J Physiol. 1996;497:31–8. doi: 10.1113/jphysiol.1996.sp021747. [DOI] [PMC free article] [PubMed] [Google Scholar]
- 33.Lukyanenko V, Gyorke S. Ca2+ sparks and Ca2+ waves in saponin-permeabilized rat ventricular myocytes. J Physiol. 1999;521:575–85. doi: 10.1111/j.1469-7793.1999.00575.x. [DOI] [PMC free article] [PubMed] [Google Scholar]
- 34.Cannell MB, Soeller C. Numerical analysis of ryanodine receptor activation by L-type channel activity in the cardiac muscle diad. Biophys J. 1997;73:112–22. doi: 10.1016/S0006-3495(97)78052-4. [DOI] [PMC free article] [PubMed] [Google Scholar]
- 35.Williams DA, Fogarty KE, Tsien RY, Fay FS. Calcium gradients in single smooth muscle cells revealed by the digital imaging microscope using fura-2. Nature. 1985;318:558–61. doi: 10.1038/318558a0. [DOI] [PubMed] [Google Scholar]
- 36.Takamatsu T, Wier WG. Calcium waves in mammalian heart: quantification of origin, magnitude, waveform, and velocity. FASEB J. 1990;4:1519–25. doi: 10.1096/fasebj.4.5.2307330. [DOI] [PubMed] [Google Scholar]
- 37.Keller M, Kao JP, Egger M, Niggli E. Calcium waves driven by “sensitization” wave-fronts. Cardiovasc Res. 2007;74:39–45. doi: 10.1016/j.cardiores.2007.02.006. [DOI] [PubMed] [Google Scholar]
- 38.Diaz ME, Trafford AW, O’Neill SCO, Eisner DA. Measurement of sarcoplasmic reticulum Ca2+ content and sarcolemmal Ca2+ fluxes in isolated rat ventricular myocytes during spontaneous Ca2+ release. J Physiol. 1997;501:3–16. doi: 10.1111/j.1469-7793.1997.003bo.x. [DOI] [PMC free article] [PubMed] [Google Scholar]
- 39.Gyorke I, Gyorke S. Regulation of the cardiac ryanodine receptor channel by luminal Ca2+ involves luminal Ca2+ sensing sites. Biophys J. 1998;75:2801–10. doi: 10.1016/S0006-3495(98)77723-9. [DOI] [PMC free article] [PubMed] [Google Scholar]
- 40.Sitsapesan R, Williams AJ. Regulation of current flow through ryanodine receptors by luminal Ca2+ J Membr Biol. 1997;159:179–85. doi: 10.1007/s002329900281. [DOI] [PubMed] [Google Scholar]
- 41.Shannon TR, Ginsburg KS, Bers DM. Potentiation of fractional sarcoplasmic reticulum calcium release by total and free intra-sarcoplasmic reticulum calcium concentration. Biophys J. 2000;78:334–43. doi: 10.1016/S0006-3495(00)76596-9. [DOI] [PMC free article] [PubMed] [Google Scholar]
- 42.Terentyev D, Viatchenko-Karpinski S, Valdivia H, Escobar AL, Gyorke S. Luminal Ca2+ controls termination and refractory behavior of Ca2+-induced Ca2+ release in cardiac myocytes. Circ Res. 2002;91:414–20. doi: 10.1161/01.res.0000032490.04207.bd. [DOI] [PubMed] [Google Scholar]
- 43.Gyorke S, Gyorke I, Lukyanenko V, Terentyev D, Viatchenko-Karpinski S, Wiesner TF. Regulation of sarcoplasmic reticulum calcium release by luminal calcium in cardiac muscle. Front Biosci. 2002;7:d1454–63. doi: 10.2741/A852. [DOI] [PubMed] [Google Scholar]
- 44.Sobie EA, Lederer WJ. Dynamic local changes in sarcoplasmic reticulum calcium: physiological and pathophysiological roles. J Mol Cell Cardiol. 2012;52:304–11. doi: 10.1016/j.yjmcc.2011.06.024. [DOI] [PMC free article] [PubMed] [Google Scholar]
- 45.Smith GD, Keizer JE, Stern MD, Lederer WJ, Cheng H. A simple numerical model of calcium spark formation and detection in cardiac myocytes. Biophys J. 1998;75:15–32. doi: 10.1016/S0006-3495(98)77491-0. [DOI] [PMC free article] [PubMed] [Google Scholar]
- 46.Izu LT, Wier WG, Balke CW. Theoretical analysis of the Ca2+ spark amplitude distribution. Biophys J. 1998;75:1144–62. doi: 10.1016/s0006-3495(98)74034-2. [DOI] [PMC free article] [PubMed] [Google Scholar]
- 47.Cheng H, Lederer MR, Xiao R-P, Gomez AM, Zhou Y-Y, Ziman B, et al. Excitation–contraction coupling in heart: new insights from Ca2+ sparks. Cell Calcium. 1996;20:129–40. doi: 10.1016/s0143-4160(96)90102-5. [DOI] [PubMed] [Google Scholar]
- 48.Banyasz T, Chen-Izu Y, Balke CW, Izu LT. A new approach to the detection and statistical classification of Ca2+ sparks. Biophys J. 2007;92:4458–65. doi: 10.1529/biophysj.106.103069. [DOI] [PMC free article] [PubMed] [Google Scholar]
- 49.Izu LT, Mauban JRH, Balke CW, Wier WG. Large currents generate cardiac Ca2+ sparks. Biophys J. 2001;80:88–102. doi: 10.1016/S0006-3495(01)75997-8. [DOI] [PMC free article] [PubMed] [Google Scholar]
- 50.Bridge JHB, Ershler PR, Cannell MB. Properties of Ca2+ sparks evoked by action potentials in mouse ventricular myocytes. J Physiol. 1999;518:469–78. doi: 10.1111/j.1469-7793.1999.0469p.x. [DOI] [PMC free article] [PubMed] [Google Scholar]
- 51.Rios E, Stern MD, Gonzalez A, Pizarro G, Shirokova N. Calcium release flux underlying Ca2+ sparks of frog skeletal muscle. J Gen Physiol. 1999;114:31–48. doi: 10.1085/jgp.114.1.31. [DOI] [PMC free article] [PubMed] [Google Scholar]
- 52.Shkryl VM, Blatter LA, Rios E. Properties of Ca2+ sparks revealed by four-dimensional confocal imaging of cardiac muscle. J Gen Physiol. 2012;139:189–207. doi: 10.1085/jgp.201110709. [DOI] [PMC free article] [PubMed] [Google Scholar]
- 53.de Groot SR, Mazur P. Non-equilibrium thermodynamics. Amsterdam: North Holland Publishing Co; 1962. [Google Scholar]
- 54.Kashyap HK, Annapureddy HV, Raineri FO, Margulis CJ. How is charge transport different in ionic liquids and electrolyte solutions? J Phys Chem B. 2011;115:13212–21. doi: 10.1021/jp204182c. [DOI] [PubMed] [Google Scholar]
- 55.Tan W, Fu C, Fu C, Xie W, Cheng H. An anamalous subdiffusion model for calcium spark in cardiac myocytes. Appl Phys Lett. 2007;91:183901. [Google Scholar]
- 56.Perni S, Iyer VR, Franzini-Armstrong C. Ultrastructure of cardiac muscle in reptiles and birds: optimizing and/or reducing the probability of transmission between calcium release units. J Muscle Res Cell Motil. 2012;33:145–52. doi: 10.1007/s10974-012-9297-6. [DOI] [PubMed] [Google Scholar]
- 57.Forbes MS, Hawkey LA, Sperelakis N. The transverse-axial tubular system (TATS) of mouse myocardium: its morphology in the developing and adult animal. Am J Anat. 1984;170:143–62. doi: 10.1002/aja.1001700203. [DOI] [PubMed] [Google Scholar]
- 58.Forbes MS, Van Niel EE, Purdy-Ramos SI. The atrial myocardial cells of mouse heart: a structural and stereological study. J Struct Biol. 1990;103:266–79. doi: 10.1016/1047-8477(90)90045-e. [DOI] [PubMed] [Google Scholar]
- 59.Forssmann WG, Girardier L. A study of the T system in rat heart. J Cell Biol. 1970;44:1–19. doi: 10.1083/jcb.44.1.1. [DOI] [PMC free article] [PubMed] [Google Scholar]
- 60.Kirk MM, Izu LT, Chen-Izu Y, McCulle SL, Wier WG, Balke CW, et al. Role of the transverse-axial tubule system in generating calcium sparks and calcium transients in rat atrial myocytes. J Physiol. 2003;547:441–51. doi: 10.1113/jphysiol.2002.034355. [DOI] [PMC free article] [PubMed] [Google Scholar]
- 61.Berlin JR. Spatiotemporal changes of Ca2+ during electrically evoked contractions in atrial and ventricular cells. Am J Physiol. 1995;269:H1165–70. doi: 10.1152/ajpheart.1995.269.3.H1165. [DOI] [PubMed] [Google Scholar]
- 62.Huser J, Lipsius SL, Blatter LA. Calcium gradients during excitation–contraction coupling in cat atrial myocytes. J Physiol. 1996;494:641–51. doi: 10.1113/jphysiol.1996.sp021521. [DOI] [PMC free article] [PubMed] [Google Scholar]
- 63.Mackenzie L, Bootman MD, Berridge MJ, Lipp P. Predetermined recruitment of calcium release sites underlies excitation–contraction coupling in rat atrial myocytes. J Physiol. 2001;530:417–29. doi: 10.1111/j.1469-7793.2001.0417k.x. [DOI] [PMC free article] [PubMed] [Google Scholar]
- 64.Woo S-H, Cleeman L, Morad M. Spatiotemporal characteristics of junctional and nonjunctional focal Ca2+ release in rat atrial myocytes. Circ Res. 2003;92:e1–11. doi: 10.1161/01.res.0000051887.97625.07. [DOI] [PubMed] [Google Scholar]
- 65.Izu LT, Banyasz T, Chen-Izu Y. UNESCO—encyclopedia of life support systems: biological, physiological, and health sciences. 2009. Ca2+ waves and the topography of the Ca2+ control system. [Google Scholar]
- 66.Lipp P, Laine M, Tovey SC, Burrell KM, Berridge MJ, Li W, et al. Functional InsP3 receptors that may modulate excitation–contraction coupling in the heart. Curr Biol. 2000;10:939–42. doi: 10.1016/s0960-9822(00)00624-2. [DOI] [PubMed] [Google Scholar]
- 67.Janowski E, Berrios M, Cleemann L, Morad M. Developmental aspects of cardiac Ca(2+) signaling: interplay between RyR- and IP(3)R-gated Ca(2+) stores. Am J Physiol Heart Circ Physiol. 2010;298:H1939–50. doi: 10.1152/ajpheart.00607.2009. [DOI] [PMC free article] [PubMed] [Google Scholar]
- 68.Dan P, Lin E, Huang J, Biln P, Tibbits GF. Three-dimensional distribution of cardiac Na+–Ca2+ exchanger and ryanodine receptor during development. Biophys J. 2007;93:2504–18. doi: 10.1529/biophysj.107.104943. [DOI] [PMC free article] [PubMed] [Google Scholar]
- 69.Venetucci LA, Trafford AW, O’Neill SC, Eisner DA. The sarcoplasmic reticulum and arrhythmogenic calcium release. Cardiovasc Res. 2008;77:285–92. doi: 10.1093/cvr/cvm009. [DOI] [PubMed] [Google Scholar]
- 70.Chin TK, Friedman WF, Klitzner TS. Developmental changes in cardiac myocyte calcium regulation. Circ Res. 1990;67:574–9. doi: 10.1161/01.res.67.3.574. [DOI] [PubMed] [Google Scholar]
- 71.Stuyvers BD, Dun W, Matkovich S, Sorrentino V, Boyden PA, ter Keurs HE. Ca2+ sparks and waves in canine purkinje cells: a triple layered system of Ca2+ activation. Circ Res. 2005;97:35–43. doi: 10.1161/01.RES.0000173375.26489.fe. [DOI] [PMC free article] [PubMed] [Google Scholar]
- 72.Boyden PA, Pu J, Pinto J, ter Keurs HEDJ. Ca2+ transients and Ca2+ waves in Purkinje cells: role in action potential initiation. Circ Res. 2000;86:448–55. doi: 10.1161/01.res.86.4.448. [DOI] [PMC free article] [PubMed] [Google Scholar]
- 73.Boyden PA, Barbhaiya C, Lee T, ter Keurs HEDJ. Nonuniform Ca2+ transients in arrhythmogenic Purkinje cells that survive in the infarcted heart. Cardiovasc Res. 2003;57:681–93. doi: 10.1016/s0008-6363(02)00725-3. [DOI] [PMC free article] [PubMed] [Google Scholar]
- 74.Boyden PA, Dun W, Barbhaiya C, Ter Keurs HE. 2APB- and JTV519(K201)-sensitive micro Ca2+ waves in arrhythmogenic Purkinje cells that survive in infarcted canine heart. Heart Rhythm. 2004;1:218–26. doi: 10.1016/j.hrthm.2004.03.068. [DOI] [PMC free article] [PubMed] [Google Scholar]
- 75.Mironneau J, Macrez N, Morel JL, Sorrentino V, Mironneau C. Identification and function of ryanodine receptor subtype 3 in non-pregnant mouse myometrial cells. J Physiol (Lond) 2002;538:707–16. doi: 10.1113/jphysiol.2001.013046. [DOI] [PMC free article] [PubMed] [Google Scholar]
- 76.Jiang D, Xiao B, Li X, Chen SR. Smooth muscle tissues express a major dominant negative splice variant of the type 3 Ca2+ release channel (ryanodine receptor) J Biol Chem. 2003;278:4763–9. doi: 10.1074/jbc.M210410200. [DOI] [PubMed] [Google Scholar]
- 77.Zima AV, Blatter LA. Inositol-1,4,5-trisphosphate-dependent Ca2+ signalling in cat atrial excitation–contraction coupling and arrhythmias. J Physiol. 2004;555:607–15. doi: 10.1113/jphysiol.2003.058529. [DOI] [PMC free article] [PubMed] [Google Scholar]
- 78.Ramos-Franco J, Fill M, Mignery GA. Isoform-specific function of single inositol 1,4,5-trisphosphate receptor channels. Biophys J. 1998;75:834–9. doi: 10.1016/S0006-3495(98)77572-1. [DOI] [PMC free article] [PubMed] [Google Scholar]
- 79.Di Maio A, Ter Keurs HE, Franzini-Armstrong C. T-tubule profiles in Purkinje fibres of mammalian myocardium. J Muscle Res Cell Motil. 2007;28:115–21. doi: 10.1007/s10974-007-9109-6. [DOI] [PubMed] [Google Scholar]
- 80.Wier WG, Beuckelmann DJ. Sodium-calcium exchange in mammalian heart: current–voltage relation and intracellular calcium concentration. Mol Cell Biochem. 1989;89:6. doi: 10.1007/BF00220759. [DOI] [PubMed] [Google Scholar]
- 81.Schlotthauer K, Bers DM. Sarcoplasmic reticulum Ca(2+) release causes myocyte depolarization. Underlying mechanism and threshold for triggered action potentials. Circ Res. 2000;87:774–80. doi: 10.1161/01.res.87.9.774. [DOI] [PubMed] [Google Scholar]
- 82.Beuckelmann DJ, Wier WG. Sodium-calcium exchange in guinea-pig cardiac cells: exchange current and changes in intracellular Ca2+ J Physiol. 1989;414:499–520. doi: 10.1113/jphysiol.1989.sp017700. [DOI] [PMC free article] [PubMed] [Google Scholar]
- 83.Berlin JR, Cannell MB, Lederer WJ. Cellular origins of the transient inward current in cardiac myocytes. Role of fluctuations and waves of elevated intracellular calcium. Circ Res. 1989;65:115–26. doi: 10.1161/01.res.65.1.115. [DOI] [PubMed] [Google Scholar]
- 84.Karagueuzian HS, Katzung BG. Voltage-clamp studies of transient inward current and mechanical oscillations induced by ouabain in ferret papillary muscle. J Physiol (Lond) 1982;327:255–71. doi: 10.1113/jphysiol.1982.sp014230. [DOI] [PMC free article] [PubMed] [Google Scholar]
- 85.Kass RS, Lederer WJ, Tsien RW, Weingart R. Role of calcium ions in transient inward currents and after contractions induced by strophanthidin in cardiac Purkinje fibers. J Physiol. 1978;281:187–208. doi: 10.1113/jphysiol.1978.sp012416. [DOI] [PMC free article] [PubMed] [Google Scholar]
- 86.Ferrier GR, Moe GK. Effect of calcium on acetylstrophanthidin-induced transient depolarizations in canine Purkinje tissue. Circ Res. 1973;33:508–15. doi: 10.1161/01.res.33.5.508. [DOI] [PubMed] [Google Scholar]
- 87.Xie Y, Sato D, Garfinkel A, Qu Z, Weiss JN. So little source, so much sink: requirements for afterdepolarizations to propagate in tissue. Biophys J. 2010;99:1408–15. doi: 10.1016/j.bpj.2010.06.042. [DOI] [PMC free article] [PubMed] [Google Scholar]
- 88.Chen W, Asfaw M, Shiferaw Y. The statistics of calcium-mediated focal excitations on a one-dimensional cable. Biophys J. 2012;102:461–71. doi: 10.1016/j.bpj.2011.12.045. [DOI] [PMC free article] [PubMed] [Google Scholar]
- 89.Katra RP, Laurita KR. Cellular mechanism of calcium-mediated triggered activity in the heart. Circ Res. 2005;96:535–42. doi: 10.1161/01.RES.0000159387.00749.3c. [DOI] [PubMed] [Google Scholar]
- 90.Myles RC, Wang L, Kang C, Bers DM, Ripplinger CM. Local beta-adrenergic stimulation overcomes source-sink mismatch to generate focal arrhythmia. Circ Res. 2012;110:1454–64. doi: 10.1161/CIRCRESAHA.111.262345. [DOI] [PMC free article] [PubMed] [Google Scholar]
- 91.Lamont C, Luther PW, Balke CW, Wier WG. Intercellular Ca2+ waves in rat heart muscle. J Physiol. 1998;512:669–76. doi: 10.1111/j.1469-7793.1998.669bd.x. [DOI] [PMC free article] [PubMed] [Google Scholar]
- 92.Wasserstrom JA, Shiferaw Y, Chen W, Ramakrishna S, Patel H, Kelly JE, et al. Variability in timing of spontaneous calcium release in the intact rat heart is determined by the time course of sarcoplasmic reticulum calcium load. Circ Res. 2010;107:1117–26. doi: 10.1161/CIRCRESAHA.110.229294. [DOI] [PMC free article] [PubMed] [Google Scholar]
- 93.Miura M, Boyden PA, ter Keurs HEDJ. Ca2+ waves during triggered propagated contractions in intact trabeculae Determinants of the velocity of propagation. Circ Res. 1999;84:1459–68. doi: 10.1161/01.res.84.12.1459. [DOI] [PubMed] [Google Scholar]
- 94.ter Keurs HE, Wakayama Y, Miura M, Shinozaki T, Stuyvers BD, Boyden PA, et al. Arrhythmogenic Ca(2+) release from cardiac myofilaments. Prog Biophys Mol Biol. 2006;90:151–71. doi: 10.1016/j.pbiomolbio.2005.07.002. [DOI] [PubMed] [Google Scholar]
- 95.ter Keurs HE, Wakayama Y, Sugai Y, Price G, Kagaya Y, Boyden PA, et al. Role of sarcomere mechanics and Ca2+ overload in Ca2+ waves and arrhythmias in rat cardiac muscle. Ann N Y Acad Sci. 2006;1080:248–67. doi: 10.1196/annals.1380.020. [DOI] [PubMed] [Google Scholar]
- 96.Daniels MC, ter Keurs HE. Spontaneous contractions in rat cardiac trabeculae. Trigger mechanism and propagation velocity. J Gen Physiol. 1990;95:1123–37. doi: 10.1085/jgp.95.6.1123. [DOI] [PMC free article] [PubMed] [Google Scholar]
- 97.Sobie EA, Song LS, Lederer WJ. Restitution of Ca(2+) release and vulnerability to arrhythmias. J Cardiovasc Electrophysiol. 2006;17(Suppl 1):S64–70. doi: 10.1111/j.1540-8167.2006.00385.x. [DOI] [PMC free article] [PubMed] [Google Scholar]