Abstract
Biological age (BA) is useful for examining differences in aging rates. Nevertheless, little consensus exists regarding optimal methods for calculating BA. The aim of this study is to compare the predictive ability of five BA algorithms. The sample included 9,389 persons, aged 30–75 years, from National Health and Nutrition Examination Survey III. During the 18-year follow-up, 1,843 deaths were counted. Each BA algorithm was compared with chronological age on the basis of predictive sensitivity and strength of association with mortality. Results found that the Klemera and Doubal method was the most reliable predictor of mortality and performed significantly better than chronological age. Furthermore, when included with chronological age in a model, Klemera and Doubal method had more robust predictive ability and caused chronological age to no longer be significantly associated with mortality. Given the potential of BA to highlight heterogeneity, the Klemera and Doubal method algorithm may be useful for studying a number of questions regarding the biology of aging.
Key Words: Biological age, Biomarkers, Mortality.
AGING is often defined as the gradual functional and structural decline of an organism, resulting in an increasing risk of disease, impairment, and mortality over the life span (1). Although aging can be seen in nearly all species, the rate of age-related decline is not universal (2). Aging is thought to be reliant upon a balance between exposure and resiliency (3), and as a result, heterogeneity arises within and between species due to variations in exposure to damaging properties—diverse environments—as well as the bodies’ innate ability to cope. Consequently, age, when measured chronologically, may not be a reliable indicator of the body’s rate of decline or physiological breakdown, but rather, serves only as a proxy for the rate of aging. Nevertheless, in order to better assess an individual’s degree of aging, and thus residual life span or susceptibility to disease, new approaches need to be developed that provide predictive power beyond what is gained from measuring chronological age (CA) alone.
The idea that age-related biological changes could be measured was first proposed by Alex Comfort in 1969 (4). Given the number of cellular and systemic changes that accompany the aging process, it is believed that such changes could be quantified through the identification and measurement of biomarkers of aging (5). Over the years, significant work has gone into trying to indentify biomarkers of aging that can be used to study senescence in humans or animal models (6); however, there has been little success thus far. It has been suggested that, due to the complexity of the aging process—particularly in humans—no single biomarker is likely to be identified that accurately measures the rate of biological aging (7). On the other hand, unlike individual biomarkers of aging, biological age (BA) estimates facilitate the merging of multiple biomarkers into a single latent variable, which may better account for the complexity of the aging process. The coalescing of various measures into a single multifaceted biomarker may prove useful in both biological research—to study how genes, evolution, and environment impact the rate of aging—as well as in public health research or clinical practice—to identify individuals at increased risk of disability and disease.
Although several articles have been published on the measurement of BA, there is little consensus regarding the method in which BA should be calculated or the validity of such measures. Over the years, a number of varying mathematical algorithms have been suggested, such as multiple linear regression (MLR; [8–11]), principal component analysis (PCA; [12–15]), and more recently, a method proposed by Klemera and Doubal (16). However, the validation and comparison of such estimates has been limited (17), particularly when it comes to utilizing BA for predicting mortality.
Given that the intrinsic value of BA is impossible to measure, the validation of calculated estimates proves difficult. Nevertheless, the reliability and validity of BA measurements should be evaluated using common criteria. For example, BA calculations should produce realistic measurements, within the limits of recorded life span. BA estimations should also be able to identify at-risk individuals prior to them entering a disease state. Many of the methods currently used in identifying at-risk individuals rely upon indexes of disease, frailty, or cumulative deficits of biomarkers reaching a predetermined cutoff (18–20). However, these estimates may not be useful in examining young- or middle-aged adults and therefore, may not be ideal for use in prevention. Finally, BA should satisfy the criteria set forth for biomarkers of aging, which states that (a) A biomarker needs to be a better predictor of multiple age-associated biological and functional outcomes than is chronological age; (b) Biomarkers should be able to predict both remaining longevity and disease-specific mortality in a population of which 90% of the individuals are still alive; and (c) The method of measurement should not affect life expectancy or any future age-related measurements (21).
Using these criteria, the focus of this study is to compare BA measures, estimated using various methods that have been proposed in the literature, with the goal of determining their validity and usefulness in predicting mortality outcomes, within a large nationally representative human sample.
Methods
Study Population
The study population included participants from the third National Health and Nutrition Examination Survey (NHANES III), a nationally representative, cross-sectional study conducted by the National Center for Health Statistics between 1988 and 1994. Data for NHANES III were collected from at-home interviews and examinations taking place at a Mobile Examination Center. Further details of recruitment, procedures, population characteristics, and study design are available through the Centers for Disease Control and Prevention (22). This study was limited to adults aged 30–75 years, in order to ensure that participants were old enough to be experiencing detectable age-related changes in biomarkers, yet not too old as to represent a select group with above-average health and longevity. Of the 12,517 NHANES subjects, aged 30–75 years, our final analytic sample included 9,389 participants. Excluded participants consisted of those with missing data on one or more of the biomarker measures.
Selection of Biomarkers
Biomarkers were selected based upon knowledge regarding their role or dependency on the aging process, independence, use in previous BA or biomarkers of aging studies (14,23), their availability in the NHANES data set, and the statistical significance and strength of their relationship with CA. The 21 biomarkers considered in our analysis can be classified into seven domains: (1) Metabolic Function—glycated hemoglobin, total cholesterol, and high-density lipoprotein; (2) Cardiac Function—systolic blood pressure, diastolic blood pressure, and pulse; (3) Lung Function—forced expiratory volume; (4) Kidney Function—serum creatinine and serum urea nitrogen; (5) Liver Function—serum alkaline phosphatase and serum albumin; (6) Immune Function and Inflammation: C-reactive protein, cytomegalovirus optical density, lymphocyte percent, mononuclear percent, and granulocyte percent; and (7) Cell Blood Count—white blood cell count, red blood cell count, platelet count, hemoglobin, and hematocrit. Pearson correlations were then used to assess the relationships of the 21 potential biomarkers with age (Table 1). Ten biomarkers that significantly correlated with CA at r > .10 were selected for inclusion into the BA estimates. These biomarkers included C-reactive protein, serum creatinine, glycated hemoglobin, systolic blood pressure, serum albumin, total cholesterol, cytomegalovirus optical density, serum alkaline phosphatase, forced expiratory volume, and serum urea nitrogen.
Table 1.
Pearson Correlation Coefficients Between Chronological Age (CA) and Biomarkers*
| Pearson Correlation With CA | |
|---|---|
| C-reactive protein (mg/dL) | 0.122*** |
| Serum creatinine (mg/dL) | 0.148*** |
| Glycated hemoglobin (%) | 0.261*** |
| Serum albumin (g/dL) | −0.220*** |
| Serum total cholesterol (mg/dL) | 0.288*** |
| Cytomegalovirus optical density | 0.261*** |
| Serum urea nitrogen (mg/dL) | 0.296*** |
| Serum alkaline phosphatase SI (U/L) | 0.218*** |
| Forced expiratory volume (mL) | −0.535*** |
| Systolic blood pressure | 0.501*** |
| Serum high-density lipoproteins (mg/dL) | 0.026** |
| Hemoglobin (g/dL) | −0.052*** |
| Lymphocyte percent | −0.033** |
| White blood cell count | −0.020* |
| Hematocrit (%) | −0.036** |
| Red blood cell count | −0.096*** |
| Mononuclear percent | 0.074*** |
| Granulocyte percent | 0.010 |
| Platelet count | −0.046*** |
| Pulse (beats/min) | 0.054*** |
| Diastolic blood pressure | 0.047*** |
Note: ***p < .0001. **p < .01. *p < .05.
BA Estimates
Principal component analysis.—
PCA is a method used to reduce a set of variables to a small number of factors, called principal components, while optimizing the amount of variance explained. BA was calculated in accordance with the method proposed by Nakamura and colleagues (13). The first principal component score was used to signify a BA score (BAS). Given that BAS is not in units of years, scores were transformed to allow for comparisons with CA. Finally, BA models were further adjusted by adding a z-score to the BA estimates, as suggested by Nakamura and colleagues (13), in order to account for systematic errors that may cause over or under estimations of BA.
Multiple linear regression.—
Although MLR remains one of the most commonly used methods for the calculation of BA, it has encountered criticism given the risk of multicollinearity in the models, as well as the potential for estimates to regress toward the mean (17). Using MLR, BA is assumed to be equal to the predicted CA of an individual, equation (1), and is based upon the relationship of true (measured) CA and several biomarkers (m):
 |
(1) |
Two BA scores were calculated using sex-stratified MLR. The first incorporated all 10 biomarkers, and the second used only those selected by the PCA method. The results from the equations were then standardized so that the mean BA of participants of a given age was equal to CA.
Klemera and Doubal’s method.—
In their article, “A new approach to the concept and computation of biological age,” Klemera and Doubal present a new mathematical algorithm, claiming that it is the optimum method for the calculation of BA (16). The BA estimates are based upon minimizing the distance between m regression lines and m biomarker points, within an m dimensional space of all biomarkers. In their article, the authors used computer-generated simulations to validate the method they propose. They defined BA as equal to CA, plus some random variable,  with a mean of zero and a variance
 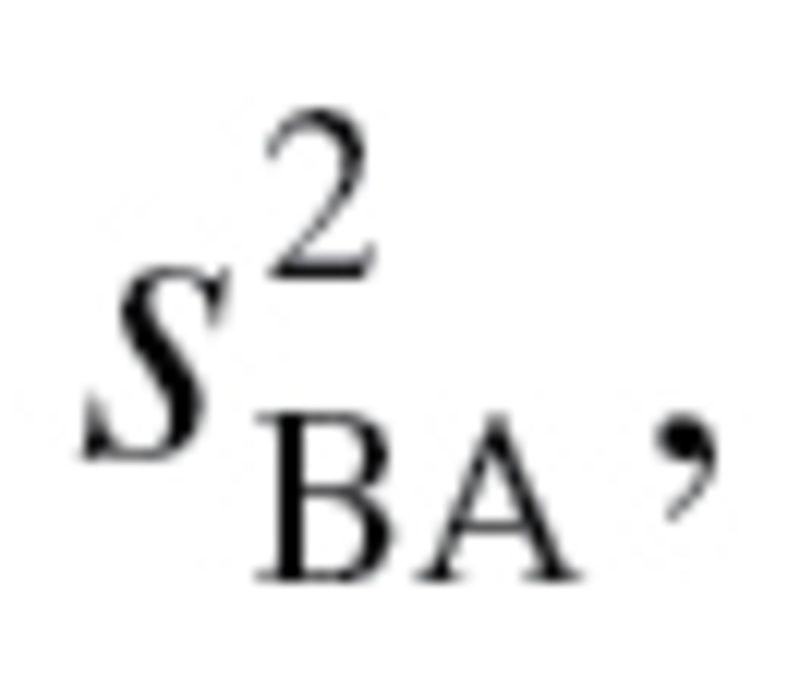 (2). Klemera and Doubal presented two alternative methods for calculating the optimum estimates of BA, equations (2) and (3), in which the later method utilizes CA in the final equation—and using simulations, was shown to be superior:
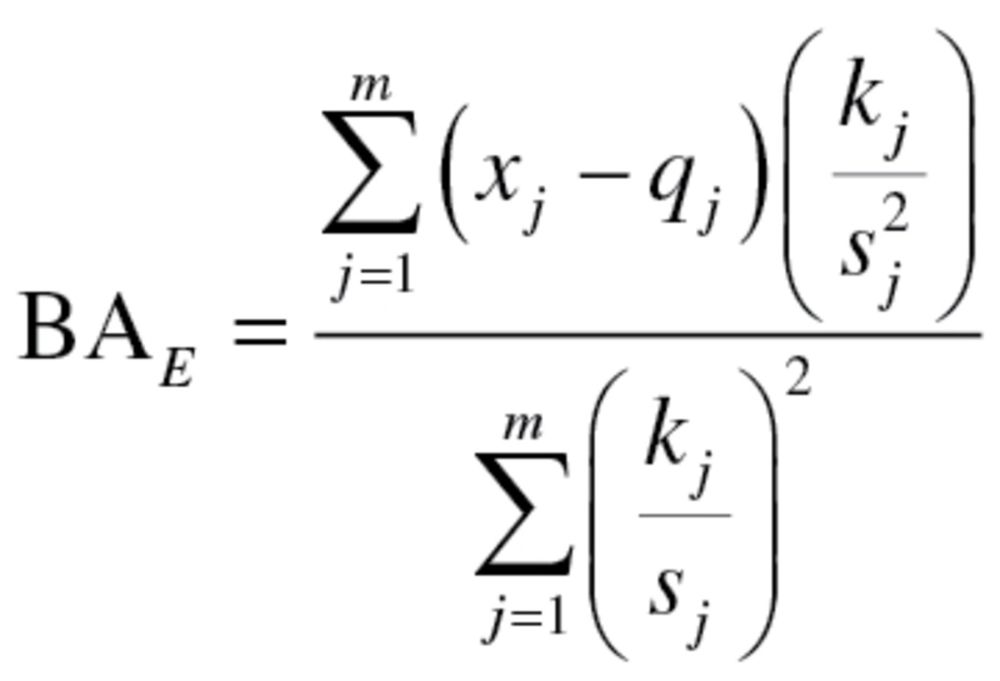 |
(2) |
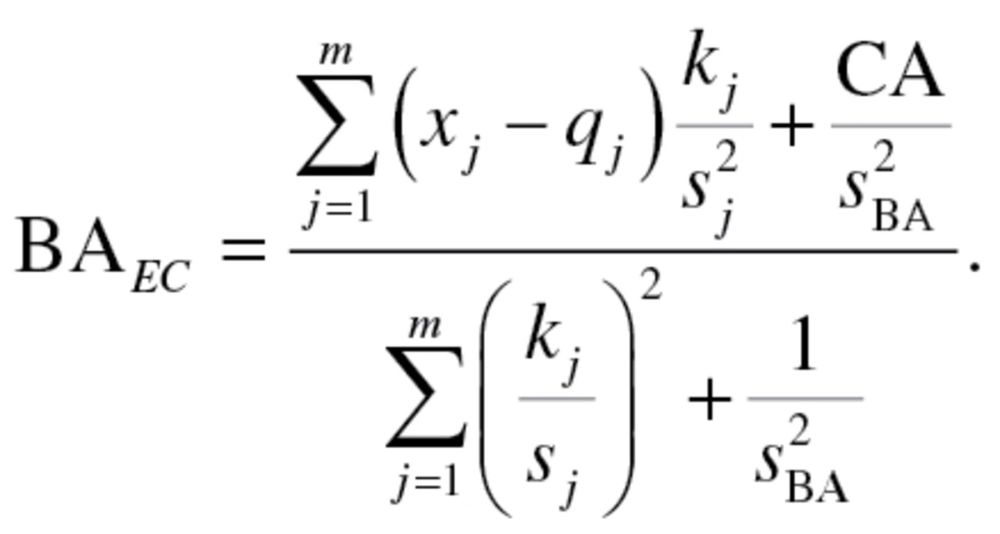 |
(3) |
In order to produce an estimate for BA, using equation (3), 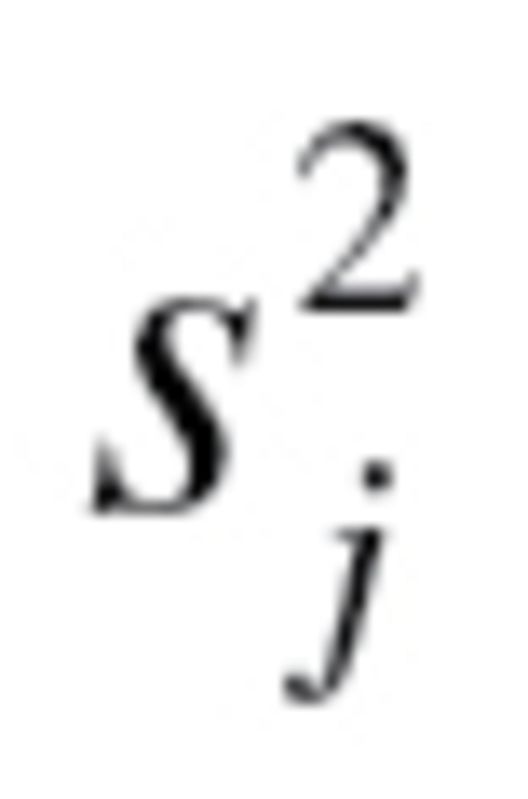 and
and 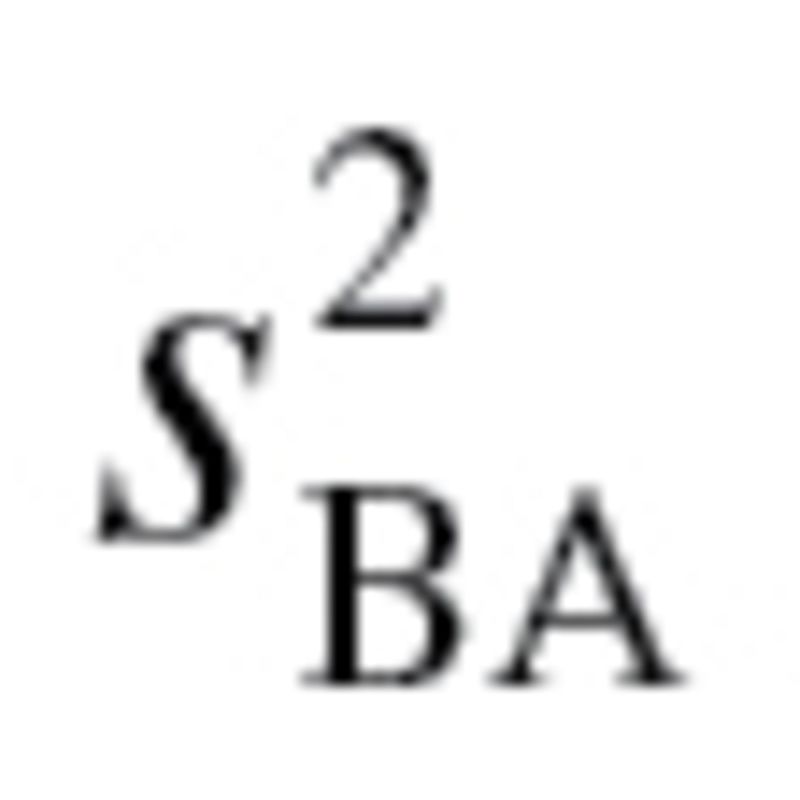 have to be calculated. The value,
 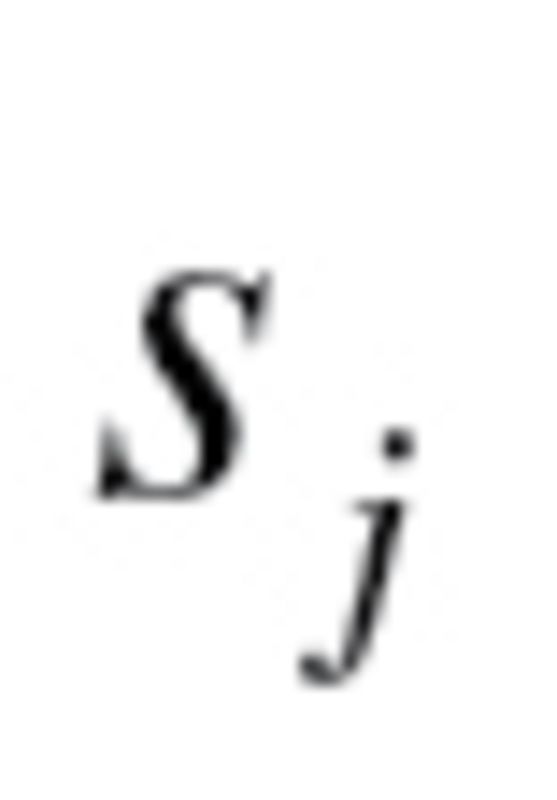 , represents the root mean squared error of a biomarker regressed on BA. However, given that BA is not measurable, root mean squared errors from the regressions between each biomarker and CA, rather than BA, were used, as suggested by Cho and colleagues (17). Finally, in order to calculate
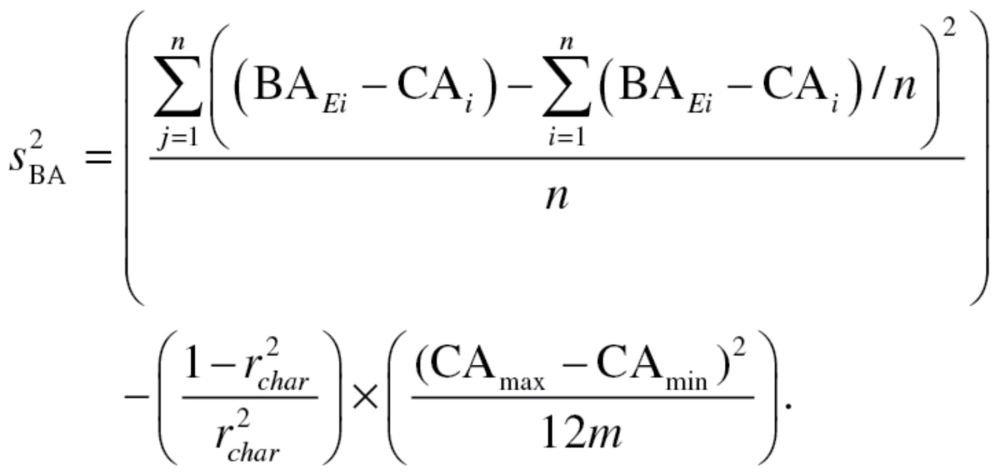
 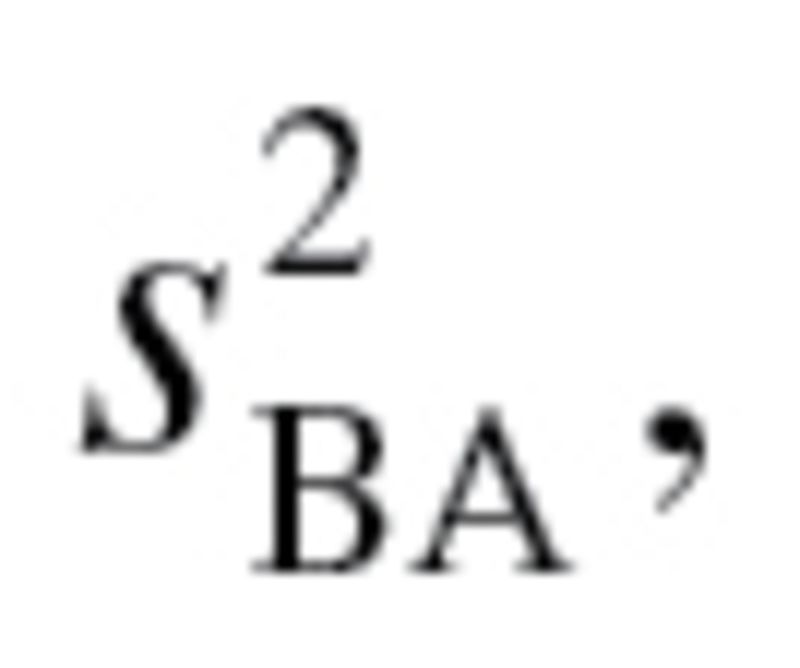 equation (2), as well as the following two equations were used sequentially:
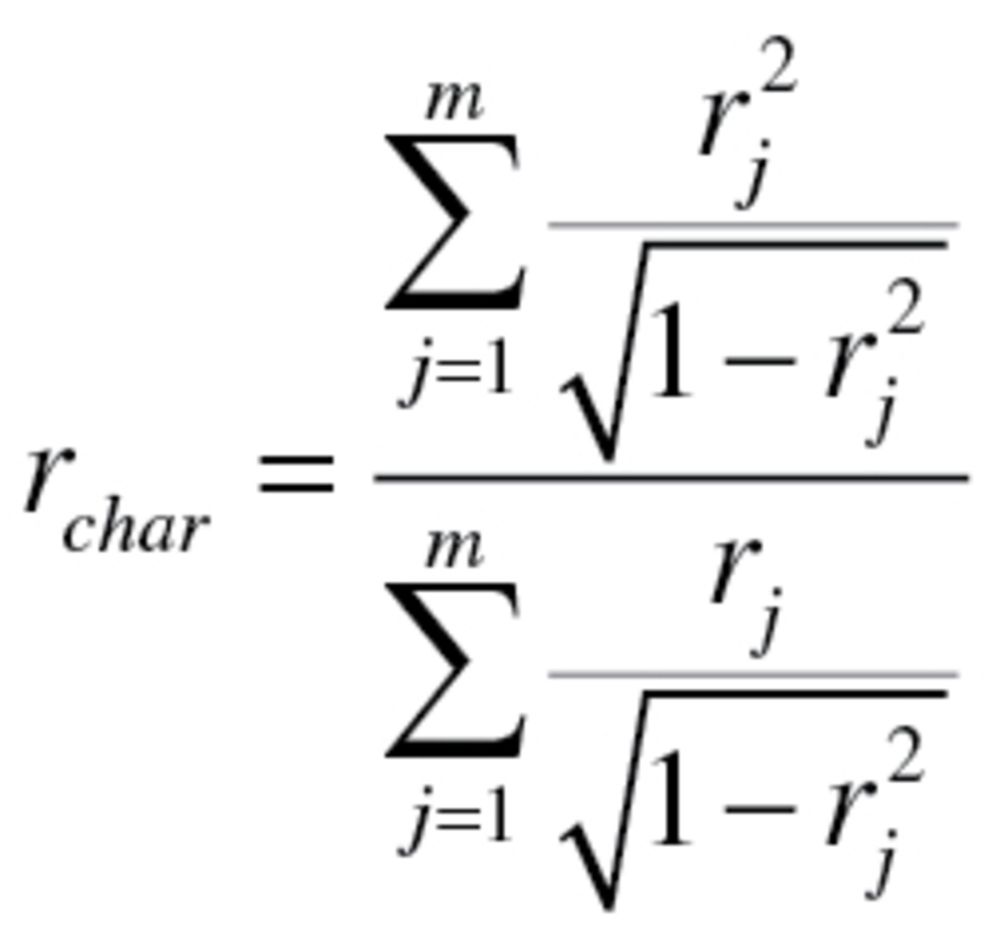 |
(4) |
 |
(5) |
The value 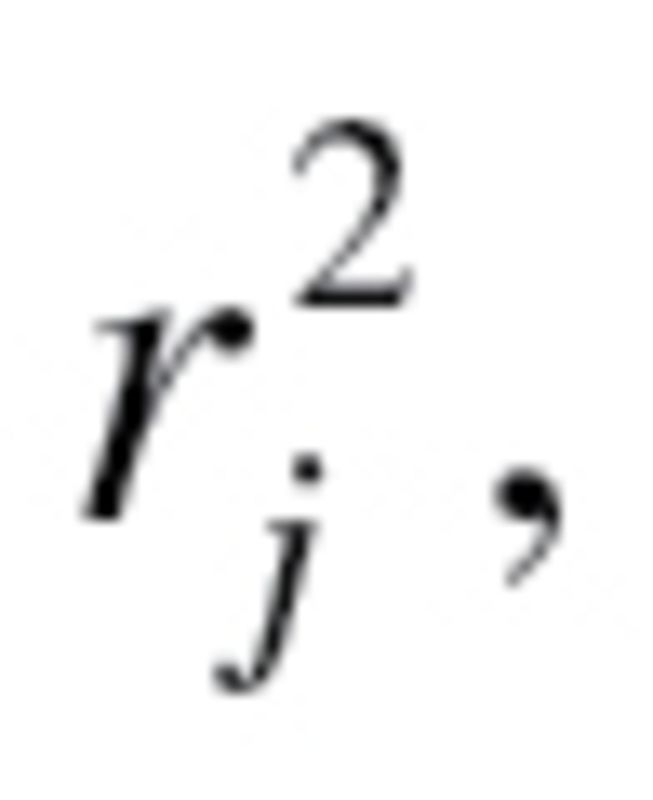 used to calculate the characteristic correlation coefficient from equation (4), refers to the variance explained by regression CA on m biomarkers. Finally, in accordance with the assumption made by Klemera and Doubal,
 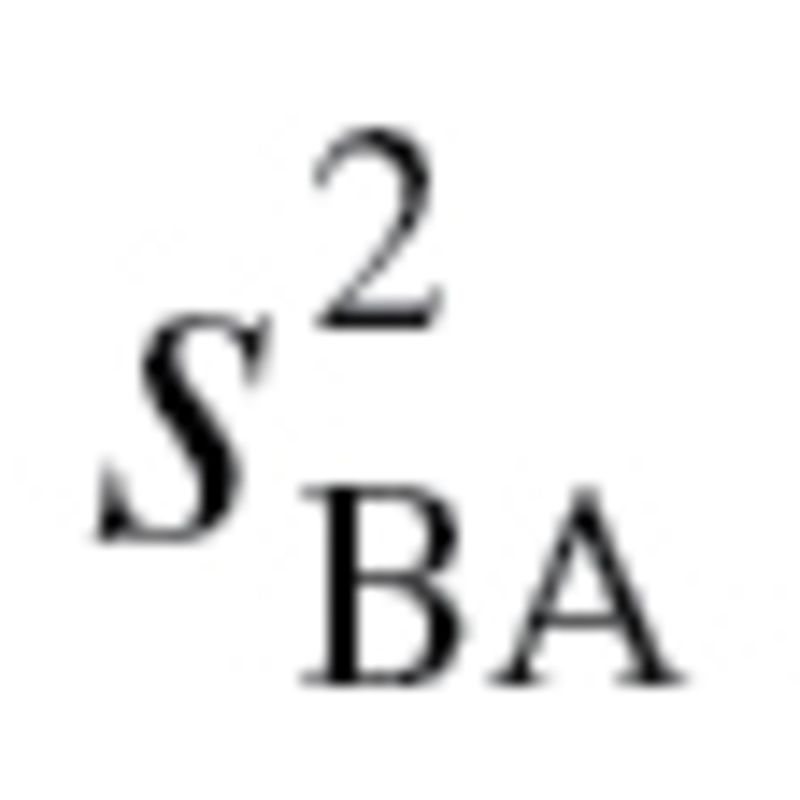 was transformed so that
  maintained the same mean but was now linearly increasing with age, with a difference of five between subjects at
  and
and  . As with the MLR approach, two BA scores were calculated—one based on all 10 biomarkers and one based on the biomarkers selected by PCA. For further details of the methods and equations refer to the article by Klemera and Doubal (16).
Mortality.—
Mortality follow-up was based on linked data from records taken from the National Death Index through 2006, provided through NHANES III (22). Data on mortality status was available for all participants. During analysis, deaths due to HIV, violence, or accidents, were censored given that mortality is being used to validate measures of aging, and thus variables should be evaluated on their ability to predict age-related, rather than stochastic deaths. Finally, given that participants took part in NHANES III at different points in time between 1988 and 1994, potential mortality follow-up time ranged from 12–18 years, causing some participants who were alive in 2006, to be censored at less than 18 years. Nevertheless, time of enrollment in NHANES III was random and should therefore not confound results.
Statistical analysis for validation and comparisons of BA algorithms.—
Receiver operating characteristics curves were used to determine the sensitivity of CA and the five BA estimates in predicting mortality up to 18 years after follow-up. To test the sensitivity of the variables for different age cohorts, CA and BA estimates were first compared using the entire age sample and then rerun using two age-stratified groups—those 30–59 years old and those 60–75 years old. Next, five cox proportional hazard models, containing both CA and one of the BA estimates, were used to investigate which one had more predictive power when included in the same model. Given that BA estimates were calculated separately for men and women, all analysis were run controlling for sex.
Results
Sample characteristics, are shown in Table 2. Approxi mately half (51.83%) of the participants were women, and ranged in age from 30 to 75 years, with a mean of 47.46 years. Additionally, 78.5% of participants were aged 30–59 years, whereas 21.5% were aged 60–75 years. Overall, 1,843 participants died between baseline and follow-up. Due to NHANES procedures, participants who were presumed alive did not have equivalent follow-up times and were therefore considered censored during analysis. In addition to those assumed alive, 88 participants were censored due to deaths from HIV, violence, or accidents. For living participants, total person-years was 112,734.08 years, whereas for those who were assumed deceased, total person-years was 16,642.75 years.
Table 2.
Characteristics for the Full Sample and by Age Group
| Full Sample (N = 9,389) | Aged 30–59 years (n = 6,603) | Aged 60–75 years (n = 2,786) | |
|---|---|---|---|
| Age (y), M | 47.46 (14.05) | 42.14 (9.65) | 66.86 (4.21) |
| Female (%) | 51.83 | 51.23 | 54.01 |
| Died, (N) | 1,843 | 566 | 1,277 |
| Censored, (N) | 7,546 | 6,037 | 1,509 |
| Person-years (M) | 14.17 (3.35) | 14.65 (2.83) | 12.43 (3.92) |
| C-reactive protein (mg/dL), M | 0.42 (0.67) | 0.39 (0.60) | 0.53 (0.79) |
| Creatinine (mg/dL), M | 1.07 (0.29) | 1.05 (0.29) | 1.14 (0.27) |
| Glycated hemoglobin (%), M | 5.42 (1.08) | 5.33 (1.08) | 5.76 (1.02) |
| Albumin (g/dL), M | 4.16 (0.38) | 4.19 (0.40) | 4.06 (0.30) |
| Total cholesterol (mg/dL), M | 209.36 (46.20) | 204.99 (47.14) | 225.29 (40.46) |
| Cytomegalovirus optical density, M | 1.78 (1.29) | 1.66 (1.38) | 2.25 (0.93) |
| Alkaline phosphatase (U/L), M | 81.66 (32.59) | 79.24 (31.90) | 90.50 (32.84) |
| Forced expiratory volume (mL), M | 3102.16 (1002.91) | 3304.69 (979.62) | 2363.82 (705.09) |
| Urea nitrogen (mg/dL), M | 14.38 (5.28) | 13.71 (4.97) | 16.82 (5.34) |
| Systolic blood pressure, M | 123.13 (18.77) | 119.47 (17.18) | 136.49 (16.90) |
Algorithm Results
Principal component analysis.—
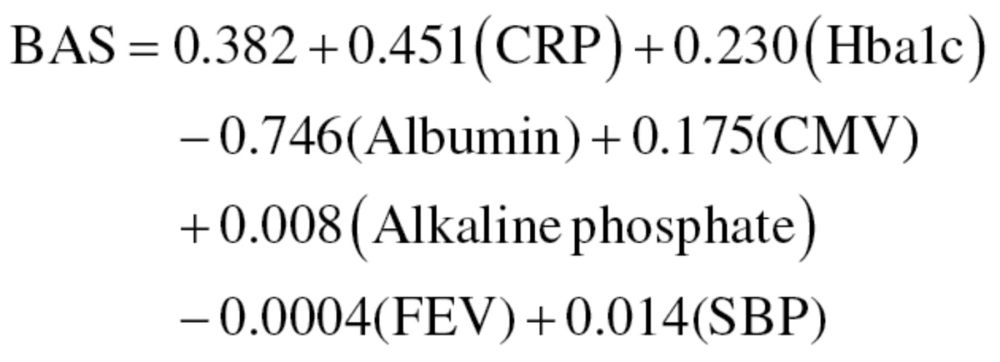
The 10 biomarkers selected from the Pearson correlation were included in the PCA and run separately for men and women. Of the biomarkers included, seven significantly loaded on the first principal component, for both men and women. The biomarkers that reached significance for men were C-reactive protein, glycated hemoglobin, serum albumin, cytomegalovirus optical density, serum alkaline phosphatase, forced expiratory volume, and systolic blood pressure. For women, the biomarkers that reached significance were C-reactive protein, glycated hemoglobin, total cholesterol, serum alkaline phosphatase, forced expiratory volume, serum urea nitrogen, and systolic blood pressure. CA was then loaded and unloaded to test the stability of the candidate biomarkers and the relationship between age and the first principal component. Using the variable set consisting of the nine biomarkers and CA, the first principal component had an eigenvalue of 2.61 for men and 3.23 for women. Furthermore, CA had PCA loadings of 0.694 and 0.740 for men and women, respectively. In the final PCA, with the nine biomarkers, excluding CA, the first principal component for men had an eigenvalue of 2.08, whereas for women, the first principal component had an eigenvalue of 2.67. The nine variables produced BAS equation (6) for men and equation (7) for women:
 |
(6) |
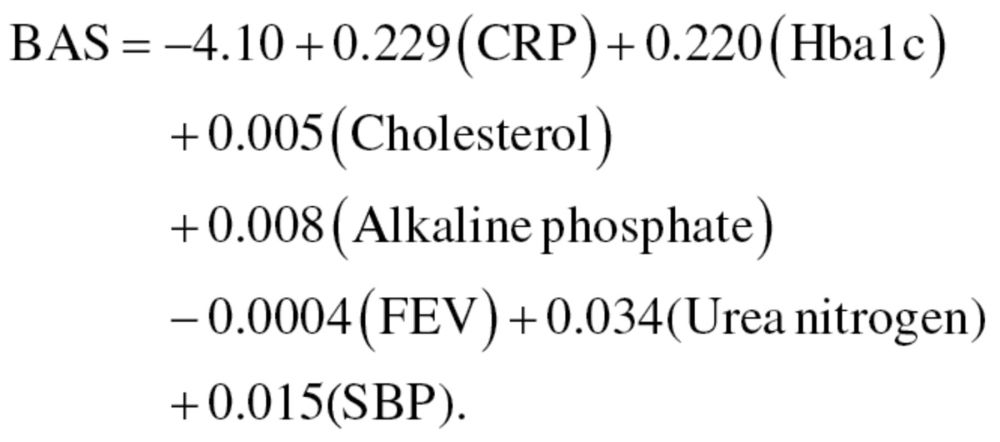 |
(7) |
BAS estimates were then transformed to years by multiplying them by the standard deviation of CA and summing with mean CA, as shown in equation (8), for men, and equation (9) for women:
 |
(8) |
 |
(9) |
Finally, true BA (TBA) was calculated by adding z scores, calculated as  , to BA values, where
  is the individual’s CA for the group,
  is mean CA and b is the coefficient of BA regressed on CA.
Multiple linear regression.—Sex-stratified MLR was performed utilizing the 10 biomarker variables as predictors of CA. Correlation between biomarkers were run to examine multicollinearity, which is a common concern of the MLR method. Among the 10 biomarkers, all correlation coefficients were found to be within acceptable levels (<r = .40). The biomarkers in the MLR models accounted for 50.9% and 58.8% of the variance in CA for men and women, respectively (r 2 men = .509; r 2 women = .588). As noted by Ingram (24), unexplained variance is necessary to capture the differences in BA among individuals of a given CA. From the regression models, the following equations were used to generate BA estimates for men, equation (10), and women, equation (11):
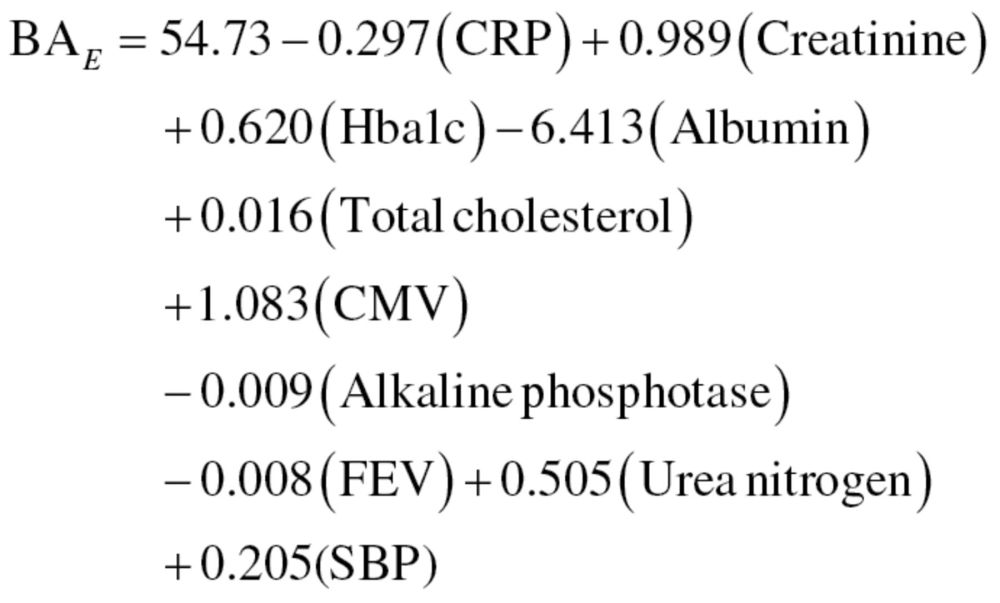 |
(10) |
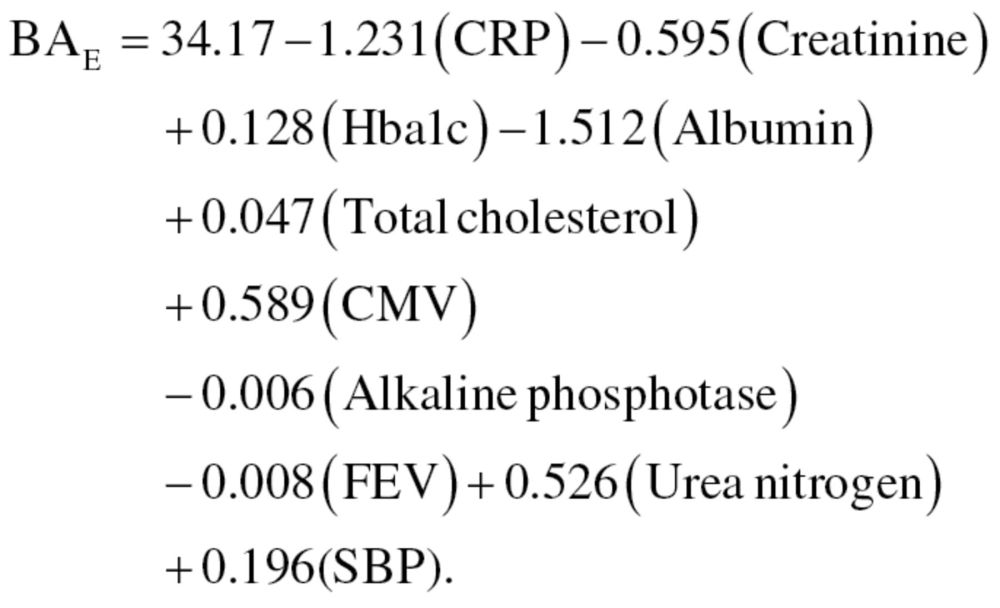 |
(11) |
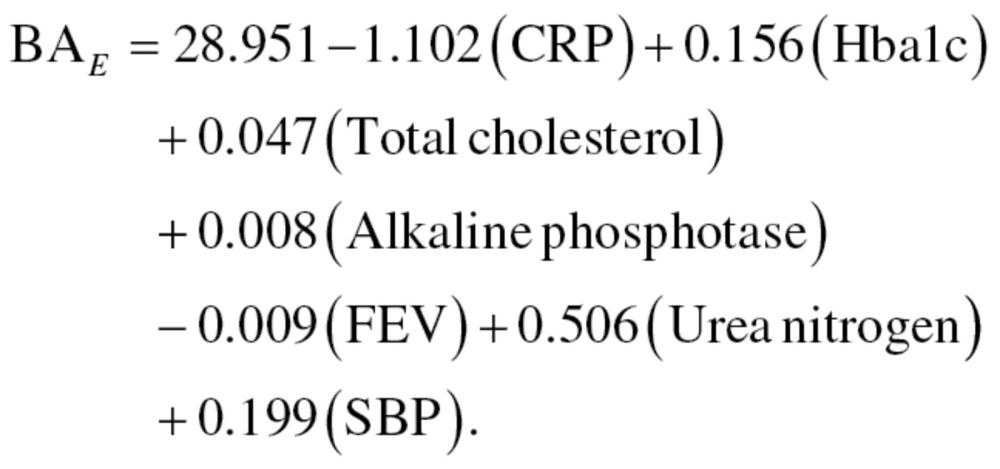
The results from the equations were then standardized so that the mean BA for participants of a given age was equal to CA. Finally, the MLR method was run again, using only those variables selected from the PCA, thus, producing a new equation for men, equation (12), and women, equation (13):
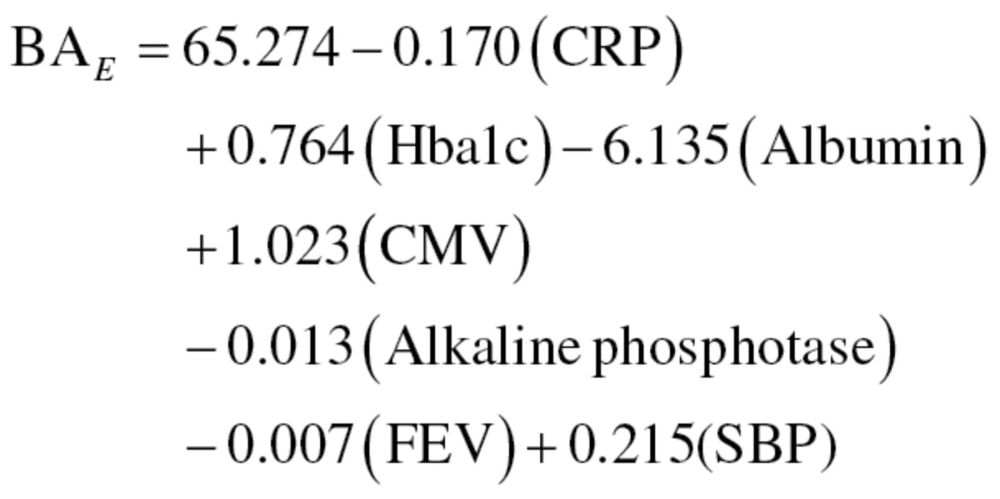 |
(12) |
 |
(13) |
Like the results from the first regression equations, results were then standardized to assure that the mean BA of participants of a given age was equal to CA. We will refer to the results from the MLR method using the 10 biomarkers and 7 biomarkers as MLR1 and MLR2, respectively.
Klemera and Doubal method.—
The  calculated using equation (4) for KDM1 (10 biomarkers) was .360 and .432 for men and women, respectively, whereas the
  for KDM2 (7 biomarkers) was .399 and .474 for men and women, respectively. For KDM1,
 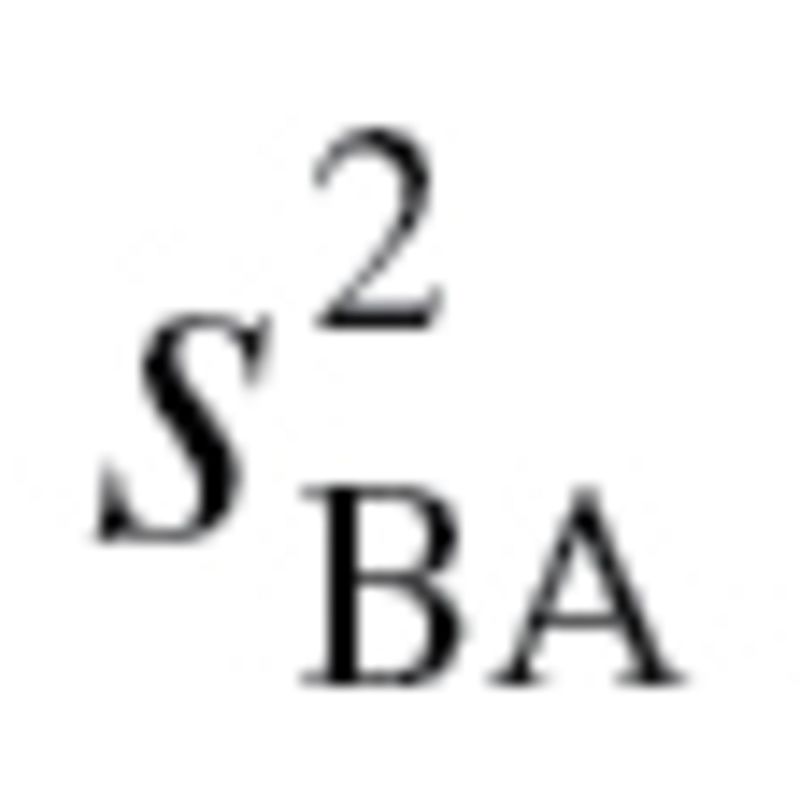 , which was used to calculate
  in equation (3), ranged from 57.66 to 158.58 with a mean of 99.12 for men and ranged from 43.13 to 133.79 with a mean of 77.67 for women, whereas for KDM2,
  ranged from 72.45 to 182.55 with a mean of 118.03 for men and ranged from 36.23 to 121.40 with a mean of 68.44 for women.
BA estimates and mortality.—
Means, standard deviations, and ranges for CA and the five BA estimates are listed in Table 3. Although the three algorithms had very similar means for BA, the ranges of these estimates varied significantly. When calculated using PCA, BA ranged from approximately 19 to 185 years, whereas the two BA estimates calculated by MLR ranged from about 15 to 110 years when all 10 biomarkers were used in the estimates, and from 17 to 106 years when only the 7 biomarkers selected by PCA were used. The estimates for KDM1 ranged from approximately 24 to 110 years, whereas the estimate for KDM2 ranged from 22 to 101 years when calculated using 7 biomarkers.
Table 3.
Mean Age Estimates for Chronological Age (CA) and Biological Age (BA)
| Mean (SD) | Minimum | Maximum | |
|---|---|---|---|
| CA | 47.46 (14.05) | 30.00 | 75.00 |
| BA from PCA (7 biomarkers) | 47.93 (14.08) | 19.07 | 185.18 |
| BA from MLR1 (10 biomarkers) | 47.46 (15.63) | 15.12 | 110.29 |
| BA from MLR2 (7 biomarkers) | 47.46 (15.63) | 15.50 | 106.33 |
| BA from KDM1 (10 biomarkers) | 47.47 (15.07) | 23.80 | 110.28 |
| BA from KDM2 (7 biomarkers) | 47.46 (15.08) | 20.98 | 100.64 |
Note: PCA = principal component analysis; MLR1 = multiple linear regression with 10 variables; MLR2 = multiple linear regression with 7 variables; KDM1 = Klemera and Doubal method with 10 variables; and KDM2 = Klemera and Doubal method with 7 variables.
Results from the receiver operating characteristics curve comparisons for the whole sample and for the age-stratified subsamples are listed in Table 4. For the model containing all participants (aged 30–75 years), each of the five BA estimates produced significantly (p < .05) better mortality predictions than CA. Similar results were found when comparing BA estimates to CA within young and old age groups. Overall, using receiver operating characteristics curves, the best performing BA estimates were those employing the KDM algorithm. For the whole sample and the young group, KDM2 had the highest sensitivity. (AUCaged 30–75 = 0.851 and AUCaged 30–59 = 0.779), compared with CA (AUCaged 30–75 = 0.827 and AUCaged 30–59 = 0.731), whereas for the older group, KDM1 had the highest sensitivity (AUCaged 60–75 = 0.735) compared with CA (AUCaged 60–75 = 0.670).
Table 4.
ROC Curve Comparisons Between Chronological Age (CA) and Estimates of Biological Age (BA) for the Full Sample and by Age Group
| Full Sample | Aged 30–59 years | Aged 60–75 years | ||||
|---|---|---|---|---|---|---|
| AUC (SE) | p Value | AUC (SE) | p Value | AUC (SE) | p Value | |
| CA | 0.827 (0.0052) | Reference | 0.731 (0.0108) | Reference | 0.670 (0.0067) | Reference |
| PCA | 0.840 (0.0050) | <.0001 | 0.773 (0.0105) | <.0001 | 0.712 (0.0062) | <.0001 |
| MLR1 | 0.847 (0.0050) | <.0001 | 0.762 (0.0106) | <.0001 | 0.727 (0.0061) | <.0001 |
| MLR2 | 0.849 (0.0049) | <.0001 | 0.772 (0.0105) | <.0001 | 0.727 (0.0077) | <.0001 |
| KDM1 | 0.853 (0.0049) | <.0001 | 0.774 (0.0104) | <.0001 | 0.743 (0.0059) | <.0001 |
| KDM2 | 0.854 (0.0049) | <.0001 | 0.779 (0.0103) | <.0001 | 0.737 (0.0077) | <.0001 |
Note: AUC = area under the ROC curve; PCA = principal component analysis; MLR1 = multiple linear regression with 10 variables; MLR2 = multiple linear regression with 7 variables; KDM1 = Klemera and Doubal method with 10 variables; and KDM2 = Klemera and Doubal method with 7 variables.
Results for individual cox proportional hazard models are listed in Table 5. Overall, BA estimated by KDM2 produced the most robust results, When BA and CA were both included in the same model, the hazard ratio (HR) for the BA estimate, calculated using KDM2, was statistically significant and found to be higher than the HR for CA (HRBA_KDM2: 1.09, 95% CI: 1.08–1.09; HRCA: 1.01, 95% CI: 0.99–1.02). Moreover, KDM2 had the most robust predictive power of any of the BA estimates and was the only one that produced a null association between CA and mortality. Although the results weren’t as robust, CA was also found to have less predictive power than KDM1 (HRBA_KDM1: 1.08, 95% CI: 1.07–1.09; HRCA: 1.01, 95% CI: 1.01–1.02), MLR1 (HRBA_MLR1: 1.07, 95% CI: 1.06–1.07; HRCA: 1.03, 95% CI: 1.02–1.04), and MLR2 (HRBA_MLR2: 1.08, 95% CI: 1.07–1.08; HRCA: 1.02, 95% CI: 1.01–1.03), however, in all three models, CA remained statistically significant. Finally, in the model that included CA and PCA, both were statistically significant, however, CA was found to be more robust (HRBA_PCA: 1.03, 95% CI: 1.03–1.04; HRCA: 1.06, 95% CI: 1.06–1.07).
Table 5.
Individual Cox Proportional Hazard Models Containing Chronological Age (CA) and One of Five Biological Age (BA) Estimates
| CA | BA | |||
|---|---|---|---|---|
| HR (95% CI) | SE | HR (95% CI) | SE | |
| Model 1 (BA = PCA) | ||||
| Log likelihood = −15,025.53 | 1.06 (1.06–1.07)*** | 0.003 | 1.03 (1.03–1.04)*** | 0.001 |
| Nagelkerke R 2 = 0.258 | ||||
| Model 2 (BA = MLR1) | ||||
| Log likelihood = −15,038.34 | 1.03 (1.02–1.04)*** | 0.004 | 1.07 (1.06–1.07)*** | 0.003 |
| Nagelkerke R 2 = 0.256 | ||||
| Model 3 (BA = MLR2) | ||||
| Log likelihood = −15,014.63 | 1.02 (1.01–1.03)*** | 0.004 | 1.08 (1.07–1.08)*** | 0.003 |
| Nagelkerke R 2= 0.260 | ||||
| Model 4 (BA = KDM1) | ||||
| Log likelihood = −14,974.76 | 1.01 (1.01–1.02)*** | 0.004 | 1.08 (1.07–1.09)*** | 0.003 |
| Nagelkerke R 2 = 0.267 | ||||
| Model 5 (BA = KDM2) | ||||
| Log likelihood = −14,975.42 | 1.01 (0.99–1.02) | 0.004 | 1.09 (1.08–1.09)*** | 0.004 |
| Nagelkerke R 2 = 0.267 | ||||
| N = 9,439 and Number of events = 1,843 | ||||
Notes: PCA= principal component analysis; MLR1 = multiple linear regression with 10 variables; MLR2 = multiple linear regression with 7 variables; KDM1 = Klemera and Doubal method with 10 variables; and KDM2 = Klemera and Doubal method with 7 variables.
In each model, BA is calculated by either PCA, MLR1 with 10 variables, MLR2 with 7 variables, KDM1 with 10 variables, or KDM2 with 7 variables.
All models are controlled for sex.
***p < .0001. **p < .01. *p < .05.
Discussion
The KDM algorithm, particularly when variables are chosen by PCA performed the best overall. KDM2 produced plausible estimates of BA and was a more reliable predictor of mortality than CA or any of the other BA algorithms in multiple age cohorts. Furthermore, KDM2 outperformed CA when included in the same model—accounting for the entire association between CA and mortality. The method of selecting variables through PCA to include in the KDM2 estimate is in accordance with the model’s assumptions. Klemera and Doubal suggest that all the biomarkers included in the algorithm be functionally uncorrelated and that factor analysis or PCA be used to reach this goal (16).
Although this study provides evidence for the usefulness of the KDM algorithm for estimating BA, there is potential for improvement. Advancements in technology and increasing knowledge regarding the aging process have facilitated the identification and measurement of more sophisticated and theoretically conceptual age-associated biomarkers, such as telomere length, measures of oxidative damage, mitochondrial oxygen consumption, neuroendocrine secretion levels, and cyclin-dependent kinase inhibitor 2A (p16Ink4a) expression (6,25–27). Furthermore, among the oldest–old, a number of physical performance and blood cell count measures have been shown to be useful biomarkers of aging (28). The equation proposed by Klemera and Doubal provides researchers with the potential to combine many of these distinct biomarkers into a single measure, better capturing the complexity of the aging process.
The risks for a range of chronic conditions increase significantly over the life span, given the diversity of structures and systems in which age-related degradation operates on (1). According to evolutionary theories of aging, particularly Kirkwood’s Disposable Soma theory (29), living is accompanied by exposure to damaging properties, which innate protective and repair mechanisms are set-up to guard against. However, the degree of protection is optimized to increase evolutionary fitness and investment that surpasses reproductive needs is thus avoided. As a result, some degree of damage is accumulated at varying structural and functional levels over the lifetime, increasing as fecundity declines.
BA estimates are meant to measure an individual’s level of damage accumulation and when measured longitudinally, can be used to track the trajectory of damage for a period of time. Consequently, reliable BA estimates may facilitate the investigation of a number of questions related to the biology of aging. For instance, changes in BA should mirror changes in the rate of aging as a result of genes or environmental conditions—such as caloric restriction, crowding, heat shock, psychological stress, or exposure to reactive oxygen species—which alter energy allocation for maintenance and repair, or the degree of damaging properties (30–34). Finally, although most experiments have relied on average or maximum life span to serve as a measure for studying how various factors affect the rate of aging, BA allows for the investigation of alterations in the rate of aging at points other than the end of life and may facilitate the identification of robust versus frail individuals prior to death (35).
Although BA estimated by KDM2 was found to be a highly sensitive and specific predictor of mortality, there are limitations within this study that should be discussed. First, the use of cross-sectional data means that mortality selection has changed the sample and this may confound the results. However, to mitigate the potential bias, the sample was limited to those aged 75 and younger. Second, although other useful physiological measures exist, biomarkers used in BA calculations were limited to those available in NHANES III. Third, biomarker data was available for 75% of the NHANES sample aged 30–75 years, potentially resulting in a selection bias. Given that participants may not be missing at random, additional analyses were run to check for differences between included and excluded participants. When compared with the analytic sample, excluded individuals had a similar sex distribution but were found to be an average of 3 years older and were more likely to die between baseline and follow-up. Finally, although we used a large nationally representative sample to generate the equation for BA, it may not be appropriate when examining other populations with dissimilar environmental or genetic characteristics. For this reason, more work is needed to identify a population that would be the most appropriate from which to generate an equation for BA that represents human aging in general.
In a large representative sample, the algorithm proposed by Klemera and Doubal was able to predict mortality better than more commonly used methods, such as PCA and MLR. Furthermore, the estimates using KDM2 produced significantly more information regarding the risk of mortality, than is generated by CA alone. Given its ability to use a single measure to combine a number of varying biomarkers, KDM accounts for the complexity of aging in its measurement. In moving forward, BA estimates, similar to the one proposed by Klemera and Doubal, may be useful phenotypic traits for examining behavioral, environmental, or heritable factors that affect the heterogeneity of aging and life span. Finally, the development and validation of a BA construct is valuable given its impact on our theoretical understanding of the aging process and may facilitate future development of preventative interventions with implications for health and longevity.
Funding
This research was supported by the National Institute on Aging grant T32AG0037.
References
- 1. Yin D, Chen K. The essential mechanisms of aging: Irreparable damage accumulation of biochemical side-reactions. Exp Gerontol. 2005; 40: 455–465 [DOI] [PubMed] [Google Scholar]
- 2. Hayflick L. Biological aging is no longer an unsolved problem. Ann N Y Acad Sci. 2007; 1100: 1–13. 10.1196/annals.1395.001 [DOI] [PubMed] [Google Scholar]
- 3. Yashin AI, Manton KG, Vaupel JW. Mortality and aging in a heterogeneous population: a stochastic process model with observed and unobserved variables. Theor Popul Biol. 1985; 27: 154–175 [DOI] [PubMed] [Google Scholar]
- 4. Comfort A. Test-battery to measure ageing-rate in man. Lancet. 1969; 2: 1411–1415 [DOI] [PubMed] [Google Scholar]
- 5. Kirkwood TB. Alex Comfort and the measure of aging. Exp Gerontol. 1998; 33: 135–140 [DOI] [PubMed] [Google Scholar]
- 6. Johnson TE. Recent results: biomarkers of aging. Exp Gerontol. 2006; 41: 1243–1246 [DOI] [PubMed] [Google Scholar]
- 7. Sprott RL. Biomarkers of aging and disease: introduction and definitions. Exp Gerontol. 2010; 45: 2–4 [DOI] [PubMed] [Google Scholar]
- 8. Hollingsworth JW, Hashizume A, Jablon S. Correlations between tests of aging in Hiroshima subjects–an attempt to define “physiologic age”. Yale J Biol Med. 1965; 38: 11–26 [PMC free article] [PubMed] [Google Scholar]
- 9. Takeda H, Inada H, Inoue M, Yoshikawa H, Abe H. Evaluation of biological age and physical age by multiple regression analysis. Med Inform (Lond). 1982; 7: 221–227 [DOI] [PubMed] [Google Scholar]
- 10. Krøll J, Saxtrup O. On the use of regression analysis for the estimation of human biological age. Biogerontology. 2000; 1: 363–368 [DOI] [PubMed] [Google Scholar]
- 11. Bae CY, Kang YG, Kim S, et al. Development of models for predicting biological age (BA) with physical, biochemical, and hormonal parameters. Arch Gerontol Geriatr. 2008; 47: 253–265 [DOI] [PubMed] [Google Scholar]
- 12. Hofecker G, Skalicky M, Kment A, Niedermüller H. Models of the biological age of the rat. I. A factor model of age parameters. Mech Ageing Dev. 1980; 14: 345–359 [DOI] [PubMed] [Google Scholar]
- 13. Nakamura E, Miyao K, Ozeki T. Assessment of biological age by principal component analysis. Mech Ageing Dev. 1988; 46: 1–18 [DOI] [PubMed] [Google Scholar]
- 14. Nakamura E, Miyao K. A method for identifying biomarkers of aging and constructing an index of biological age in humans. J Gerontol A Biol Sci Med Sci. 2007; 62: 1096–1105 [DOI] [PubMed] [Google Scholar]
- 15. MacDonald SW, Dixon RA, Cohen AL, Hazlitt JE. Biological age and 12-year cognitive change in older adults: findings from the Victoria Longitudinal Study. Gerontology. 2004; 50: 64–81 [DOI] [PubMed] [Google Scholar]
- 16. Klemera P, Doubal S. A new approach to the concept and computation of biological age. Mech Ageing Dev. 2006; 127: 240–248 [DOI] [PubMed] [Google Scholar]
- 17. Cho IH, Park KS, Lim CJ. An empirical comparative study on biological age estimation algorithms with an application of Work Ability Index (WAI). Mech Ageing Dev. 2010; 131: 69–78 [DOI] [PubMed] [Google Scholar]
- 18. Mitnitski AB, Graham JE, Mogilner AJ, Rockwood K. Frailty, fitness and late-life mortality in relation to chronological and biological age. BMC Geriatr. 2002; 2: 1 [DOI] [PMC free article] [PubMed] [Google Scholar]
- 19. Kulminski AM, Ukraintseva SV, Culminskaya IV, et al. Cumulative deficits and physiological indices as predictors of mortality and long life. J Gerontol A Biol Sci Med Sci. 2008; 63: 1053–1059 [DOI] [PMC free article] [PubMed] [Google Scholar]
- 20. Seplaki CL, Goldman N, Glei D, Weinstein M. A comparative analysis of measurement approaches for physiological dysregulation in an older population. Exp Gerontol. 2005; 40: 438–449 [DOI] [PubMed] [Google Scholar]
- 21. Butler RN, Sprott R, Warner H, et al. Biomarkers of aging: from primitive organisms to humans. J Gerontol A Biol Sci Med Sci. 2004; 59: B560–B567 [DOI] [PubMed] [Google Scholar]
- 22. Centers for Disease Control and Prevention (CDC), National Center for Health Statistics (NCHS) National Health and Nutrition Examination Survey Data Hyattsville, MD: CDC; http://www.cdc.gov/nchs/nhanes/nh3data.htm [Google Scholar]
- 23. Crimmins E, Vasunilashorn S, Kim JK, Alley D. Biomarkers related to aging in human populations. Adv Clin Chem. 2008; 46: 161–216 [DOI] [PMC free article] [PubMed] [Google Scholar]
- 24. Ingram DK. Key questions in developing biomarkers of aging. Exp Gerontol. 1988; 23: 429–434 [DOI] [PubMed] [Google Scholar]
- 25. Starr JM, Shiels PG, Harris SE, et al. Oxidative stress, telomere length and biomarkers of physical aging in a cohort aged 79 years from the 1932 Scottish Mental Survey. Mech Ageing Dev. 2008; 129: 745–751 [DOI] [PubMed] [Google Scholar]
- 26. Balaban RS, Nemoto S, Finkel T. Mitochondria, oxidants, and aging. Cell. 2005; 120: 483–495 [DOI] [PubMed] [Google Scholar]
- 27. Krishnamurthy J, Torrice C, Ramsey MR, et al. Ink4a/Arf expression is a biomarker of aging. J Clin Invest. 2004; 114: 1299–1307 [DOI] [PMC free article] [PubMed] [Google Scholar]
- 28. Martin-Ruiz C, Jagger C, Kingston A, et al. Assessment of a large panel of candidate biomarkers of ageing in the Newcastle 85+ study. Mech Ageing Dev. 2011; 132: 496–502 [DOI] [PubMed] [Google Scholar]
- 29. Kirkwood TB, Austad SN. Why do we age? Nature. 2000; 408: 233–238 [DOI] [PubMed] [Google Scholar]
- 30. Masoro EJ. Caloric restriction and aging: an update. Exp Gerontol. 2000; 35: 299–305 [DOI] [PubMed] [Google Scholar]
- 31. Kenyon C. A conserved regulatory system for aging. Cell. 2001; 105: 165–168 [DOI] [PubMed] [Google Scholar]
- 32. Verbeke P, Fonager J, Clark BF, Rattan SI. Heat shock response and ageing: mechanisms and applications. Cell Biol Int. 2001; 25: 845–857 [DOI] [PubMed] [Google Scholar]
- 33. McEwen BS. Sex, stress and the hippocampus: allostasis, allostatic load and the aging process. Neurobiol Aging. 2002; 23: 921–939 [DOI] [PubMed] [Google Scholar]
- 34. Pham-Huy LA, He H, Pham-Huy C. Free radicals, antioxidants in disease and health Int J Biomed Sci. 2008; 4: 89–96 [PMC free article] [PubMed] [Google Scholar]
- 35. Karasik D, Demissie S, Cupples LA, Kiel DP. Disentangling the genetic determinants of human aging: biological age as an alternative to the use of survival measures. J Gerontol A Biol Sci Med Sci. 2005; 60: 574–587 [DOI] [PMC free article] [PubMed] [Google Scholar]


