

Abstract
Polycystic ovary syndrome (PCOS) is a complex, heterogeneous disorder of uncertain etiology. Recent studies suggested that insulin resistance (IR) plays an important role in the development of PCOS. In the current study, we aimed to investigate the molecular mechanism of IR in PCOS. We employed genome-wide methylated DNA immunoprecipitation (MeDIP) analysis to characterize genes that are differentially methylated in PCOS patients vs. healthy controls. Besides, we also identified the differentially methylated genes between patients with PCOS-non-insulin resistance (PCOS-NIR) and PCOS-insulin resistance (PCOS-IR). A total of 79 genes were differentially methylated between PCOS-NIR vs. PCOS-IR patients, and 40 genes were differentially methylated in PCOS patients vs. healthy controls. We analyzed these differentially methylated genes by constructing regulatory networks and protein-protein interaction (PPI) networks. Further, Gene Ontology (GO) and pathway enrichment analysis were also performed to investigate the biological functions of networks. We identified multiple categories of genes that were differentially methylated between PCOS-NIR and PCOS-IR patients, or between PCOS patients and healthy controls. Significantly, GO categories of immune response were differentially methylated in PCOS-IR vs. PCOS-NIR. Further, genes in cancer pathways were also differentially methylated in PCOS-NIR vs. PCOS-IR patients or in PCOS patients vs. healthy controls. The results of this current study will help to further understand the mechanism of PCOS.
Introduction
Polycystic ovary syndrome (PCOS) is a complex, heterogeneous disorder of uncertain etiology. Strong evidence suggest that it can be classified as a genetic [1], [2], [3] and epigenetic disorders [4]. Such evidence include the familial clustering of cases, greater concordance in monozygotic compared with dizygotic twins and heritability of endocrine and metabolic features of PCOS [5]. PCOS is one of the leading causes of female subfertility and is seen in approximately 5%–10% of women of 12–45 years old [6], [7], [8].
The features of PCOS include chronic anovulation or few ovulations, polycystic ovaries enlargement and hyperandrogenism. In addition, PCOS patients are often accompanied with insulin resistance (IR) and β-cell dysfunction [9]. Further, patients with PCOS have decreased conception rate, and increased prevalence rates of spontaneous abortion and gestational diabetes [10], [11]. Besides, PCOS patients are at higher risk of suffering from endometrial carcinoma. Recent studies show that PCOS patient's incidence of metabolic syndrome (MS) is also higher [12], which is associated with cardiovascular diseases and IR. At present, many scholars have been focusing on the relationship between IR and PCOS, and results show that PCOS patients' endocrine condition and their reproduction can be relieved by ameliorating their IR. Life style adjustment can be an efficient way to achieve this goal. Besides, oral hypoglycemic agents are also subscribed to treat the IR in PCOS patients [13].
Recent studies have elaborated that inappropriate epigenetic reprogramming is an important contributing factor for PCOS [14], [15], [16]. However, the concrete mechanisms of epigenetic alterations and downstream signal cross-talk responsible for PCOS are remaining largely unknown. We employed genome-wide methylated DNA immunoprecipitation (MeDIP) analysis to characterize methylated genes in patients with PCOS vs. healthy controls. Besides, we also identified the differentially methylated genes between patients with PCOS-non-insulin resistance (PCOS-NIR) and PCOS-insulin resistance (PCOS-IR).
Materials and Methods
Sample collection
The study was approved by the institutional review board of Renji Hospital, Shanghai Jiao Tong University School of Medicine, and written informed consent was obtained from all patients. All clinical investigations were conducted according to the principles expressed in the Declaration of Helsinki. Our subjects included 10 unrelated female patients with PCOS (5 PCOS-NIR patients and 5 PCOS-IR patients) and 5 unrelated female healthy controls. These subjects were selected from an existing cohort of 86 cases and 44 controls, which were recruited at Renji Hospital affiliated to Shanghai Jiao Tong University School of Medicine. PCOS was defined according to criteria of the Androgen Excess Society (AES) at 2006 [17]. All cases and controls in this study did not take hormone therapy for at least 3 months. Serum total testosterone (TT) and fasting insulin (FINS) were assayed by radioimmunoassay (RIA) (Beckman Coulter, Inc. Shanghai, China). Serum free testosterone (FT) and sex hormone binding globulin (SHBG) were determined by RIA kit (Beckman Coulter, Inc. California, USA) according to the manufacturer's instructions. Serum fasting blood-glucose (FBG) was determined by the glucose oxidase method (Sysmex Corporation, Shanghai, China). Typical values for the free androgen index (FAI; calculated by the equation FAI = TT×100/SHBG) in women were 7–10 [18]. Homeostatic model assessment IR (HOMA-IR; calculated by the equation HOMA-IR = FBG×FINS/22.5)≥2.5 indicates IR [19]. Peripheral blood samples were extracted from all subjects for MeDIP analysis.
Genome-wide methylated DNA immunoprecipitation (MeDIP) analysis
PCOS-associated and PCOS-IR-associated methylation profiles were gained from the MeDIP-chip platform (Shanghai Biochip, Shanghai, China) based on Nimblegen Human Meth 3×720K CpGRfSq Prom Arr Del (Roche NimbleGen, Wisconsin, USA). Each subject's sample was analyzed with one MeDIP-chip separately. Genomic DNA extracted from peripheral blood sample of the 5 controls and 10 PCOS patients (5 PCOS-NIR patients and 5 PCOS-IR patients) was prepared using the DNeasy Blood & Tissue kits (Qiagen, USA). About 2 µg of DNA was bisulfite-treated with the EpiTect Bisufite kit (Qiagen, USA) following the manufacturer's protocol. Amplification across the entire bisulfate converted genome was performed by the EpiTect Whole Bisufitome kit (Qiagen, USA) according to the manufacture's protocol.
To verify the specificity of DNA methylation, we performed methylation-specific PCR (MSP). According to the principle of methylation, we designed the methylation-specific PCR primers for estrogen receptor beta (ER-β) by using MethPrimer (http://www.urogene.org/methprimer/), which were shown in Table 1. Genetic DNA extracted from peripheral blood sample of normal control, PCOS-NIR patients and PCOS-IR patients was amplified using methylated-specific primer (M) and unmethylated-specific primer (U). Positive control of methylation was achieved by using the EpiTect MSP kit (Qiagen, USA). Negative control of methylation was achieved by using distilled water.
Table 1. The primers for ER-β in this experiment.
| Primer | Direction | Sequences (5′-3′) | Product size |
| Methylated-specific primer (M) | Forward | CGAGGGTGTTTTTATTTAGAGGTTAC | 256 bp |
| Reverse | ATTTCAAAAAACAATTATTTCTCGC | ||
| Unmethylated-specific primer (U) | Forward | TGAGGGTGTTTTTATTTAGAGGTTAT | 255 bp |
| Reverse | TTTCAAAAAACAATTATTTCTCACA |
Before carrying out MeDIP, we sonicated genomic DNA to produce random fragments ranging in size from 300 bp to 1000 bp. MeDIP assay was carried out as described previously [20]. Briefly, the samples were independently labeled with Cy5 (IP) and Cy3 (INPUT) using a NimbleGen Dual Color DNA labeling kit (Roche NimbleGen, Wisconsin, USA). Co-hybridizations in dye-swap were performed using a NimbleGen Human Meth 3× 720K CpG RfSq Prom Arr Del array. After heat denaturation at 95°C for 10 min, DNA was incubated with antibody against 5- methylcytidine (Diagnode, Belgium) in 1× IP buffer (10 nM sodium phosphate, pH 7.0, 140 mM NaCl, 0.05% (w/v) Triton X-100) at 4°C overnight. Immune complex were collected with Dynabeads Protein A (Invitrogen, USA), washed with 1× IP buffer for seven times, treated with Proteinase K for 4 hours at 42°C, and purified by phenol and chloroform extraction and isopropanol precipitation. Then they were scanned using an AXON GenePix 4000B Microarray Scanner (AXON, California, USA).
Signals were localized and expression ratio between experimental and reference (Cy5/Cy3 ratio) was determined using by Nimblescan software V2.5 (Roche NimbleGen, Wisconsin, USA). The ratio was then log 2 transformed. Then the probability of genes (p value) being differentially methylated among groups was computed using ACME (Algorithm for Capturing Microarray Enrichment). The lower p value, the higher probability of probes being differentially methylated. Finally, peak score was calculated according to the p value of each probes (peak score = −lg P). The peak score indicates the reliability of peak. The probes with peak score >2 and p value<0.0005 may be the methylated regions.
Transcription regulatory data
A total of 774 regulatory relations between 219 transcriptional factors and 265 target genes were collected from TRANSFAC (http://www.gene-regulation.com/pub/databases.html) and 5,722 regulatory relations between 102 transcriptional factors and 2, 920 target genes were collected from TRED (http://rulai.cshl.edu/TRED/). We integrated both groups and obtained 6,328 regulatory relations between 276 transcriptional factors and 3, 002 target genes. Based on these data, we constructed the regulatory network of PCOS-NIR/PCOS-IR, PCOS/healthy controls.
Protein-protein interaction (PPI) network data
We collected 39, 240 PPIs from HPRD database [21] and 379, 426 protein-protein relations from BIOGRID database [22]. After integration for both databases, a total of 326,119 PPIs were obtained. Then, we mapped all the differentially methylated genes to the PPIs, and only kept the interactive differentially methylated genes and their nearest neighbor genes. Based on them, we constructed the PPIs network for PCOS-NIR/PCOS-IR, PCOS/healthy controls.
Gene Ontology (GO) function and pathways analysis
The Database for Annotation, Visualization and Integrated Discovery [23] (DAVID) version 6.7 provides a comprehensive set of functional annotation tools to understand biological meaning behind large lists of genes. In our study, we used DAVID software (http://david.abcc.ncifcrf.gov/) to perform GO and PATHWAY analysis for regulatory network and PPI network.
Statistical analyses
Data were analyzed with the IBM SPSS Statistics software V19.0 (IBM, New York, USA). Independent t tests were performed to evaluate the significance of any differences between test and control groups. All p-values were 2-sided, and p<0.05 was considered to be significant.
Results
Clinical data were summarized in Table 2. The three groups were comparable in terms of age, height, weight, BMI, hormone and glucose levels. Serum total testosterone (TT), free testosterone (FT) and follicle count of PCOS patients were higher than healthy controls (p<0.05). The sex hormone binding globulin (SHBG) level in PCOS patients was lower compared with healthy controls (p<0.05). The levels of fasting insulin (FINS) and homeostatic model assessment insulin resistance (HOMA-IR) were higher in PCOS-IR patients than PCOS-NIR patients or healthy controls (p<0.05).
Table 2. baseline patients' characteristics.
| PCOS-NIR (n = 5) | PCOS-IR (n = 5) | Control (n = 5) | |
| Age (year) | 24.8±2.17 | 27.4±3.44 | 25.4±2.51 |
| Height (cm) | 162.6±3.44 | 158.4±3.21 | 161.4±3.13 |
| Weight (kg) | 56.2±3.90 | 66.6±1.52 | 51.2±6.30 |
| BMI (kg/m2) | 21.3±1.11 | 26.6±0.77 | 19.7±2.41 |
| TT (nmol/l) | 3.59±0.58 | 3.25±0.51 | 1.67±0.52 |
| SHBG (nmol/l) | 30.3±6.02 | 18.7±7.99 | 63.1±19.8 |
| FT (pg/ml) | 9.43±1.08 | 11.2±1.72 | 5.16±0.42 |
| FBG (mmol/l) | 5.07±0.32 | 5.42±0.36 | 5.24±0.27 |
| FINS (µIU/ml) | 8.42±3.08 | 13.4±3.51 | 6.54±0.79 |
| FAI | 12.0±1.56 | 19.8±7.55 | 2.87±1.34 |
| HOMA-IR | 1.87±0.55 | 3.18±0.67 | 1.53±0.22 |
| Follicle count | 15.6±1.34 | 14.4±2.30 | 6.2±1.30 |
Data are presented as means±standard deviations. PCOS, Polycystic ovary syndrome; IR, insulin resistance; NIR, non-insulin resistance; BMI, body mass index; TT, total testosterone; SHBG, sex hormone binding globulin; FT, free testosterone; FINS, fasting insulin; FBG, fasting blood glucose; HOMA-IR, homeostatic model assessment-insulin resistance = (FBG×FINS)/22.5; FAI, free androgen index = (TT×100)/SHBG.
Specificity analysis of methylated DNA
To investigate the specificity of methylated DNA, MSP was performed. Genetic DNA was extracted from peripheral blood sample of normal control, PCOS-NIR and PCOS-IR patients, respectively. As shown in Figure 1, the fragment of approximate 250 bp was specifically appeared in samples amplified by M primer.
Figure 1. MS-PCR electrophoretogram showing the specificity of methylated DNA.
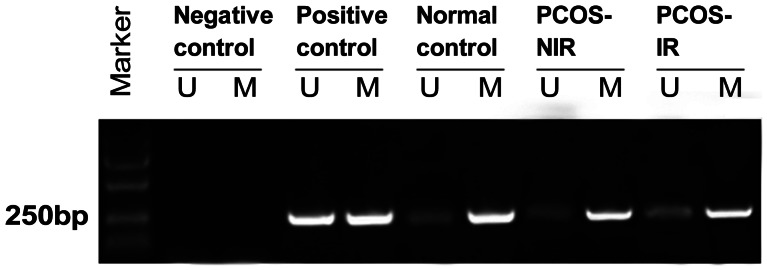
Bands in the M lanes represent the methylated PCR products of ER-β, whereas bands in the U lanes represent the unmethylated ER-β. The presence of a 250 bp band indicates hypermethylated DNA fragment and the fuzzy band in the U lane indicates partially methylated DNA fragment.
Genome-wide methylated DNA immunoprecipitation (MeDIP) analysis identification of differentially methylated genes
We applied PCOS related and PCOS-IR related methylation profiles from MeDIP-chip platform. Fold-change and t-test methods were used to identify differentially methylated genes. Of the genes examined, 79 genes of them were identified as differentially methylated in PCOS-NIR patients vs. PCOS-IR patients (p<0.0005; Table 3). A total of 40 genes were identified as differentially methylated in PCOS vs. healthy controls (p<0.0005; Table 4).
Table 3. The 79 differentially methylated genes in PCOS-NIR patients vs. PCOS-IR patients (p<0.0005).
| Gene ID | Official Symbol | P value | Gene ID | Official Symbol | P value |
| 398 | ARHGDIG | 0.00036 | 84307 | ZNF397 | 0.00035 |
| 83864 | TTTY9A | 0.00019 | 4606 | MYBPC2 | 0.00004 |
| 55013 | CCDC109B | 0.00019 | 90427 | BMF | 0.00028 |
| 283464 | GXYLT1 | 0.00006 | 1636 | ACE | 0.00037 |
| 494514 | C18orf56 | 0.00039 | 341457 | PPIAP8 | 0.00027 |
| 60673 | C12orf44 | 0.00011 | 8536 | CAMK1 | 0.00038 |
| 127829 | ARL8A | 0.00003 | 84896 | ATAD1 | 0.00015 |
| 51608 | GET4 | 0.00031 | 3978 | LIG1 | 0.00002 |
| 8493 | PPM1D | 0.00027 | 91662 | NLRP12 | 0.00015 |
| 358 | AQP1 | 0.00030 | 5028 | P2RY1 | 0.00030 |
| 1120 | CHKB | 0.00043 | 1119 | CHKA | 0.00040 |
| 433 | ASGR2 | 0.00047 | 440107 | PLEKHG7 | 0.00037 |
| 3266 | ERAS | 0.00016 | 284996 | RNF149 | 0.00024 |
| 340120 | ANKRD34B | 0.00023 | 2618 | GART | 0.00048 |
| 6013 | RLN1 | 0.00006 | 5480 | PPIC | 0.00021 |
| 153328 | SLC25A48 | 0.00044 | 7087 | ICAM5 | 0.00040 |
| 8320 | EOMES | 0.00005 | 285679 | C5orf60 | 0.00022 |
| 3241 | HPCAL1 | 0.00006 | 51465 | UBE2J1 | 0.00031 |
| 51529 | ANAPC11 | 0.00048 | 145942 | TMCO5A | 0.00032 |
| 6340 | SCNN1G | 0.00037 | 9240 | PNMA1 | 0.00020 |
| 389941 | C1QL3 | 0.00030 | 25894 | PLEKHG4 | 0.00047 |
| 2805 | GOT1 | 0.00030 | 164091 | PAQR7 | 0.00030 |
| 128322 | LOC128322 | 0.00036 | 7296 | TXNRD1 | 0.00040 |
| 53820 | DSCR6 | 0.00025 | 9659 | PDE4DIP | 0.00049 |
| 6531 | SLC6A3 | 0.00045 | 79854 | LINC00115 | 0.00007 |
| 84698 | CAPS2 | 0.00018 | 165530 | CLEC4F | 0.00025 |
| 85027 | SMIM3 | 0.00023 | 644613 | LOC644613 | 0.00012 |
| 9525 | VPS4B | 0.00003 | 8439 | NSMAF | 0.00027 |
| 645369 | TMEM200C | 0.00017 | 4255 | MGMT | 0.00026 |
| 64417 | C5orf28 | 0.00001 | 1051 | CEBPB | 0.00017 |
| 55333 | SYNJ2BP | 0.00045 | 115548 | FCHO2 | 0.00028 |
| 4953 | ODC1 | 0.00020 | 55020 | TTC38 | 0.00011 |
| 644765 | LOC644765 | 0.00041 | 51646 | YPEL5 | 0.00050 |
| 10799 | RPP40 | 0.00047 | 57684 | ZBTB26 | 0.00038 |
| 389384 | C6orf222 | 0.00048 | 111 | ADCY5 | 0.00028 |
| 80724 | ACAD10 | 0.00038 | 4065 | LY75 | 0.00018 |
| 83858 | ATAD3B | 0.00031 | 2837 | UTS2R | 0.00010 |
| 195828 | ZNF367 | 0.00013 | 254312 | LINC00710 | 0.00004 |
| 56957 | OTUD7B | 0.00033 | 163049 | ZNF791 | 0.00021 |
| 1746 | DLX2 | 0.00024 |
Table 4. The 40 differentially methylated genes in PCOS vs. healthy controls (p<0.0005).
| Gene ID | Official Symbol | P value | Gene ID | Official Symbol | P value |
| 120425 | AMICA1 | 0.00001 | 164781 | WDR69 | 0.00022 |
| 166348 | KBTBD12 | 0.00002 | 245929 | DEFB115 | 0.00023 |
| 2030 | SLC29A1 | 0.00003 | 54826 | GIN1 | 0.00026 |
| 11245 | GPR176 | 0.00005 | 158038 | LINGO2 | 0.00027 |
| 51778 | MYOZ2 | 0.00005 | 390084 | OR56A5 | 0.00028 |
| 51604 | PIGT | 0.00005 | 158405 | KIAA1958 | 0.00028 |
| 388125 | C2CD4B | 0.00005 | 643812 | KRTAP27-1 | 0.00030 |
| 56141 | PCDHA7 | 0.00006 | 59269 | HIVEP3 | 0.00031 |
| 3159 | HMGA1 | 0.00008 | 9532 | BAG2 | 0.00033 |
| 54510 | PCDH18 | 0.00010 | 56674 | TMEM9B | 0.00034 |
| 6738 | TROVE2 | 0.00010 | 221914 | GPC2 | 0.00037 |
| 374928 | ZNF773 | 0.00010 | 2324 | FLT4 | 0.00039 |
| 6336 | SCN10A | 0.00011 | 644624 | LOC644624 | 0.00039 |
| 220766 | CEP170L | 0.00011 | 64928 | MRPL14 | 0.00040 |
| 375287 | RBM43 | 0.00012 | 445582 | POTEE | 0.00040 |
| 53838 | C11orf24 | 0.00015 | 1984 | EIF5A | 0.00044 |
| 6319 | SCD | 0.00015 | 1047 | CLGN | 0.00045 |
| 128488 | WFDC12 | 0.00020 | 4062 | LY6H | 0.00047 |
| 3676 | ITGA4 | 0.00021 | 441268 | LOC441268 | 0.00048 |
| 2931 | GSK3A | 0.00022 | 10156 | RASA4 | 0.00048 |
Construction of regulatory network
To get the regulatory relationships between PCOS-NIR and PCOS-IR patients as well as between PCOS patients and healthy control, we mapped their differentially methylated genes into regulation data collected from TRANSFAC and TRED, and built regulatory networks by Cytoscape software [24] (Figure 2A and B). In the regulatory network between PCOS-NIR and PCOS-IR, significant difference in CEBPB gene methylation was observed (p = 0.00017). CEBPB formed a local network by regulating a number of genes, suggesting it may play an important role in PCOS-IR. Besides, CEBPB indirectly regulated the methylated gene ODC1 through regulating the normal gene (unmethylated gene) CREB1. In our network, we observed that methylated gene GART regulated the methylated gene GOT1 directly, and regulated another methylated gene PDE4DIP indirectly (Figure 2A). The regulatory network of differentially methylated genes between PCOS patients and healthy controls was much simpler. In this network, the methylated gene EPM2A regulated two normal genes, MYC and E2F2. The methylated genes ITGA4 and HMGA1 regulated the normal genes ETS1 and IGFBP1, respectively (Figure 2B).
Figure 2. Regulatory network analysis of differentially methylated genes.

A. regulatory network of differentially methylated genes between PCOS-NIR and PCOS-IR patients; B. regulatory network of differentially methylated genes between PCOS patients and healthy controls. The yellow nodes represent methylated genes and pink nodes represent normal genes.
Gene Ontology (GO) function analysis of regulatory network
To explore the biological function of genes in the regulatory network of PCOS-NIR vs. PCOS-IR, we applied the online biological classification tool DAVID and observed significant enrichments of these differentially methylated genes in multiple GO categories (Table 5). The most significant enrichment was GO category of defense response with FDR = 3.16E-18. The other significant GO categories included inflammatory response (FDR = 1.73E-17), response to wounding (FDR = 9.91E-17) and regulation of cytokine production (FDR = 2.09E-12). In fact, all significant GO category clusters were associated with immune response (Table 5).
Table 5. GO function analysis of regulatory network of PCOS-NIR vs. PCOS-IR.
| Term | Description | Count | FDR |
| GO:0006952 | defense response | 33 | 3.16E-18 |
| GO:0006954 | inflammatory response | 26 | 1.73E-17 |
| GO:0009611 | response to wounding | 30 | 9.91E-17 |
| GO:0001817 | regulation of cytokine production | 18 | 2.09E-12 |
| GO:0006953 | acute-phase response | 11 | 7.78E-11 |
| GO:0031328 | positive regulation of cellular biosynthetic process | 27 | 9.00E-11 |
| GO:0009891 | positive regulation of biosynthetic process | 27 | 1.26E-10 |
| GO:0010557 | positive regulation of macromolecule biosynthetic process | 26 | 2.65E-10 |
| GO:0051240 | positive regulation of multicellular organismal process | 18 | 2.91E-10 |
| GO:0010033 | response to organic substance | 27 | 2.97E-10 |
Pathway analysis of regulatory network
To identify the deregulated pathways in patients with PCOS-IR vs. PCOS-NIR, we performed pathway enrichment analysis on the differentially methylated genes using the online tool of DAVID (Table 6). At a FDR of 0.01, four pathways were enriched, including cytokine-cytokine receptor interaction (FDR = 8.39E-06), hematopoietic cell lineage (FDR = 2.76E-04), asthma (FDR = 5.24E-04) and Jak-STAT signaling pathway (FDR = 6.15E-04) (Table 6).
Table 6. Pathway analysis of regulatory network of PCOS-NIR vs. PCOS-IR.
| Term | Description | Count | FDR |
| hsa04060 | Cytokine-cytokine receptor interaction | 17 | 8.39E-06 |
| hsa04640 | Hematopoietic cell lineage | 10 | 2.76E-04 |
| hsa05310 | Asthma | 7 | 5.24E-04 |
| hsa04630 | Jak-STAT signaling pathway | 12 | 6.15E-04 |
Construction of protein-protein interaction (PPI) networks
Transcriptional changes are not always strictly correlated with protein expressions and functions. To investigate the differentially methylated genes in protein level, we constructed PPI networks between PCOS-NIR and PCOS-IR as well as PCOS and healthy controls through analyzing the data collected from HPRD and BIOGRID (Figure 3). The importance of a gene is often dependent on how well it associates with other genes in a network. Studies suggest that more centralized genes in the network are more likely to be key drivers to proper cellular function than peripheral genes (nodes) [25]. From the PPI network of PCOS-NIR vs. PCOS-IR, we observed that the methylated genes CEBPB, GOT1, GET4, ODC1 and C12orf44 formed local networks (Figure 3A). In the PPI network of PCOS vs. healthy controls, the methylated genes GSK3A, HMGA1, ITGA4, EPM2A and BAG2 were hub nodes (Figure 3B).
Figure 3. Protein-protein interaction (PPI) network analysis.

A. Protein-protein interaction (PPI) network of PCOS-NIR and PCOS-IR; B. PPI network of PCOS and controls. Yellow nodes represent methylated genes and pink nodes represent normal genes.
GO function analysis of PPI network
To investigate the biological function of genes in PPI networks, we performed GO function analysis for these genes in each PPI network, respectively. Table 7 shows the top 10 enriched GO gene categories in the PPI network of PCOS-NIR vs. PCOS-IR. The most significant GO gene category was regulation of transcription of RNA polymerase II promoter (FDR = 8.38E-22). The other significant GO categories included positive regulation of nitrogen compound metabolic process (FDR = 1.21E-19), positive regulation of macromolecule metabolic process (FDR = 4.40E-18) and positive regulation of macromolecule metabolic process (FDR = 6.68E-18) (Table 7). Table 8 shows the top 10 GO categories in the PPI network of PCOS vs. healthy controls. The most significant GO category was positive regulation of macromolecule metabolic process (FDR = 5.47E-11). The other significant GO categories included positive regulation of cellular biosynthetic process (FDR = 2.43E-06), positive regulation of biosynthetic process (FDR = 3.15E-06) and positive regulation of nitrogen compound metabolic process (FDR = 5.17E-06) (Table 8).
Table 7. GO function analysis of PPI network of PCOS-NIR vs. PCOS-IR.
| Term | Description | Count | FDR |
| GO:0006357 | regulation of transcription from RNA polymerase II promoter | 62 | 8.38E-22 |
| GO:0051173 | positive regulation of nitrogen compound metabolic process | 56 | 1.21E-19 |
| GO:0010604 | positive regulation of macromolecule metabolic process | 62 | 4.40E-18 |
| GO:0045935 | positive regulation of nucleobase, nucleoside, nucleotide and nucleic acid metabolic process | 53 | 6.68E-18 |
| GO:0010628 | positive regulation of gene expression | 49 | 4.02E-16 |
| GO:0045941 | positive regulation of transcription | 48 | 7.12E-16 |
| GO:0045893 | positive regulation of transcription, DNA-dependent | 44 | 1.50E-15 |
| GO:0051254 | positive regulation of RNA metabolic process | 44 | 2.06E-15 |
| GO:0031328 | positive regulation of cellular biosynthetic process | 52 | 2.26E-15 |
| GO:0045944 | positive regulation of transcription from RNA polymerase II promoter | 39 | 2.68E-15 |
Table 8. GO function analysis of PPI network of PCOS vs. healthy controls.
| Term | Description | Count | FDR |
| GO:0010604 | positive regulation of macromolecule metabolic process | 30 | 5.47E-11 |
| GO:0031328 | positive regulation of cellular biosynthetic process | 22 | 2.43E-06 |
| GO:0009891 | positive regulation of biosynthetic process | 22 | 3.15E-06 |
| GO:0051173 | positive regulation of nitrogen compound metabolic process | 21 | 5.17E-06 |
| GO:0010628 | positive regulation of gene expression | 20 | 5.93E-06 |
| GO:0010557 | positive regulation of macromolecule biosynthetic process | 21 | 6.73E-06 |
| GO:0006468 | protein amino acid phosphorylation | 21 | 9.42E-06 |
| GO:0045893 | positive regulation of transcription, DNA-dependent | 18 | 1.26E-05 |
| GO:0051254 | positive regulation of RNA metabolic process | 18 | 1.43E-05 |
| GO:0045935 | positive regulation of nucleobase, nucleoside, nucleotide and nucleic acid metabolic process | 20 | 1.90E-05 |
Pathway analysis of PPI network
Furthermore, we performed the pathway enrichment analysis for these genes in PPI network. Table 9 shows pathways enriched in PPI network of PCOS-NIR vs. PCOS-IR. At a FDR of 0.01, 6 pathways were enriched, including pathways in cancer (FDR = 4.78E-08), chronic myeloid leukemia (FDR = 3.17E-05), and prostate cancer (FDR = 2.62E-04) (Table 9). Table 10 showed the enriched pathways in PPI network of PCOS vs. healthy controls. At a FDR of 0.01, 5 pathways were enriched, including pathways in cancer (FDR = 0.00112), ErbB signaling pathway (FDR = 0.001209), and focal adhesion (FDR = 0.001848) (Table 10).
Table 9. Pathway analysis of PPI network of PCOS-NIR vs. PCOS-IR.
| Term | Description | Count | FDR |
| hsa05200 | Pathways in cancer | 32 | 4.78E-08 |
| hsa05220 | Chronic myeloid leukemia | 14 | 3.17E-05 |
| hsa05215 | Prostate cancer | 14 | 2.62E-04 |
| hsa05221 | Acute myeloid leukemia | 11 | 0.001466 |
| hsa05212 | Pancreatic cancer | 12 | 0.001485 |
| hsa05219 | Bladder cancer | 9 | 0.008231 |
Table 10. Pathway analysis of PPI network of PCOS vs. healthy controls.
| Term | Description | Count | FDR |
| hsa05200 | Pathways in cancer | 15 | 0.00112 |
| hsa04012 | ErbB signaling pathway | 9 | 0.001209 |
| hsa04510 | Focal adhesion | 12 | 0.001848 |
| hsa04010 | MAPK signaling pathway | 13 | 0.00462 |
| hsa04310 | Wnt signaling pathway | 10 | 0.009299 |
Discussion
PCOS affects 6–10% of women of childbearing age, many groups suggested that insulin resistance plays a critical role in PCOS development [26], [27]. Despite significant research advances have been achieved over the past decade [28], many questions remain uncertain. In the current study, we employed genome-wide methylated DNA immunoprecipitation (MeDIP) analysis to characterize genes that are differently methylated between PCOS patients and healthy controls, or between PCOS-NIR vs. PCOS-IR patients. Besides, we constructed the regulatory networks and PPI networks after analyzing these differentially methylated genes in PCOS-NIR vs. PCOS-IR, or in PCOS vs. control. Furthermore, the GO function and pathway analysis were performed for regulatory networks and PPI networks. We found various GO categories were enriched including cytokine-cytokine receptor interaction, hematopoietic cell lineage, and asthma. Bio-pathway analysis for these genes in PPI network showed that cancer pathways were enriched after comparing PCOS-NIR with PCOS-IR patients, as well as comparing PCOS patients with healthy controls.
DNA methylation is an epigenetic modification associated with gene transcription regulation, X-chromosome inactivation, development and cell differentiation regulation. Aberrant DNA methylation is closely associated with cancer development and progression. The advent of microarray technology has provided new opportunities for high-throughput study on DNA methylation. Microarray-based methods include immunoprecipitation and restriction digestion. Each technique has its own advantages. Immunoprecipitation uses the specificity of antibodies to isolate target proteins (antigens) out of complex sample mixtures [29]. Restriction enzyme digestion using methylcytosine-sensitive enzymes, followed by ligation-mediated PCR amplification of the targets [30]. Therefore, the immunoprecipitation method is more specific while the restriction digestion method is more sensitive. Together, they provide many choices for the study of genome-wide DNA methylation profile in disease.
In order to further confirm the specificity of methylation, we performed a MSP using estrogen receptor beta (ER-βER-β) gene. ER-βER-β is expressed by many tissues and its expression can be regulated by DNA methylation of the promoter region. Previous study suggested that the methylation of ER-βER-β is related to genesis of tumor and endocrine disease [31]. Besides, the ER-βER-β gene polymorphism was reported to be associated with pathophysiologic aberrancies involved in PCOS [32]. From Figure 1, we could find that the fragment of 250 bp appeared in samples amplified by M primer. The fuzzy band in the U lane indicated partially methylated DNA fragment.
From Table 2, we could find that significant difference in CEBPB gene methylation was observed between PCOS-NIR patients and PCOS-IR patients (p = 0.000170). Besides, CEBPB formed local networks in both regulatory network (Figure 2A) and PPI network (Figure 3A). These results all suggested CEBPB plays an important role in insulin resistance in PCOS patients. CEBPB is a bZIP transcription factor which can bind as a homodimer to certain DNA regulatory regions. CEBPB is important in the regulation of genes involved in immune and inflammatory responses and has been shown to bind to the interleukin (IL) −1 response element in the IL- 6 gene, as well as to regulatory regions of several acute- phase and cytokine genes [33]. Expression of CEBPB in blood leukocytes has been shown to be positively associated with muscle strength in humans, emphasizing the importance of the immune system [34]. In particular, CEBPB is a downstream effector of the luteinizing hormone signaling pathway and thus plays key roles in the luteinizing hormone response of the follicle [35]. CEBPB is involved in the acquisition of insulin receptor substrate (IRS) −2 and glucose transporter 4 (GLUT4) expression as well as in insulin - sensitive glucose uptake during adipocyte differentiation [36]. We could find a significant difference of CEBPB gene methylation between PCOS-NIR and PCOS-IR patients (p = 0.00017), suggesting CEBPB involving in insulin resistance in PCOS patients. Besides, CEBPB indirectly regulated the methylated gene ODC1 through regulating the normal gene CREB1, as shown in Figure 2A. ODC1 (ornithine decarboxylase 1) is a rate-limiting enzyme of the polyamine biosynthesis pathway which catalyzes ornithine to putrescine. A previous study suggested that exposure to ethanol results in insulin resistance and thereby disrupts the molecular path by which induces the expression of ODC enzymatic activity [37], indicating the role of ODC1 in insulin resistance.
As shown in Table 5, genes of defense response, inflammatory response, and the response to wounding belong to the cellular immunity term were differentially methylated in PCOS vs healthy controls, suggesting that PCOS may be associated with the immune response. The immune response is how your body recognizes and defends itself against bacteria, viruses, and substances that appear foreign and harmful [38]. An efficient immune response protects against many diseases and disorders. The gene categories of regulation of transcription from RNA polymerase II promoter, positive regulation of macromolecule metabolic process, positive regulation of transcription, DNA-dependent and positive regulation of cellular biosynthetic process appeared in both GO function and pathway analysis. These genes are all necessary in biological growth and differentiation, proliferation and development [39]. The biosynthesis process often consists of several enzymatic steps in which the product of one step is used as substrate in the following step. Examples for such multi-step biosynthetic pathways are those for the production of amino acids, fatty acids, and natural products [40]. Biosynthesis plays a major role in all cells, and many dedicated metabolic routes combined constitute general metabolism. Both PCOS-NIR and PCOS-IR were related to biosynthesis.
Table 9 and Table 10 showed that the category of genes related to pathways in cancer were differently methylated PCOS-NIR and PCOS-IR. The abnormal activation of signaling pathways is a critical event in cancer pathogenesis [41]. In particular, activation of these pathways can lead to inappropriate cellular survival, proliferation, pluripotency, invasion, metastasis, and angiogenesis [41].
Funding Statement
This work was supported by grants from the International Collaborative Items of Ministry of Science and Technology of China (No. 2006DFA32780). The funders had no role in study design, data collection and analysis, decision to publish, or preparation of the manuscript.
References
- 1. Fauser B, Diedrich K, Bouchard P, Domínguez F, Matzuk M, et al. (2011) Contemporary genetic technologies and female reproduction. Human reproduction update 17: 829–847. [DOI] [PMC free article] [PubMed] [Google Scholar]
- 2. Legro RS, Strauss JF (2002) Molecular progress in infertility: polycystic ovary syndrome. Fertility and sterility 78: 569–576. [DOI] [PubMed] [Google Scholar]
- 3. Diamanti-Kandarakis E, Kandarakis H, Legro RS (2006) The role of genes and environment in the etiology of PCOS. Endocrine 30: 19–26. [DOI] [PubMed] [Google Scholar]
- 4. Hickey TE, Legro RS, Norman RJ (2006) Epigenetic modification of the X chromosome influences susceptibility to polycystic ovary syndrome. J Clin Endocrinol Metab 91: 2789–2791. [DOI] [PubMed] [Google Scholar]
- 5.van Houten E, Mcluskey A, Kramer P, Karels B, Themmen A, et al.. (2011) Development of a mouse model with polycystic ovary syndrome. pp. P94.
- 6. Vanky E, Salvesen KÅ, Heimstad R, Fougner K, Romundstad P, et al. (2004) Metformin reduces pregnancy complications without affecting androgen levels in pregnant polycystic ovary syndrome women: results of a randomized study. Human Reproduction 19: 1734–1740. [DOI] [PubMed] [Google Scholar]
- 7. Goldenberg N, Glueck C (2008) Medical therapy in women with polycystic ovarian syndrome before and during pregnancy and lactation. Minerva ginecologica 60: 63–75. [PubMed] [Google Scholar]
- 8. Azziz R, Woods KS, Reyna R, Key TJ, Knochenhauer ES, et al. (2004) The prevalence and features of the polycystic ovary syndrome in an unselected population. Journal of Clinical Endocrinology & Metabolism 89: 2745–2749. [DOI] [PubMed] [Google Scholar]
- 9. Nardo LG, Yates AP, Roberts SA, Pemberton P, Laing I (2009) The relationships between AMH, androgens, insulin resistance and basal ovarian follicular status in non-obese subfertile women with and without polycystic ovary syndrome. Human Reproduction 24: 2917–2923. [DOI] [PubMed] [Google Scholar]
- 10. Hutchison SK, Stepto NK, Harrison CL, Moran LJ, Strauss BJ, et al. (2011) Effects of exercise on insulin resistance and body composition in overweight and obese women with and without polycystic ovary syndrome. Journal of Clinical Endocrinology & Metabolism 96: E48–E56. [DOI] [PubMed] [Google Scholar]
- 11. Cupisti S, Giltay EJ, Gooren LJ, Kronawitter D, Oppelt PG, et al. (2010) The impact of testosterone administration to female-to-male transsexuals on insulin resistance and lipid parameters compared with women with polycystic ovary syndrome. Fertility and sterility 94: 2647–2653. [DOI] [PubMed] [Google Scholar]
- 12. Halperin IJ, Kumar SS, Stroup DF, Laredo SE (2011) The association between the combined oral contraceptive pill and insulin resistance, dysglycemia and dyslipidemia in women with polycystic ovary syndrome: a systematic review and meta-analysis of observational studies. Human Reproduction 26: 191–201. [DOI] [PubMed] [Google Scholar]
- 13. Cho L, Kilpatrick E, Keevil B, Coady A, Atkin S (2009) Effect of metformin, orlistat and pioglitazone treatment on mean insulin resistance and its biological variability in polycystic ovary syndrome. Clinical endocrinology 70: 233–237. [DOI] [PubMed] [Google Scholar]
- 14. Xu N, Kwon S, Abbott DH, Geller DH, Dumesic DA, et al. (2011) Epigenetic mechanism underlying the development of polycystic ovary syndrome (PCOS)-like phenotypes in prenatally androgenized rhesus monkeys. PLoS One 6: e27286. [DOI] [PMC free article] [PubMed] [Google Scholar]
- 15. Qu F, Wang FF, Yin R, Ding GL, El-Prince M, et al. (2012) A molecular mechanism underlying ovarian dysfunction of polycystic ovary syndrome: hyperandrogenism induces epigenetic alterations in the granulosa cells. J Mol Med (Berl) 90: 911–923. [DOI] [PubMed] [Google Scholar]
- 16. Li Z, Huang H (2008) Epigenetic abnormality: a possible mechanism underlying the fetal origin of polycystic ovary syndrome. Med Hypotheses 70: 638–642. [DOI] [PubMed] [Google Scholar]
- 17. Azziz R, Carmina E, Dewailly D, Diamanti-Kandarakis E, Escobar-Morreale HF, et al. (2006) Criteria for defining polycystic ovary syndrome as a predominantly hyperandrogenic syndrome: an androgen excess society guideline. Journal of Clinical Endocrinology & Metabolism 91: 4237–4245. [DOI] [PubMed] [Google Scholar]
- 18. Ly LP, Handelsman DJ (2005) Empirical estimation of free testosterone from testosterone and sex hormone-binding globulin immunoassays. Eur J Endocrinol 152: 471–478. [DOI] [PubMed] [Google Scholar]
- 19. Angioni S, Sanna S, Magnini R, Melis GB, Fulghesu AM (2011) The quantitative insulin sensitivity check index is not able to detect early metabolic alterations in young patients with polycystic ovarian syndrome. Gynecol Endocrinol 27: 468–474. [DOI] [PubMed] [Google Scholar]
- 20. Pomraning KR, Smith KM, Freitag M (2009) Genome-wide high throughput analysis of DNA methylation in eukaryotes. Methods 47: 142–150. [DOI] [PubMed] [Google Scholar]
- 21. Prasad TSK, Goel R, Kandasamy K, Keerthikumar S, Kumar S, et al. (2009) Human protein reference database—2009 update. Nucleic acids research 37: D767–D772. [DOI] [PMC free article] [PubMed] [Google Scholar]
- 22. Stark C, Breitkreutz BJ, Chatr-Aryamontri A, Boucher L, Oughtred R, et al. (2011) The BioGRID interaction database: 2011 update. Nucleic acids research 39: D698–D704. [DOI] [PMC free article] [PubMed] [Google Scholar]
- 23. Da Wei Huang BTS, Lempicki RA (2008) Systematic and integrative analysis of large gene lists using DAVID bioinformatics resources. Nature protocols 4: 44–57. [DOI] [PubMed] [Google Scholar]
- 24. Shannon P, Markiel A, Ozier O, Baliga NS, Wang JT, et al. (2003) Cytoscape: a software environment for integrated models of biomolecular interaction networks. Genome Res 13: 2498–2504. [DOI] [PMC free article] [PubMed] [Google Scholar]
- 25. Horvath S, Zhang B, Carlson M, Lu KV, Zhu S, et al. (2006) Analysis of oncogenic signaling networks in glioblastoma identifies ASPM as a molecular target. Proc Natl Acad Sci U S A 103: 17402–17407. [DOI] [PMC free article] [PubMed] [Google Scholar]
- 26. Baillargeon JP, Iuorno MJ, Nestler JE (2003) Insulin sensitizers for polycystic ovary syndrome. Clinical obstetrics and gynecology 46: 325. [DOI] [PubMed] [Google Scholar]
- 27. Tosi F, Dorizzi R, Castello R, Maffeis C, Spiazzi G, et al. (2009) Body fat and insulin resistance independently predict increased serum C-reactive protein in hyperandrogenic women with polycystic ovary syndrome. European Journal of Endocrinology 161: 737–745. [DOI] [PubMed] [Google Scholar]
- 28. Tasali E, Chapotot F, Leproult R, Whitmore H, Ehrmann DA (2011) Treatment of obstructive sleep apnea improves cardiometabolic function in young obese women with polycystic ovary syndrome. Journal of Clinical Endocrinology & Metabolism 96: 365–374. [DOI] [PMC free article] [PubMed] [Google Scholar]
- 29. Kaboord B, Perr M (2008) Isolation of proteins and protein complexes by immunoprecipitation. Methods Mol Biol 424: 349–364. [DOI] [PubMed] [Google Scholar]
- 30. Irizarry RA, Ladd-Acosta C, Carvalho B, Wu H, Brandenburg SA, et al. (2008) Comprehensive high-throughput arrays for relative methylation (CHARM). Genome Res 18: 780–790. [DOI] [PMC free article] [PubMed] [Google Scholar]
- 31. Swedenborg E, Power KA, Cai W, Pongratz I, Ruegg J (2009) Regulation of estrogen receptor beta activity and implications in health and disease. Cell Mol Life Sci 66: 3873–3894. [DOI] [PMC free article] [PubMed] [Google Scholar]
- 32. Kim JJ, Choi YM, Choung SH, Yoon SH, Lee GH, et al. (2010) Estrogen receptor beta gene +1730 G/A polymorphism in women with polycystic ovary syndrome. Fertil Steril 93: 1942–1947. [DOI] [PubMed] [Google Scholar]
- 33. Natsuka S, Akira S, Nishio Y, Hashimoto S, Sugita T, et al. (1992) Macrophage differentiation-specific expression of NF-IL6, a transcription factor for interleukin-6. Blood 79: 460–466. [PubMed] [Google Scholar]
- 34. Harries LW, Pilling LC, Hernandez LD, Bradley-Smith R, Henley W, et al. (2012) CCAAT-enhancer-binding protein-beta expression in vivo is associated with muscle strength. Aging Cell 11: 262–268. [DOI] [PMC free article] [PubMed] [Google Scholar]
- 35. Huang AM, Rudelius M, Sharan S, McAllister JM, Raffeld M, et al. (2007) The Cebpd (C/EBPdelta) gene is induced by luteinizing hormones in ovarian theca and interstitial cells but is not essential for mouse ovary function. PLoS One 2: e1334. [DOI] [PMC free article] [PubMed] [Google Scholar]
- 36. Yamamoto H, Kurebayashi S, Hirose T, Kouhara H, Kasayama S (2002) Reduced IRS-2 and GLUT4 expression in PPARgamma2-induced adipocytes derived from C/EBPbeta and C/EBPdelta-deficient mouse embryonic fibroblasts. J Cell Sci 115: 3601–3607. [DOI] [PubMed] [Google Scholar]
- 37. Sandstrom LP, Sandstrom PA, Pennington SN (1993) Ethanol-induced insulin resistance suppresses the expression of embryonic ornithine decarboxylase activity. Alcohol 10: 303–310. [DOI] [PubMed] [Google Scholar]
- 38. Kumar H, Kawai T, Akira S (2009) Pathogen recognition in the innate immune response. Biochem J 420: 1–16. [DOI] [PubMed] [Google Scholar]
- 39. Kai A, Arashida T, Hatanaka K, Akaike T, Matsuzaki K, et al. (1994) Analysis of the biosynthetic process of cellulose and curdlan using 13C-labeled glucoses. Carbohydrate polymers 23: 235–239. [Google Scholar]
- 40. Schwartzman RA, CIDLOWSKI JA (1993) Apoptosis: the biochemistry and molecular biology of programmed cell death. Endocrine reviews 14: 133–151. [DOI] [PubMed] [Google Scholar]
- 41. Bianco R, Melisi D, Ciardiello F, Tortora G (2006) Key cancer cell signal transduction pathways as therapeutic targets. Eur J Cancer 42: 290–294. [DOI] [PubMed] [Google Scholar]