

Abstract
Purpose
Exercise training alters protein abundance in muscle of healthy individuals, but the effect of exercise on these proteins in patients with type 2 diabetes (T2D) is unknown. The aim of this study was to determine how exercise training alters the skeletal muscle proteome in patients with T2D.
Methods
Biopsies of the vastus lateralis were obtained before and after 4 weeks of exercise training in six patients with T2D (54 ± 4 yrs, BMI 29± 2) and six age- and BMI- matched control subjects (48 ± 2, BMI 28 ± 3) studied at baseline. Proteins were identified and quantified using normalized spectral abundance factors (NSAF) by multidimensional high-resolution mass spectrometry.
Results
Of 1,329 proteins assigned at baseline, 438 were present in at least half of all muscle samples; of these, 15 proteins differed significantly between patients with T2D and control subjects (p<0.05). In the diabetic patients, exercise training altered the abundance of 17 proteins (p<0.05). Key training adaptations included an increase in proteins of the malate–aspartate shuttle and citric acid cycle, reduced abundance of glycolytic proteins, and altered abundance of cytoskeleton proteins.
Conclusion
The data from this study support the ability of exercise training to alter the abundance of proteins that regulate metabolism and cytoskeletal structure in patients with T2D. These findings open new avenues for future research.
Keywords: PROTEOME, EXERCISE, SKELETAL MUSCLE, INSULIN RESISTANCE
Endurance exercise training enhances the capacity of skeletal muscle to respond to insulin and to transport, oxidize, and store glucose as glycogen (6,17). In patients with type 2 diabetes (T2D), these adaptations may collectively act to lower blood glucose concentrations and enhance blood lipid profiles, thereby reducing disease severity (11). Although the mechanisms underpinning training-mediated adaptations are not completely understood, alterations in the abundance of key regulatory proteins are thought to play an important role (11). To date, however, a global assessment of the effects of exercise training on skeletal muscle protein abundance in individuals with T2D is lacking.
Research on the adaptation of skeletal muscle to exercise training in patients with T2D has focused primarily on the changes in the expression and/or activity of specific proteins pertaining to morphological and biochemical outcomes (30). Few studies have examined global changes in the muscle proteome that may facilitate or directly cause the well-characterized improvement in whole-body glucose disposal after exercise training. In recent years, quantitative mass spectrometry-based proteomics has emerged as a powerful method to study global changes in the abundance of proteins in skeletal muscle as a result of disease and/or therapeutic interventions for disease treatment (1). A major asset of this technique is that it offers comprehensive information on changes in hundreds of proteins that characterize the muscle phenotype using scarce tissue samples, a benefit that is not attainable if the same task were to be done with specific protein expression analysis technique such as immunoblot analysis. As such, proteomics offers the foundation to identify novel patterns in protein alterations that may serve to generate new hypotheses regarding how exercise training alters metabolism and insulin action in muscle (3).
In the most comprehensive characterization of the human muscle proteome to date, our laboratory used a one-dimensional gel electrophoresis coupled with HPLC–ESI–tandem mass spectrometry (MS/MS) to identify approximately 1000 proteins from skeletal muscle biopsies from lean healthy men (14). We recently applied this method to insulin-resistant skeletal muscle and found reduced abundance of proteins involved in mitochondrial function, cytoskeleton structure, and chaperone function (20), supporting the notion that these proteins are a hallmark of insulin-resistant muscle and that alterations in the abundance of these proteins may ameliorate insulin resistance. Because exercise training is known to enhance insulin action in skeletal muscle, one would expect that exercise training would alter proteins associated with the insulin-resistant state. Accordingly, proteomic analysis of lean muscle after exercise training showed increased abundance of mitochondrial proteins, structural proteins, and heat shock proteins (18). Assessment of changes in these proteins after exercise training in insulin-resistant muscle is lacking. Therefore, the purpose of this study was to use proteomics to investigate the global effect of exercise training on skeletal muscle protein abundance in patients with T2D.
METHODS
Six patients with T2D and six healthy age- and body mass index (BMI)-matched nondiabetic control subjects were recruited for this study. All participants undertook a full medical examination and a 12-lead ECG exercise stress test. Approximately 7 d after the exercise stress test, the subjects attended The University of Melbourne after an overnight fast for an oral glucose tolerance test (OGTT) to determine the presence or absence of T2D using the established World Health Organization criteria. A 22-gauge catheter (Terumo, Laguna, Philippines) was inserted into an antecubital forearm vein for blood sampling. After a fasting blood sample, the subjects ingested a glucose drink containing 75 g of glucose in 300 mL of H2O (Heritage Diagnostics, Sydney, Australia). Blood samples (5 mL) were drawn from the intravenous line at t = 0, 15, 30, 60, 90, and 120 min after ingestion of the glucose drink. Plasma was obtained and immediately collected and frozen at −80°C for later biochemical analysis (described in the succeeding part of this article). The nondiabetic subjects had normal glucose tolerance and no family history of T2D. All the subjects were sedentary (no participation in the regular physical activity for >6 months before commencement of the study). Three subjects with T2D used only dietary control to treat their T2D. The other three were treated with oral hypoglycemic agents (one subject was treated with metformin and two subjects were treated with a combination of metformin and gliclazide) and refrained from taking these medications for 72 h before the experimental trial. The subjects taking any other medications known to affect the principal outcome measures were excluded. In addition, the subjects with evidence of cardiovascular, respiratory, hematological, musculoskeletal, or other disease that could pose a risk during exercise were excluded. The study was approved by the Human Research Ethics Committee, The University of Melbourne, and all the subjects gave written informed consent.
Upon acceptance into the study, all the subjects reported to the Exercise Physiology Laboratory at The University of Melbourne to undertake an incremental exercise test to volitional exhaustion on an electronically braked ergometer (Lode, Groningen, The Netherlands) to determine the peak power output (Wmax) and maximum heart rate (HRmax). Four to 7 d after the incremental exercise test, the subjects returned to The University of Melbourne after a 12-h overnight fast, having refrained from alcohol, tobacco, and caffeine intake for at least 24 h. The baseline muscle samples (170 ± 61 mg) were obtained from the vastus lateralis using the percutaneous needle biopsy technique with suction. The samples were immediately frozen in liquid nitrogen and stored for later analysis. The subjects then completed a 75-g OGTT as described previously. One to 2 d after the muscle biopsy and OGTT, the patients with T2D began 4 wk of endurance exercise training (described in the succeeding part of this article). On the final day of the exercise training, the incremental exercise test to volitional exhaustion was repeated. The posttraining muscle biopsy specimens were collected approximately 48 h after the last exercise bout (T2D Post). The OGTT was also repeated at this time. The control subjects did not undergo the exercise training program and were recruited for baseline comparison only.
The patients with T2D completed a 4-wk supervised exercise training program. The participants exercised 5 d each week on a stationary cycle ergometer. The exercise training program comprised a combination of continuous moderate-intensity exercise (60 min of exercise at approximately 55% Wmax 3 d·wk−1) and intermittent high-intensity exercise (6 × 5-min bouts at approximately 70% Wmax 2 d·wk−1) as previously described in the study by Bruce et al. (5).
Biochemical analysis and estimation of insulin sensitivity
Plasma glucose was determined using an ILab 650 analyser (Instrumentation Laboratory, Cheshire, UK). Plasma insulin concentrations were analyzed using an enzyme-linked immunosorbent assay (DRG Instruments, Marburg, Germany). Insulin sensitivity was estimated from glucose and insulin concentrations before and during the OGTT (Matsuda index) (23).
Whole protein muscle extraction
The frozen muscle (approximately 60–80 mg) was homogenized using a Polytron homogenizer (Brinkman, Riverview, FL) in freshly prepared ice-cold lysis buffer (50 mM Tris, pH 7.5, 1 mM EDTA, 1 mM EGTA, 10% glycerol, 1% Triton X-100, 50 mM NaF, 5 mM Na pyrophosphate, 1 mM DTT, and 1-μL protease inhibitor cocktail per 10-mg tissue) on ice for approximately 3 × 10 s. The homogenate was then centrifuged at 14g for 20 min at 4°C. The supernatant was collected and stored at −80°C for later analysis. The total protein content was measured using the Bradford method.
Gel electrophoresis, protein alkylation, and in-gel trypsin digestion
Equal amounts of muscle lysate proteins (60 μg of total protein) were loaded onto 4%–20% 10-well resolving gels (Tris–HCl ready gels; Bio-Rad, Hercules, CA) and subjected to SDS-PAGE (50 V for 30 min and 100 V for 85 min). After electrophoresis, the proteins were visualized with a Coomassie stain (Coomassie Brilliant Blue R-250 staining solution, Bio-Rad). The gel lane resulting from each experiment was cut into 20 slices of approximately equal size. Each gel slice was further cut into 1-mm cubes. The cubes were placed in a 0.6-mL polypropylene tube before trypsin digestion as previously described (14). Briefly, the cubes were washed with 400 μL of water, destained twice with 300 μL of 50% acetonitrile (ACN) in 40 mM NH4HCO3, and dehydrated with 100% ACN for 20 min. The ACN was then removed by aspiration, and the gel pieces were dried in a vacuum centrifuge at 62°C for 30 min. Trypsin (250 ng; Sigma Chemical Co., St. Louis, MO) in 20 μL of 40 mM NH4HCO3 was added, and the samples were maintained at 4°C for 15 min before the addition of 50 μL of 40 mM NH4HCO3 containing three 10 fmol·μL−1 peptides to serve as the internal standards (bradykinin fragment 2–9, B1901, β-sheet breaker peptide, S7563, and anaphylatoxin C3a fragment, A8651; Sigma Chemical Co.). The digestion process took place overnight for 12 h at 37°C and was terminated by the addition of 20 μL of 5% formic acid (FA). Each supernatant was incubated at 37°C for a further 30 min and was centrifuged for 1 min before being transferred to a clean polypropylene tube. The extraction procedure was repeated using 40 μL of 0.5% FA, and the two extracts were combined. The sample volume was reduced to 5 μL by vacuum centrifugation, and 10 μL of 0.1% heptafluorobutyric acid/4% FAN was added. The resulting peptide mixtures were purified by solid-phase extraction (C18 ZipTip; Millipore, Billerica, MA) after sample loading in 0.005% heptafluorobutyric acid/5% FA (v/v) and elution with 4 μL of 50% ACN/1% FA (v/v) and 4 μL of 80% ACN/1% FA (v/v). The elutes were combined and dried by vacuum centrifugation, and 10μL of 0.5% FA/2 ACN (v/v) were added and loaded for analysis.
Protein assignment using HPLC–ESI–MS/MS
Proteins were identified using HPLC–ESI–MS/MS on a hybrid linear ion trap (LTQ)-Fourier transform ion cyclotron resonance mass spectrometer (Thermo-Fisher, San Jose, CA) fitted with a PicoView nanospray source (New Objective, Woburn, MA), as previously described (14). HPLC separations were accomplished with a linear gradient of 2% to 27% ACN in 0.1% FA in 70 min, a hold of 5 min at 27% ACN, followed by a step to 50% ACN, a hold of 5 min, and then a step to 80%, a hold of 5 min; flow rate, 300 nL·min−1. Because 18 samples were analyzed (six control, six T2D Pre, and six T2D Post subjects), a total of 360 HPLC–MS/MS runs were performed.
Data analysis and bioinformatics
Tandem mass spectra were extracted from Xcalibur “RAW” files, and charge states were assigned using the Extract_MSN script (Xcalibur 2.0 SR2, Thermo-Fisher) as previously described (13). Mascot (version 2.2; Matrix Science, London, UK) was used to search the fragment mass spectra against the IPI-HUMAN_v3.54 database (68,020 entries, http://www.ebi.ac.uk/IPI). The following search parameters were used: 10 ppm mass tolerance for precursor ion masses and 0.5 Da for product ion masses; digestion with trypsin; a maximum of two missed tryptic cleavages; and variable modifications of oxidation of methionine and phosphorylation of serine, threonine, and tyrosine. Scaffold (version Scaffold-01_06_19; Proteome Software Inc., Portland, OR) was used to generate the probability assessments of all peptide and protein assignments. Only peptides with>95% probability were considered. Criteria for protein assignment included detection of at least two unique peptides and a probability score of >99%.
Normalized spectral abundance factors
Normalized spectral abundance factors (NSAF) were used to quantify the protein abundance for each sample as previously described (20). The spectral abundance factor (SAF) was calculated to normalize the MS/MS spectra against the length/number amino acids (AA) of each protein using the following equation:
Each SAF was then normalized against the sum of all SAF in one sample, resulting in the NSAF value. For a protein, i, the NSAF, where N is the total number of proteins detected in a sample, was calculated by
In samples in which no spectra for a protein were observed, the NSAF value for that protein for that sample was set to zero, and zeroes were included in all analysis of single protein abundance differences.
Statistical analysis
To identify proteins that were different between the subject/treatment groups, two key criteria were required. First, only the proteins detected in at least half (6 of 12) of the samples compared in each subject/treatment group were considered. For example, a protein found in five control (n = 6) and one T2D Pre (n = 6) samples (total 6 of 12) would be considered for further analysis. Similarly, a protein found in four T2D Pre (n = 6) and three T2D Post (n = 6) samples (total 7 of 12) would be considered. Second, of the proteins that were assigned in at least 6 of 12 samples, only those significantly different by t-test StatView (SAS Institute, 1998) at the level of 0.05 are presented.
Data are presented as mean ± SEM. Baseline parameters were compared between the groups using unpaired Student t-tests (control vs T2D Pre). The measurements made across the experimental period were compared using a paired t-test (T2D Prevs T2D Post). The significance level was set at P< 0.05.
RESULTS
Subject characteristics
The clinical and laboratory characteristics of the control subjects and T2D subjects at the baseline (T2D Pre) are shown in Table 1. There were no differences in the age, body mass, BMI, or waist girth between the control and T2D subjects (Table 1). The Wmax and HRmax of the incremental exercise test were also not different between the subject groups. Subjects with T2D had higher fasting and 2-h OGTT plasma glucose concentrations compared with the control subjects (P< 0.05, Table 1).
Table 1.
Clinical and laboratory characteristics of control subjects and patients with T2D before (T2D Pre) and after (T2D Post) exercise training.
| Control | T2D Pre | T2D Post | |
|---|---|---|---|
| Sex (M/F) | 4M/2F | 4M/2F | ------- |
| Age (yr) | 48 ± 2 | 54 ± 4 | ------- |
| Body mass (kg) | 80 ± 6 | 88 ± 11 | 85 ± 11 |
| BMI (kg.m−2) | 28 ± 2 | 29 ± 2 | 29 ± 2 |
| Waist Girth (cm) | 98 ± 5 | 105 ± 7 | 102 ± 7b |
| Wmax (W) | 202 ± 25 | 173 ± 25 | 194 ± 28b |
| HRmax (bpm) | 170 ± 6 | 165 ± 3 | 170 ± 4b |
| Fasting glucose (mmol.l−1) | 5.8 ± 0.4 | 9.8 ± 1.2a | 8.9 ± 0.9b |
| 2 h plasma glucose (mmol.l−1) | 6.2 ± 0.2 | 17.9 ± 2.4 | 15.6 ± 2.4 |
| Fasting insulin (pmol.l−1) | 59 ± 13 | 79 ± 24 | 70 ± 12 |
| Matsuda Index | 5.74 ± 1.30 | 3.24 ± 0.36 | 3.78 ± 0.68 |
| Triglycerides (mmol.l−1) | 1.35 ± 0.3 | 2.47 ± 0.62 | 2.29 ± 0.56 |
| Total cholesterol (mmol.l−1) | 5.87 ± 0.52 | 5.93 ± 0.29 | 5.20 ± 0.21 |
| HDL cholesterol (mmol.l−1) | 1.16 ± 0.03 | 1.10 ± 0.1 | 1.07 ± 0.1 |
Data are given as means ± SE (n=6).
p<0.05 vs. control;
p<0.05 vs. type 2 diabetes pre. HRmax, maximum heart rate during incremental exercise test to exhaustion; Wmax, peak power.
Exercise training improves exercise characteristics in patients with T2D
During the continuous moderate-intensity exercise sessions, the average power output was 92 ± 12 W (53%± 1% Wmax) and the average heart rate was 125 ± 2 bpm (74%± 2% HRmax). During the intermittent high-intensity exercise, the average power output was 124 ± 16 W (72%± 2% HRmax) and the average heart rate was 147 ± 2 bpm (87%± 4% HRmax). The exercise training had no effect on the body mass or BMI but significantly reduced the waist girth in all the patients with T2D (P< 0.05, Table 1). The Wmax was increased by approximately 15% (Table 1, P< 0.05), and this may explain the marginal increase (4%) in HRmax, which was observed after training (Table 1, P< 0.05). Fasting plasma glucose and insulin concentrations were unaffected by the exercise training (Table 1). There was a tendency for reduced (P = 0.09) 2-h plasma glucose levels during the OGTT. In addition, there was a tendency for a higher (P = 0.1) Matsuda index (Table 1).
Exercise training alters protein abundance in patients with T2D
In the patients with T2D, the exercise training significantly altered the 17 proteins (12 increased and 5 decreased (P< 0.05, Table 2)) that were related to energy metabolism, the cytoskeleton, or that whose function is skeletal muscle, which is currently unknown.
Table 2.
Proteins in skeletal muscle differing significantly among groups
| Protein name | NSAF | Number of subjects with protein assigned | Total spectra per group | ||||||
|---|---|---|---|---|---|---|---|---|---|
|
| |||||||||
| Control | T2D Pre | T2D Post | Control | T2D Pre | T2D Post | Control | T2D Pre | T2D Post | |
| GOT2 Aspartate aminotransferase | 31.8 ± 2.4 | 22.8 ± 1.7* | 27.2 ± 2.4# | 6 | 6 | 6 | 530 | 390 | 476 |
| MYH1 Myosin-1 | 25.2 ± 10 | 68.1 ± 11.3* | 55.2 ± 7.3* | 4 | 6 | 6 | 1980 | 4811 | 3976 |
| UCRC Cytochrome b-c1 complex subunit 9 | 19.8 ± 1.3 | 8.9 ± 4.0* | 15.4 ± 3.9 | 6 | 3 | 5 | 48 | 26 | 40 |
| DCXR L-xylulose reductase | 3.0 ± 0.4 | 1.2 ± 0.6* | 1.3 ± 0.6 | 6 | 3 | 3 | 29 | 13 | 15 |
| MT-CO2 Cytochrome c oxidase subunit 2 | 22.2 ± 1.8 | 16.4 ± 1.4* | 18.0 ± 2.4 | 6 | 6 | 6 | 193 | 145 | 158 |
| AHSG cDNA FLJ55606, highly similar to Alpha- 2-HS-glycoprotein | 1.0 ± 0.5 | 3.0 ± 0.7* | 2.8 ± 0.5* | 3 | 6 | 6 | 17 | 43 | 41 |
| MDH2 Malate dehydrogenase | 58.1 ± 3.8 | 46.9 ± 2.5* | 53.5 ± 4.4 | 6 | 6 | 6 | 753 | 623 | 697 |
| ATP5A1 ATP synthase subunit α | 79.2 ± 6.3 | 61.2 ± 3.6* | 67.0 ± 4.8 | 6 | 6 | 6 | 1705 | 1309 | 1468 |
| GOT1 Aspartate aminotransferase, cytoplasmic | 40.0 ± 3.9 | 29.8 ± 1.5* | 36.1 ± 2.9# | 6 | 6 | 6 | 648 | 471 | 589 |
| AKR1B1 Aldose reductase | 15.1 ± 0.9 | 12.0 ± 1.0* | 11.7 ± 1.0* | 6 | 6 | 6 | 183 | 147 | 142 |
| TF Serotransferrin | 7.1 ± 1.5 | 12.9 ± 1.9* | 12.1 ± 2.9 | 6 | 6 | 6 | 194 | 325 | 328 |
| ATP5F1 ATP synthase subunit b | 25.6 ± 1.9 | 18.6 ± 2.3* | 18.2 ± 4.1 | 6 | 6 | 6 | 255 | 189 | 187 |
| PHB2 Prohibitin-2 | 12.88 ± 1.63 | 8.07 ± 1.30* | 9.68 ± 1.68 | 6 | 6 | 6 | 148 | 95 | 116 |
| GPD1L Glycerol-3- phosphate dehydrogenase 1-like protein | 4.7 ± 0.5 | 3.3 ± 0.4* | 3.6 ± 0.3* | 6 | 6 | 6 | 62 | 44 | 48 |
| ECH1 Delta(3,5)- Delta(2,4)-dienoyl-CoA isomerase | 16.1 ± 1.5 | 11.4 ± 1.4* | 15.2 ± 2.0 | 6 | 6 | 6 | 201 | 145 | 195 |
| CKMT2 Creatine kinase | 29.4 ± 2.0 | 26.7 ± 3.1 | 38.3 ± 4.4# | 6 | 6 | 6 | 476 | 454 | 668 |
| LDHB Lactate dehydrogenase B chain | 20.9 ± 5.0 | 10.2 ± 2.8 | 15.4 ± 3.1# | 6 | 6 | 6 | 259 | 121 | 191 |
| ANXA2 Annexin A2 | 16.9 ± 2.8 | 13.9 ± 1.0 | 17.3 ± 1.7# | 6 | 6 | 6 | 232 | 187 | 233 |
| UQCRC2 Cytochrome b- c1 complex subunit 2 SUCLA2 Isoform 1 of | 22.2 ± 2.1 | 20.0 ± 2.09 | 23.9 ± 1.9# | 6 | 6 | 6 | 390 | 365 | 439 |
| Succinyl-CoA ligase [ADP-forming] subunit beta | 4.0 ± 1.0 | 3.1 ± 0.8 | 4.9 ± 1.0# | 5 | 5 | 5 | 70 | 59 | 93 |
| PDLIM3 Isoform 1 of PDZ and LIM domain protein 3 | 24.9 ± 2.9 | 22.7 ± 2.9 | 17.8 ± 1.9# | 6 | 6 | 6 | 355 | 316 | 251 |
| PTGES2 Prostaglandin E synthase | 2.5 ± 0.8 | 1.4 ± 0.6 | 2.5 ± 0.6# | 4 | 4 | 5 | 38 | 24 | 41 |
| PFKM Isoform 1 of 6- phosphofructokinase EEF1G cDNA | 27.8 ± 3.9 | 36.3 ± 5.0 | 27.3 ± 4.2# | 6 | 6 | 6 | 834 | 1090 | 817 |
| FLJ56389, highly similar to Elongation factor 1-γ | 3.1 ± 0.4 | 2.3 ± 0.4 | 3.3 ± 0.5# | 6 | 6 | 6 | 55 | 41 | 57 |
| FH Isoform Cytoplasmic of Fumarate hydratase | 9.5 ± 0.8 | 8.3 ± 0.9 | 10.6 ± 0.7# | 6 | 6 | 6 | 180 | 161 | 206 |
| ALDOA Fructose- bisphosphate aldolase A | 256.9 ± 28.5 | 267.2 ± 22.0 | 234.9 ± 22.2# | 6 | 6 | 6 | 3510 | 3749 | 3320 |
| HADHA Trifunctional enzyme subunit α | 26.54 ± 1.68 | 21.15 ± 1.89 | 25.61 ± 2.44# | 6 | 6 | 6 | 774 | 632 | 757 |
| IDH2 Isocitrate dehydrogenase [NADP] | 53.0 ± 4.7 | 44.0 ± 3.9 | 54.4 ± 3.0# | 6 | 6 | 6 | 908 | 771 | 975 |
| GLO1 Lactoylglutathione lyase | 7.8 ± 1.5 | 9.7 ± 1.7 | 5.6 ± 2.0# | 6 | 6 | 6 | 58 | 73 | 44 |
| NDUFB8 NADH dehydrogenase (Ubiquinone) 1 beta subcomplex, 8 | 0.3 ± 0.3 | 1.3 ± 0.6 | 2.4 ± 0.5* | 1 | 5 | 5 | 5 | 10 | 17 |
| CRYAB Alpha-crystallin B chain | 149.5 ± 15.5 | 108.9 ± 9.8 | 91.0 ± 13.3* | 6 | 6 | 6 | 986 | 714 | 595 |
Data are given as Mean ± SEM for Normalized Spectral Abundance Factors (NSAF) × 104. NSAF is calculated as described in the text. Total spectra = sum of spectra across six subjects in each group.
P < 0.05 vs. Controls,
P < 0.05 pre vs. post training.
The exercise training caused an increase in nine proteins involved in energy metabolism via glycolysis (Fig. 1A), the tricarboxylic acid cycle (TCA cycle) (Fig. 1B), the electron transport chain (ETC) (Fig. 2A), the NADH shuttles (Fig. 3), or β-oxidation (Fig. 2B). Of these nine proteins, one was cytosolic (lactate dehydrogenase B chain (gene name, LDHB)) and eight were mitochondrial (creatine kinase (CKMT2), aspartate aminotransferase (gene name, GOT2), acetyl-coA-acetyltransferase (ACAT1), cytochrome b-c1 complex subunit 2 (UQCRC2), isoform 1 of succinyl-CoA ligase (ADP-forming) subunit beta (SUCLA2), isoform cytoplasmic of fumarate hydratase (FH), trifunctional enzyme subunit alpha (HADHA), and isocitrate dehydrogenase (IDH2)). Training also reduced the abundance of three glycolytic proteins (Fig. 1A): isoform 1 of 6-phosphofructokinase (PFKM) and fructose-biophosphate aldolase A (ALDOA), and lactoylglutathione lyase or glyoxalase 1 (GLO1).
FIGURE 1.
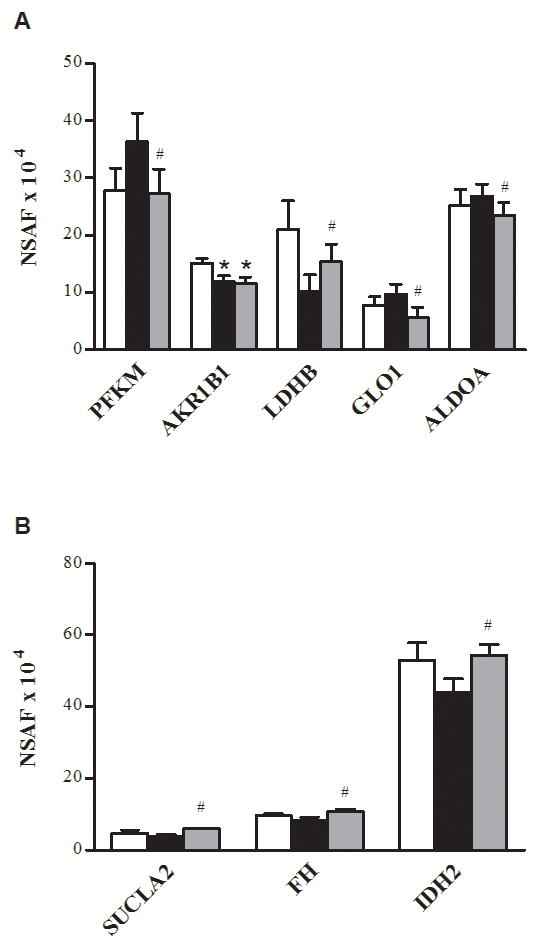
Proteins of glycolysis and the TCA cycle. Relative changes in abundance of proteins of glycolysis (A) and the TCA cycle (B) in the control (□), T2D Pre (■), and T2D Post (■). The data are means ± SEM (n = 6). *Significantly different from the control, P< 0.05. #Significantly different from T2D Pre, P< 0.05. Note that ALDOA is presented as NSAF ×103.
FIGURE 2.

Proteins of the ETC andβ-oxidation. Relative changes in the abundance of proteins of the ETC (A) and β-oxidation (B) in the control (□), T2D Pre (■), and T2D Post (■). The data are means ± SEM (n = 6). *Significantly different from the control, P< 0.05. #Significantly different from T2D Pre, P< 0.05.
FIGURE 3.
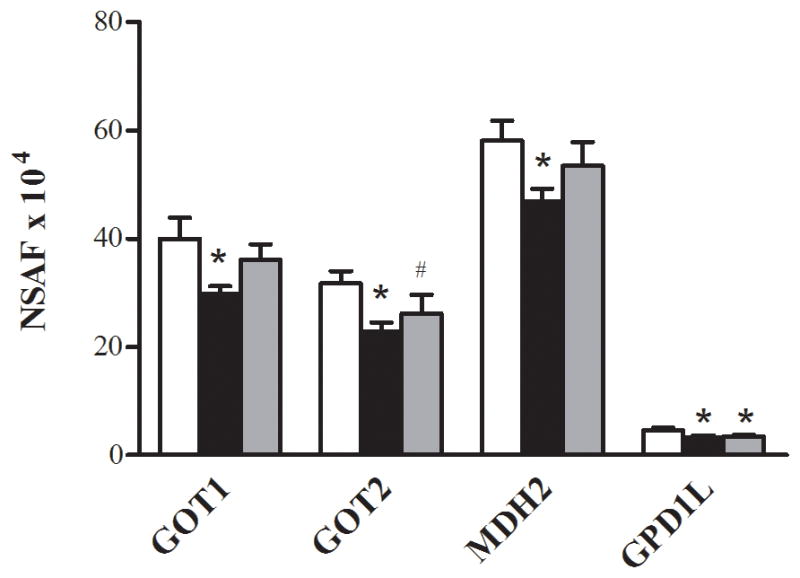
Proteins of the NADH shuttles. Relative changes in the abundance of proteins of the NADH shuttles in the control (□), T2D Pre (■), and T2D Post (■). The data are means ± SEM (n = 6). *Significantly different from the control, P< 0.05. #Significantly different from T2D Pre, P< 0.05.
The exercise training altered two proteins associated with the cytoskeleton (Fig. 4). Annexin, a protein important in cytoskeletal organization, was increased after the exercise training. Conversely, the isoform 1 of PDZ and LIM domain protein (PDLIM3) decreased after the exercise training.
FIGURE 4.
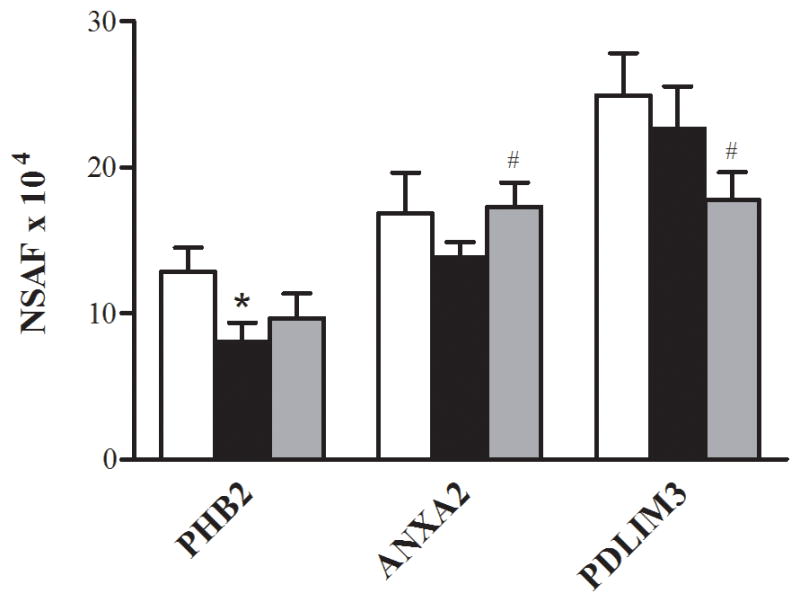
Cytoskeletal proteins. Relative changes in the abundance of cytoskeletal proteins in the control (□), T2D Pre (■), and T2D Post (■). Data are means ± SEM (n = 6). #Significantly different from T2D Pre, P< 0.05.
The remaining proteins that were altered with the exercise training have functions that are not well characterized in skeletal muscle. The training increased prostaglandin E synthase 2 (PTGES2) and the protein highly similar to the elongation factor 1-gamma (EEF1G cDNA FLJ56389) and decreased the protein highly similar to adenylosuccinate lyase (ADSL cDNA FLJ59367) (P< 0.05, Table 2).
Differences in protein abundance between patients with T2D and control subjects
Of the 438 proteins that were assigned as present in at least half (6 of 12) of the subjects at the baseline, 15 proteins were significantly different between the control and T2D Pre. Of these, 13 were lower in the patients with T2D when compared with the control subjects (P< 0.05, Table 2). Ten of the 13 proteins that were lower in the patients with T2D were the proteins related to energy metabolism via glycolysis (Fig. 1A), the ETC (Fig. 2A), β-oxidation (Fig. 2B), or NADH shuttles (Fig. 3). Of these 10 proteins, three were cytosolic (aspartate aminotransferase (GOT1), malate dehydrogenase (MDH2), and aldose reductase (AKR1B1)), whereas seven were mitochondrial (aspartate aminotransferase (GOT2), cytochrome b-c1 complex subunit 9 (UCRC), cytochrome c oxidase subunit 2 (MT-CO2), malate dehydrogenase (MDH2), ATP synthase subunit alpha (ATP5A1), ATP synthase subunit b (ATP5F1), and delta(3,5)-delta(2,4)-dienoyl-CoA isomerase (ECH1)). The remaining three proteins that were lower in abundance in the T2D Pre compared with the control included L-xylulose reductase (DCXR), serotransferrin (gene name, TF), and prohibitin-2 (PHB2) (Fig. 4). Two proteins were greater in abundance in the T2D Pre compared with the controls, including myosin-1 (gene name, MYH1) and a protein highly similar to alpha-2-HS-glycoprotein (AHSG cDNA FLJ55606), which has not been well characterized in skeletal muscle (P< 0.05, Table 2).
DISCUSSION
The positive effect of exercise training on skeletal muscle proteins has been well characterized in healthy, insulin-sensitive individuals but is less well characterized in insulin-resistant patients with T2D. To assess this, we determined the insulin action and metabolic characteristics before and after 4 wk of exercise training and used HPLC–ESI–MS/MS to define the global changes in muscle protein abundance. A control group comprised BMI- and age-matched nondiabetic volunteers who did not exercise. In the patients with T2D, there was a trend (P = 0.1) for Matsuda index (23), which is highly correlated with the rate of whole-body glucose disposal during a euglycemic–hyperinsulinemic clamp (23), to be increased by approximately 17% after exercise training. Because of variability in the preexercise state and the small subject size, this effect did not achieve statistical significance. In a similar group of patients with T2D, 8 wk of training improved the insulin-stimulated glucose disposal from 4.3 to 5.5 mg·kg−1·min−1 (6), so it would be expected that 4 wk of training would produce only a modest, perhaps marginal, effect.
Concerning the protein abundance changes induced by exercise training, we found that training increased the abundance of the NADH shuttle enzyme GOT2, the expression of TCA cycle proteins (SUCLA2, FH, and IDH2), and a component of complex III ETC (UQCRC2). At the same time, the exercise training reduced the abundance of the cytosolic proteins involved in glycolysis (PFKM, GLO1, and ALDOA). We found that the exercise training increased the protein abundance of the key proteins in the NADH shuttle system in individuals with T2D (P< 0.05, Fig. 3). The NADH shuttle system transfers the reducing equivalents as NADH and H+ between the site of generation in the cytosol and the site of oxidation in the mitochondria (8). In the present study, the MA shuttle enzymes (GOT1, GOT2, and MDH2) were significantly reduced by approximately 25%, 30%, and 45%, respectively, in the patients with T2D at the baseline, whereas there was a trend for MDH1 to be reduced by 20% (P = 0.06). GPD1L, a protein that has 84% homology with the glycerol phosphate enzyme GPD1, also was significantly reduced by approximately 40% in the patients with T2D. The reduced abundance and activity of these NADH shuttle enzymes would restrict the transfer of NADH to the mitochondria, ultimately limiting the oxidative phosphorylation. The exercise training increased mitochondrial GOT2 abundance, and there was also a trend for GOT1 to be increased. Consistent with our data, an increase in MA shuttle proteins has been reported previously after training in lean men (26). In accordance with the increase in MA shuttle enzymes after training, which is an approximately 50% increase in the heart-type isoform of lactate dehydrogenase, LDHB was also observed. LDHB exhibits a high affinity for the conversion of lactate to pyruvate and is preferentially expressed in oxidative tissues. Coordinated increases in the mRNA levels of GOT1, LDHB, and pyruvate dehydrogenase α1 subunit have previously been observed in overweight individuals with metabolic syndrome after exercise training, in association with reduced plasma lactate concentrations (12). These findings and ours suggest that increases in MA shuttle proteins may contribute to the enhanced NADH availability in mitochondria after exercise training.
In the present investigation, the exercise training decreased the abundance of some cytosolic proteins of glycolysis (PFKM, GLO1 and ALDOA) in the patients with T2D (P< 0.05, Fig. 1A). PFKM is a glycolytic enzyme that plays a pivotal role in glycogen metabolism, catalyzing the conversion of fructose-6-phosphate to fructose-1,6-bisphosphate (19). The PFKM was significantly reduced after training, a finding that has been reported previously, which may be a consequence of a higher cytoplasmic ATP/ADP ratio (16) or reduced levels of plasma catecholamines (21). Aldolase A (ALDOA) and glyoxalase 1 (GLO1) were also significantly reduced after training. Together, these training-mediated adaptations may contribute to a decreased rate of glycolysis and an enhanced ability to use the higher energy yielding pathways of oxidative phosphorylation (10,16). In the present study, in addition to the increase in TCA cycle enzymes, HADHA, a mitochondrial enzyme that catalyzes the last three steps of mitochondrial β-oxidation of long-chain fatty acids, was also significantly increased after training (P< 0.05, Fig. 2B). The increase in HADHA after training in lean healthy individuals has been reported (18). The decrease in glycolytic enzymes and the increase in TCA cycle enzymes could serve to correct the imbalance in these pathways described previously in the patients with T2D (27). Furthermore, the increase in TCA cycle proteins, β-oxidation enzymes, and NADH shuttle proteins after exercise training should provide increased NADH to supply electrons to the ETC. However, with the exception of the complex III (FADH-utilizing) subunit UQCRC2, the training-induced increases in enzymes that would increase NADH supply were not accompanied by increases in ETC proteins. Complex I is the main entry point for NADH into electron transport, and we have previously demonstrated that as a whole, and individually, these proteins are dramatically reduced in individuals with insulin resistance and T2D (20,22). We also observed an imbalance between NADH-supplying and NADH-utilizing proteins and postulated that this resulted in elevated reactive oxygen species release by mitochondria from insulin-resistant muscle (22).
It has also been reported that insulin-resistant muscle has a reduced response to exercise for PGC-1α and other genes in the ETC (9). This could be responsible for the imbalanced response between NADH-producing and NADH-consuming proteins observed here with the exercise training and may partly explain why exercise training has modest effects on insulin action in the muscle of the patients with T2D.
Although the majority of proteins altered by T2D and/or exercise training were proteins of energy metabolism, we also identified some proteins colocalized to the cytoskeleton, which were differentially expressed, including prohibitin-2 (PHB2), annexin 2 (ANXA2), and PDZ and LIM domain 3 (PDLIM3). Previously, we described a reduction in major muscle structural proteins such as α-actinin 2 and desmin in the muscle from insulin-resistant patients (7,20). The actin cytoskeleton is required for short-distance mitochondrial movements and for immobilization of mitochondria at the cell cortex (4). As such, an interaction between mitochondria with the cytoskeleton is required for normal mitochondrial function (4), and it has been hypothesized that altered abundance of cytoskeletal proteins might play a role in mitochondrial dysfunction in patients with T2D (20). In the present study, the α-actinin 2-associated prohibitin-2 protein was reduced by approximately 35% in the skeletal muscle of patients with T2D when compared with age- and BMI-matched control subjects (P< 0.05, Fig. 4), and there was a trend for PHB2 to be increased by approximately 20% after exercise training (P< 0.1, Fig. 4). In the present study, the ANXA2 was increased by approximately 25% after exercise training in the patients with T2D (P< 0.05, Fig. 4), whereas PDLIM3, another protein that binds to ACTN2, was reduced by approximately 20% after training (P< 0.05, Fig. 4). The ACTN2 and ANXA2 are involved in the organization of the cortical actin cytoskeleton (2), a process that appears to be essential for mitochondrial function (25). Because the ANXA2, PHB2, and PDLIM3 form part of a multimeric complex on the cytoskeleton, their altered abundance after training may be a mechanism by which exercise training coordinates an increase in newly synthesized mitochondrial proteins, using enhanced mitochondria–cytoskeleton interactions.
In addition to their role in the cytoskeletal assembly, the PHB2, ANXA2, and muscle lim protein (MLP), which is similar to PDLIM3, have been linked to other metabolic functions relevant to T2D. PHB2 is expressed in the inner mitochondrial membrane where it acts as a chaperone for the stabilization of newly synthesized mitochondrial-encoded proteins, including the subunits of the mitochondrial respiratory complex (24). Reduced PHB2 abundance in mitochondria would limit mitochondrial biogenesis, and as such, future studies should assess the effects of T2D and exercise training on mitochondrial-specific PHB2. PHB2 may also translocate to the nucleus where it acts as a transcriptional repressor. In C2C12 myoblasts, the PHB2 repressed the transcriptional activation of the transcription factors MEF2 and MyoD, a process mediated by recruitment of the repressor HDAC1 (28). Because MEF2 DNA-binding activity is reduced in diabetic mice (29) and because MEF2 binding sites are on the promoter regions of many exercise-responsive genes, including genes that encode for GLUT4 and mitochondrial proteins (15), our finding that PHB2 protein abundance is altered by T2D and exercise training is intriguing and warrants further investigation.
In summary, the present study identified altered patterns in the abundance of several proteins involved in energy metabolism and cytoskeletal structure exercise training in patients with T2D. These data extend the findings from previous exercise training studies and provide a global picture of skeletal muscle adaptations that occur after 4 wk of exercise training. The key training adaptations include an increase in MA shuttle proteins, increased ratio of oxidative to glycolytic proteins, and altered abundance of cytoskeleton proteins, which may have diverse functions including cytoskeletal assembly, cytoskeleton interactions with mitochondria, gene transcription, and mitochondrial stability. These findings open new avenues for future research, including investigations to elucidate the physiological consequence of altered cytoskeletal protein abundance after exercise training, and the role that these proteins may play in the regulation of insulin action.
The authors gratefully acknowledge the subjects for their commitment during this study and the expert editorial assistance of Irene Beauvais. This research was supported by the Diabetes Australia Research Trust Grant to M. Hargreaves and The Melbourne Abroad Travelling Scholarship to S. E. Hussey. Hussey and Sharoff contributed equally to this work. There are no relationships that could be construed as resulting in an actual, potential, or apparent conflict of interest concerning this manuscript being submitted for review. Neither this submitted article nor any similar article, in whole or in part, other than the abstract or preliminary communication, has been or will be submitted to or published in any other scientific journal. The results of the present study do not constitute endorsement by the American College of Sports Medicine.
References
- 1.Aebersold R, Mann M. Mass spectrometry-based proteomics. Nature. 2003;422(6928):198–207. doi: 10.1038/nature01511. [DOI] [PubMed] [Google Scholar]
- 2.Babiychuk EB, Draeger A. Annexins in cell membrane dynamics. Ca(2+)-regulated association of lipid microdomains. J Cell Biol. 2000;150(5):1113–24. doi: 10.1083/jcb.150.5.1113. [DOI] [PMC free article] [PubMed] [Google Scholar]
- 3.Baldwin KM. Research in the exercise sciences: where do we go from here? J Appl Physiol. 2000;88(1):332–6. doi: 10.1152/jappl.2000.88.1.332. [DOI] [PubMed] [Google Scholar]
- 4.Boldogh IR, Pon LA. Interactions of mitochondria with the actin cytoskeleton. Biochim Biophys Acta. 2006;1763(5–6):450–62. doi: 10.1016/j.bbamcr.2006.02.014. [DOI] [PubMed] [Google Scholar]
- 5.Bruce CR, Kriketos AD, Cooney GJ, Hawley JA. Disassociation of muscle triglyceride content and insulin sensitivity after exercise training in patients with type 2 diabetes. Diabetologia. 2004;47(1):23–30. doi: 10.1007/s00125-003-1265-7. [DOI] [PubMed] [Google Scholar]
- 6.Christ-Roberts CY, Pratipanawatr T, Pratipanawatr W, et al. Exercise training increases glycogen synthase activity and GLUT4 expression but not insulin signaling in overweight nondiabetic and type 2 diabetic subjects. Metabolism. 2004;53(9):1233–42. doi: 10.1016/j.metabol.2004.03.022. [DOI] [PubMed] [Google Scholar]
- 7.Coletta DK, Mandarino LJ. Mitochondrial dysfunction and insulin resistance from the outside in: extracellular matrix, the cytoskeleton, and mitochondria. Am J Physiol Endocrinol Metab. 2011;301(5):E749–55. doi: 10.1152/ajpendo.00363.2011. [DOI] [PMC free article] [PubMed] [Google Scholar]
- 8.Dawson AG. Oxidation of cytosolic NADH formed during aerobic metabolism in mammalian cells. Trends in Biochem Sci. 1979;4(8):171–6. [Google Scholar]
- 9.De Filippis E, Alvarez G, Berria R, et al. Insulin-resistant muscle is exercise resistant: evidence for reduced response of nuclear-encoded mitochondrial genes to exercise. Am J Physiol Endocrinol Metab. 2008;294(3):E607–14. doi: 10.1152/ajpendo.00729.2007. [DOI] [PubMed] [Google Scholar]
- 10.Gollnick PD, Saltin B. Significance of skeletal muscle oxidative enzyme enhancement with endurance training. Clin Physiol. 1982;2(1):1–12. doi: 10.1111/j.1475-097x.1982.tb00001.x. [DOI] [PubMed] [Google Scholar]
- 11.Hawley JA. Exercise as a therapeutic intervention for the prevention and treatment of insulin resistance. Diabetes Metab Res Rev. 2004;20(5):383–93. doi: 10.1002/dmrr.505. [DOI] [PubMed] [Google Scholar]
- 12.Hittel DS, Kraus WE, Tanner CJ, Houmard JA, Hoffman EP. Exercise training increases electron and substrate shuttling proteins in muscle of overweight men and women with the metabolic syndrome. J Appl Physiol. 2005;98(1):168–79. doi: 10.1152/japplphysiol.00331.2004. [DOI] [PubMed] [Google Scholar]
- 13.Hojlund K, Bowen BP, Hwang H, et al. In vivo phosphoproteome of human skeletal muscle revealed by phosphopeptide enrichment and HPLC ESI MS/MS. J Proteome Res. 2009;8(11):4954–65. doi: 10.1021/pr9007267. [DOI] [PMC free article] [PubMed] [Google Scholar]
- 14.Hojlund K, Yi Z, Hwang H, et al. Characterization of the human skeletal muscle proteome by one-dimensional gel electrophoresis and HPLC ESI MS/MS. Mol Cell Proteomics. 2008;7(2):257–67. doi: 10.1074/mcp.M700304-MCP200. [DOI] [PMC free article] [PubMed] [Google Scholar]
- 15.Holloszy JO. Regulation by exercise of skeletal muscle content of mitochondria and GLUT4. J Physiol Pharmacol. 2008;59(Suppl 7):5–18. [PubMed] [Google Scholar]
- 16.Holloszy JO, Booth FW. Biochemical adaptations to endurance exercise in muscle. Annu Rev Physiol. 1976;38:273–91. doi: 10.1146/annurev.ph.38.030176.001421. [DOI] [PubMed] [Google Scholar]
- 17.Holloszy JO, Coyle EF. Adaptations of skeletal muscle to endurance exercise and their metabolic consequences. J Appl Physiol. 1984;56(4):831–8. doi: 10.1152/jappl.1984.56.4.831. [DOI] [PubMed] [Google Scholar]
- 18.Holloway KV, O’Gorman M, Woods P, et al. Proteomic investigation of changes in human vastus lateralis muscle in response to interval-exercise training. Proteomics. 2009;9(22):5155–74. doi: 10.1002/pmic.200900068. [DOI] [PubMed] [Google Scholar]
- 19.Howard TD, Akots G, Bowden DW. Physical and genetic mapping of the muscle phosphofructokinase gene (PFKM): reassignment to human chromosome 12q. Genomics. 1996;34(1):122–7. doi: 10.1006/geno.1996.0250. [DOI] [PubMed] [Google Scholar]
- 20.Hwang H, Bowen BP, Lefort N, et al. Proteomics analysis of human skeletal muscle reveals novel abnormalities in obesity and type 2 diabetes. Diabetes. 2010;59(1):33–42. doi: 10.2337/db09-0214. [DOI] [PMC free article] [PubMed] [Google Scholar]
- 21.Jansson E, Hjemdahl P, Kaijser L. Epinephrine-induced changes in muscle carbohydrate metabolism during exercise in male subjects. J Appl Physiol. 1986;60(5):1466–70. doi: 10.1152/jappl.1986.60.5.1466. [DOI] [PubMed] [Google Scholar]
- 22.Lefort N, Yi Z, Bowen B, et al. Proteome profile of functional mitochondria from human skeletal muscle using one-dimensional gel electrophoresis and HPLC ESI MS/MS. J Proteomics. 2009;72(6):1046–60. doi: 10.1016/j.jprot.2009.06.011. [DOI] [PMC free article] [PubMed] [Google Scholar]
- 23.Matsuda M, DeFronzo RA. Insulin sensitivity indices obtained from oral glucose tolerance testing: comparison with the euglycemic insulin clamp. Diabetes Care. 1999;22(9):1462–70. doi: 10.2337/diacare.22.9.1462. [DOI] [PubMed] [Google Scholar]
- 24.Nijtmans LG, de Jong L, Artal Sanz M, et al. Prohibitins act as a membrane-bound chaperone for the stabilization of mitochondrial proteins. EMBO J. 2000;19(11):2444–51. doi: 10.1093/emboj/19.11.2444. [DOI] [PMC free article] [PubMed] [Google Scholar]
- 25.Rappaport L, Oliviero P, Samuel JL. Cytoskeleton and mitochondrial morphology and function. Mol Cell Biochem. 1998;184(1–2):101–5. [PubMed] [Google Scholar]
- 26.Schantz PG, Sjoberg B, Svedenhag J. Malate-aspartate and alpha-glycerophosphate shuttle enzyme levels in human skeletal muscle: methodological considerations and effect of endurance training. Acta Physiol Scand. 1986;128(3):397–407. doi: 10.1111/j.1748-1716.1986.tb07993.x. [DOI] [PubMed] [Google Scholar]
- 27.Simoneau JA, Kelley DE. Altered glycolytic and oxidative capacities of skeletal muscle contribute to insulin resistance in NIDDM. J Appl Physiol. 1997;83(1):166–71. doi: 10.1152/jappl.1997.83.1.166. [DOI] [PubMed] [Google Scholar]
- 28.Sun L, Liu L, Yang XJ, Wu Z. Akt binds prohibitin 2 and relieves its repression of MyoD and muscle differentiation. J Cell Sci. 2004;117(Pt 14):3021–9. doi: 10.1242/jcs.01142. [DOI] [PubMed] [Google Scholar]
- 29.Thai MV, Guruswamy S, Cao KT, Pessin JE, Olson AL. Myocyte enhancer factor 2 (MEF2)-binding site is required for GLUT4 gene expression in transgenic mice. Regulation of MEF2 DNA binding activity in insulin-deficient diabetes. J Biol Chem. 1998;273(23):14285–92. doi: 10.1074/jbc.273.23.14285. [DOI] [PubMed] [Google Scholar]
- 30.Wang Y, Simar D, Fiatarone Singh MA. Adaptations to exercise training within skeletal muscle in adults with type 2 diabetes or impaired glucose tolerance: a systematic review. Diabetes Metab Res Rev. 2009;25(1):13–40. doi: 10.1002/dmrr.928. [DOI] [PubMed] [Google Scholar]