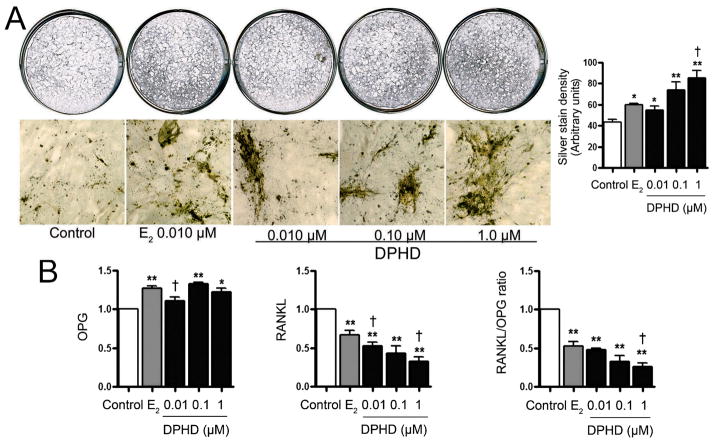
Fig. 5. Effect of DPHD on matrix mineralization and on RANKL and osteoprotegerin mRNAs.
A. Cell cultures at 21 days (top, 4 cm diameter) and photomicrographs of cultures (bottom, 1.6 mm fields) show mineralizing matrix by AgNO3 stain (black), quantified by densitometry in the bar graph (right). E2 (gray bar) and DPHD (closed bars) increased mineralization relative to controls. Mean±SEM from four independent measurements; *p < 0.05, *p < 0.01 versus control; †p < 0.05 versus 10 nM E2.
B. Effect of DPHD (closed bars) on Osteoprotegerin, RANKL mRNAs and the ratio of RANKL/OPG. Values are Mean±SEM from three experiments; *p < 0.05, *p < 0.01 versus control; †p < 0.05 versus E2.

