

Abstract
Purpose
The use of unlabeled exchange-linked dissolution agents (ELDA) in hyperpolarized metabolic imaging was studied to examine pool size limits and saturation relative to the availability of NADH.
Methods
Three-dimensional dynamic metabolic images were obtained, and compared following injection of a bolus of hyperpolarized [1-13C]pyruvate, prepared with and without unlabeled sodium lactate in the dissolution buffer. Comparisons were made on the basis of apparent rate constants and [1-13C]lactate signal-to-noise ratio. Range finding data were obtained for different bolus compositions. Isotope exchange was also probed in the reverse direction, following injection of a bolus of hyperpolarized [1-13C]lactate, with and without unlabeled sodium pyruvate in the dissolution buffer.
Results
Liver, kidney and vascular regions of interest all showed an increase in [1-13C]lactate signal with addition of unlabeled sodium lactate in the dissolution buffer. Injection of hyperpolarized [1-13C]lactate with unlabeled sodium pyruvate in the dissolution buffer, provided exchange rate constants Klp for kidney and vascular regions of interest.
Conclusions
These results are consistent with a high level of 13C-exchange, and with labeling rates that are limited by steady-state pool sizes in vivo.
Keywords: Dissolution-DNP, Hyperpolarized, Metabolic Imaging, 13C
Introduction
The [1-13C]lactate signal, as observed in hyperpolarized [1-13C]pyruvate metabolic imaging, appears to be a good marker for disease progression (1) and response to therapy (2). Under the large [1-13C]pyruvate bolus conditions used in these studies, the formation of [1-13C]lactate is often saturated (3,4). The rate and extent of the [1-13C]lactate signal production under saturated conditions may be limited by pyruvate transport, lactate dehydrogenase (LDH) activity, NADH availability or some combination of these. A recent kinetic modeling study examined 13C-exchange between pyruvate and lactate in a suspension of cancer cells compared with the corresponding cell lysate (5). This study demonstrated that pyruvate transport was not rate limiting and only had a modest effect on the observed rate of [1-13C]lactate produced in the intact cancer cells. In a radioisotope study of whole blood, pyruvate-lactate exchange was found to occur at a rate 3-5 times the rate of pyruvate-to-lactate flux (6). In a hyperpolarized [1-13C]pyruvate study, high concentrations of exogenous [1-13C]pyruvate, added to cells preconditioned with an increased steady-state level of unlabeled lactate, yielded an increased [1-13C]lactate production through a concomitant increase in isotope exchange (2). More recently, the importance of exchange in vivo, under the high bolus concentration and timing of hyperpolarized metabolic imaging, has been demonstrated (7). Kettunen et al. (7) further conclude that steady-state lactate pool size (NADH availability) may be a limit of [1-13C]lactate signal level in regions-of-interest (ROIs) such as blood and muscle. NADH availability, as a saturation limit in hyperpolarized [1-13C]pyruvate metabolic imaging, is further supported by the work of Spielman et al.(8) which shows a substantial [1-13C]lactate increase in liver during the oxidation of ethanol, the metabolic conversion of which produces two molecules of NADH for each molecule of acetate formed.
The primary aim of the study described in this paper is to determine if unlabeled lactate added to a hyperpolarized [1-13C]pyruvate bolus in vivo, can be used to observe and test for pool-size limits, without changing the steady-state condition prior to the arrival of the bolus. A second aim is to investigate 13C-exchange in the reverse direction, by injection of hyperpolarized [1-13C]lactate, in combination with unlabeled pyruvate.
Theory
Ignoring any contribution from transport, the rate of conversion of [1-13C]pyruvate to [1-13C]lactate, Vpl in dissolution-DNP metabolic imaging can be described as:
where under typical pyruvate bolus conditions, the rate of flux, Vflux depends on the concentration of labeled pyruvate [Pyr], and the rate of exchange, Vexchange may or may not be limited by the steady state concentration of lactate [Lac0] so that:
If additional lactate [LacΔ] is added to the system, the rate of [1-13C]lactate production becomes:
Any increase in [1-13C]lactate production, would indicate a steady state pool size limiting condition for that tissue, and can then be described as:
And under conditions where there is an increase in rate, and it is linear with increasing concentration of the unlabeled lactate added to the system, the exchange rate constant can be assumed to be unchanged, and the rate increase simplifies to:
Under these conditions, the increased [1-13C]pyruvate-to-[1-13C]lactate production should match the [1-13C]lactate-to-[1-13C]pyruvate conversion in an experiment in which the hyperpolarized label has been switched from pyruvate to lactate in the bolus. Thus we would expect that [LacΔ] would remain rate limiting for exchange and:
Methods
The experiments were performed on 11 healthy (182-417 g) male Wistar rats, anesthetized with 1-3% isoflurane in oxygen (~1.5 L/min). Except for rat H199 (182 g) and H322 (417g) all of the other animals ranges from 280 to 380 g. Preparation and physiological monitoring of the animals in the 13C experiment followed the protocol approved by the local Institutional Animal Care and Use Committees. Hyperpolarized [1-13C]-pyruvate (Isotec Sigma-Aldrich, St Louis, Mo) and hyperpolarized sodium-L- [1-13C] lactate (Cambridge Isotope Laboratories, Inc; Andover, MA) were prepared using a HyperSense™ polarizer (Oxford Instruments Molecular Biotools, Abingdon, UK). [1-13C]Pyruvate mixtures were polarized as the free acid containing 15 mM OX063 trityl and ~1 mM gadoterate meglumine (Dotarem® Guerbet, Villepinte, France)). The dissolution solvent for the control 80 mM [1-13C]pyruvate studies was 40 mM TRIS/80 mM NaOH/2.7 mM EDTA/40 mM NaCl. This was used for comparison with a dissolution buffer consisting of 40 mM TRIS/80 mM NaOH/2.7 mM EDTA/40 mM sodium-L-lactate. Dissolution buffers containing alternate concentrations of sodium-L-lactate (e.g. 20 mM, 80 mM, 120 mM and 160 mM) were based on the same non-lactate control. Estimated pyruvate polarization levels were 25+/-2%. Hyperpolarized solutions of 40 mM [1-13C]lactate were prepared following lyophilization of 20% [1-13C]sodium lactate (Cambridge Isotope Laboratories, Inc; Andover, MA) to generate a 40% solution. To achieve a precise 40% preparation, distilled water was added following lyophilization to slightly more than 40%. The final net weight of the concentrated sodium lactate solution was half that of the original commercially available solution. An equal weight of glycerol was added to the concentrated sodium lactate solution and OX063 was added to achieve a final trityl concentration of 15 mM. Just prior to freezing and polarization, 1:10 (v/v) of 10 mM stock Dotarem® solution was added to provide ~1 mM gadolinium complex to the polarization mix. Dissolution of the hyperpolarized sodium-L- [1-13C] lactate was accomplished using a heated and pressurized buffer of 40 mM TRIS/2.7 mM EDTA/80 mM NaCl (control), or 40 mM TRIS/2.7 mM EDTA/80 mM sodium pyruvate. The hyperpolarized sodium-L- [1-13C] lactate formulation yielded a polarization of 20 +/-2%. The total dose per injection for all experiments was approximately 10 μL/g(body weight), but limited to 3.2 mL total for the larger rats. Injection rate was 0.25 mL/s. All experiments were performed on a 3T Signa™ (GE Healthcare, Waukesha, WI). A custom-built dual-tuned (1H/13C) quadrature rodent coil (inner diameter: 80 mm), operating at 127.7 MHz and 32.1 MHz, respectively, was used for both RF excitation and signal reception. Using 5D spCSI (9), a 3D volume was sampled with 36 5.6-deg excitations every 5 s for a total of 90 s. Spatial resolution was 5 mm isotropic with a fov=80×80×60. The first sample was started at 5 s after start of tail vein injection. Signal-to-noise ratio (SNR) was determined from three ROIs, one with a large vascular component, one from kidney, and when available, one from liver. Signal measurements were determined by time weighted averaging using the dynamic [1-13C]lactate curves as weighting factors. Noise was estimated using late time points in the dynamic curve. Apparent rate constants for the conversion of [1-13C]pyruvate to [1-13C]lactate (Kpl) and for the conversion of [1-13C]lactate to [1-13C]pyruvate (Klp) were determined by fitting the RF-corrected dynamic data using single build-up (apparent K) and decay (apparent T1) constants as previously described(10). Data are reported for fits that yielded a reduced chi squared of less than 1.5.
Protocol
For each animal, all experiments were done in a single imaging session. All studies included a control 80 mM [1-13C]pyruvate/no lactate injection. The primary comparison was made using 80 mM [1-13C]pyruvate/ 40 mM sodium-L-lactate injected more than 1.5 hours after the control into each animal (n=9). As part of the range finding, three animals (H199, H322 and H326) were injected with a lower concentration of unlabeled lactate (80 mM [1-13C]pyruvate/ 20 mM sodium-L-lactate) and three studies (H199, H201 and H205) included higher concentration of unlabeled lactate. Finally, four animals (H245, H254, H322 and H326) were used to directly compare a bolus of 40 mM [1-13C]lactate containing 80 mM unlabeled sodium pyruvate, with 80 mM [1-13C]pyruvate containing 40 mM unlabeled lactate. Biochemically, these two solutions are essentially identical, differing only in the exchange partner containing the hyperpolarized 13C-label.
Results
The three ROIs used in this study are illustrated in Figure 1. The addition of unlabeled sodium lactate in the dissolution buffer resulted in significantly increased [1-13C]lactate signal following [1-13C]pyruvate injection in all examined tissue ROIs. Figure 2 compares the [1-13C]lactate response, with and without the addition of unlabeled lactate to the dissolution buffer. Data are represented as contiguous slices with time-averaged [1-13C]lactate color maps overlaid on corresponding grey-scale proton localizers. Figure 3 demonstrates this comparison as time-resolved intensity plots, for a vascular ROI, for kidney and for liver. The full set of [1-13C]lactate SNR data for the 11 rat (34 injection) survey is provided in Table 1. For the injection of hyperpolarized 80 mM [1-13C]pyruvate, the inclusion of 40 mM unlabeled sodium lactate in the dissolution buffer increased the [1-13C]lactate SNR in a vascular region of interest by 29%-109% (average 52%; p = 0.000006 paired t test n=9). In kidney, the [1-13C]lactate SNR increased from 49% - 139% (average 87%; p = 0.00003 paired t test n = 9) and in liver, the increase observed ranged from 0% - 84% (average 37%; p = 0.005 paired t test n = 7). It is interesting that in two of the rats (H322 and H326), there was no detectable gain in 13C isotope exchange with addition of unlabeled lactate in liver. For subjects H201 and H205, both 80 mM [1-13C]pyruvate studies, the [1-13C]lactate SNR appears to increase only slightly at unlabeled lactate levels in excess of 80 mM, with a maximum at 120 mM.
Figure 1.

Regions of interest are indicated on the grey scale proton anatomical images for subject H161 (top). Regions were selected based on both anatomical and metabolic images. Color scale [1-13C]pyruvate images displayed over grey scale anatomical images are provided for reference (bottom)
Figure 2.

Scaled comparison of [1-13C]lactate from time-resolved 3DspCSI images of normal rat with and without 40 mM unlabeled sodium lactate in the dissolution buffer. The dynamic time points have been averaged using kidney signal as a weighting factor.
Figure 3.
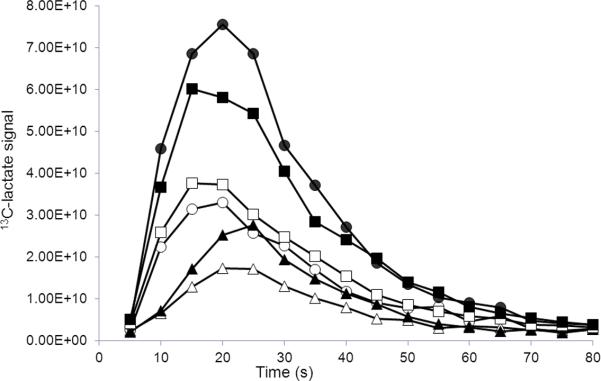
Comparison of time-resolved [1-13C]lactate signals from liver (triangles), kidney (circles) and vascular (squares) regions of interest collected following injection of 80 mM [1-13C]pyruvate with (black filled) and without (open) 40 mM sodium lactate added to the dissolution buffer.
Table 1.
[1-13C]Product SNR
| 80 mM 13C Pyruvate: 0 mM12C Lactate | 80 mM 13C Pyruvate: 20 mM12C Lactate | 80 mM 13C Pyruvate: 40 mM12C Lactate | 80 mM 13C Pyruvate: 80 mM12C Lactate | 80 mM 13C Pyruvate: 120 mM12C Lactate | 80 mM 13C Pyruvate: 160 mM12C Lactate | 40 mM 13C Lactate: 80 mM12C Pyruvate | |
|---|---|---|---|---|---|---|---|
| H161 Vascular | 32 | 67 | |||||
| H175 Vascular | 53 | 74 | |||||
| H176 Vascular | 45 | 73 | |||||
| H191 Vascular | 40 | 64 | |||||
| H199 Vascular | 39 | 48 | 51 | 52 | |||
| H201 Vascular | 47 | 105 | 111 | 108 | |||
| H205 Vascular | 52 | 103 | 122 | 83 | |||
| H245 Vascular | 58 | 88 | 38 | ||||
| H254 Vascular | 39 | 56 | 27 | ||||
| H322 Vascular | 48 | 53 | 68 | 39 | |||
| H326 Vascular | 68 | 86 | 105 | 16 | |||
| Average | 47.4 | 71.9 | 86.7 | 116.3 | 95.6 | 29.9 | |
| Stdev | 10.2 | 16.4 | 11.0 | ||||
| H161 Kidney | 38 | 64 | |||||
| H175 Kidney | 37 | 89 | |||||
| H176 Kidney | 48 | 86 | |||||
| H191 Kidney | 34 | 80 | |||||
| H199 Kidney | 25 | 34 | 52 | 65 | |||
| H201 Kidney | 29 | 102 | 122 | 102 | |||
| H205 Kidney | 65 | 170 | 201 | 165 | |||
| H245 Kidney | 76 | 148 | 37 | ||||
| H254 Kidney | 59 | 88 | 54 | ||||
| H322 Kidney | 37 | 50 | 64 | 34 | |||
| H326 Kidney | 61 | 84 | 111 | 45 | |||
| Average | 46.3 | 86.7 | 112.1 | 161.4 | 133.7 | 42.3 | |
| Stdev | 16.6 | 28.8 | 8.9 | ||||
| H161 Liver | 22 | 41 | |||||
| H175 Liver | 28 | 45 | |||||
| H176 Liver | 23 | 35 | |||||
| H191 Liver | 18 | 27 | |||||
| H199 Liver | 18 | 19 | 24 | 28 | |||
| H201 Liver | 18 | 19 | 19 | 18 | |||
| H205 Liver | 35 | 47 | 63 | 30 | |||
| H322 Liver | 29 | 24 | 27 | ||||
| H326 Liver | 24 | 31 | 28 | ||||
| Average | 23.9 | 32.5 | 31.4 | 40.6 | 24.3 | ||
| Stdev | 5.9 | 8.0 |
Table 2 provides a comparison of the data in terms of apparent rate constant. The apparent vascular rate constant, Kpl (s-1) increased from an average of 0.004 +/- 0.001 to an average of 0.006 +/- 0.003 (n=7) with the addition of 40 mM unlabeled sodium lactate in the dissolution buffer. In kidney Kpl doubled from an average of 0.013 +/- 0.002 to an average of 0.026 +/- 0.004. Liver had a modest increase of Kpl from 0.040 +/- 0.015 up to 0.051 +/- 0.019. A slight increase in Kpl was observed at higher concentrations of unlabeled sodium lactate for vascular and kidney ROI's, but the fit was not of sufficient quality to determine Kpl in liver . In kidney, Kpl appears to increase linearly with unlabeled lactate from 20 mM to 80 mM (n=3, H199, H322 and H326). This is also reflected in the [1-13C]lactate SNR for these kidney ROI's as illustrated in Figure 4. The presence of unlabeled lactate in the bolus did not appreciably change the pyruvate or alanine signal levels in any of the [1-13C]pyruvate metabolic images. In a control experiment in two rats (H245 and H254; data not shown), the injection of hyperpolarized [1-13C]lactate showed good distribution to the organs of interest, but [1-13C]pyruvate was below detection. Significant [1-13C]pyruvate production was only seen when unlabeled pyruvate was added to the buffer. In the four experiments (H245, H254, H322 and H326) where the 40 mM [1-13C]lactate was injected with 80 mM unlabeled pyruvate in the dissolution buffer, the apparent reverse rate constant Klp in the vascular ROI was 0.005 +/- 0.002 and in kidney it was 0.016 +/- 0.002 s-1. Insufficient labeled pyruvate in liver prevented a reliable fit in this ROI. .
Table 2.
Apparent rate constants
| 80 mM 13C Pyruvate: 0 mM12C Lactate | 80 mM 13C Pyruvate: 20 mM12C Lactate | 80 mM 13C Pyruvate: 40 mM12C Lactate | 80 mM 13C Pyruvate: 80 mM12C Lactate | 80 mM 13C Pyruvate: 120 mM12C Lactate | 80 mM 13C Pyruvate: 160 mM12C Lactate | 40 mM 13C Lactate: 80 mM12C Pyruvate | |
|---|---|---|---|---|---|---|---|
| H161 Vascular | 0.003 | 0.007 | |||||
| H175 Vascular | 0.006 | 0.009 | |||||
| H176 Vascular | 0.004 | 0.004 | |||||
| H191 Vascular | 0.004 | 0.006 | |||||
| H199 Vascular | 0.005 | 0.005 | 0.005 | 0.005 | |||
| H201 Vascular | 0.004 | 0.007 | 0.008 | 0.007 | |||
| H205 Vascular | 0.003 | 0.004 | 0.005 | 0.004 | |||
| H245 Vascular | 0.006 | 0.012 | 0.006 | ||||
| H254 Vascular | 0.004 | 0.004 | 0.006 | ||||
| H322 Vascular | 0.004 | 0.005 | 0.005 | 0.006 | |||
| H326 Vascular | 0.003 | 0.004 | 0.004 | 0.003 | |||
| Average | 0.004 | 0.006 | 0.005 | 0.007 | 0.006 | 0.005 | |
| Stdev | 0.001 | 0.003 | 0.002 | ||||
| H161 Kidney | 0.012 | 0.026 | |||||
| H175 Kidney | 0.013 | 0.028 | |||||
| H176 Kidney | 0.013 | 0.022 | |||||
| H191 Kidney | 0.014 | 0.030 | |||||
| H199 Kidney | 0.011 | 0.016 | 0.021 | 0.026 | |||
| H201 Kidney | 0.012 | 0.038 | 0.047 | 0.047 | |||
| H205 Kidney | 0.017 | 0.035 | 0.038 | 0.045 | |||
| H245 Kidney | 0.016 | 0.032 | 0.016 | ||||
| H254 Kidney | 0.013 | 0.023 | 0.018 | ||||
| H322 Kidney | 0.013 | 0.017 | 0.024 | 0.017 | |||
| H326 Kidney | 0.013 | 0.018 | 0.026 | 0.013 | |||
| Average | 0.013 | 0.026 | 0.033 | 0.043 | 0.046 | 0.016 | |
| Stdev | 0.002 | 0.004 | 0.002 | ||||
| H161 Liver | 0.032 | 0.057 | |||||
| H175 Liver | 0.070 | 0.078 | |||||
| H176 Liver | 0.055 | 0.065 | |||||
| H191 Liver | 0.032 | 0.048 | |||||
| H199 Liver | 0.028 | 0.040 | 0.044 | 0.048 | |||
| H201 Liver | 0.036 | NA | NA | NA | |||
| H205 Liver | 0.041 | NA | NA | NA | |||
| H322 Liver | 0.041 | 0.042 | 0.042 | NA | |||
| H326 Liver | 0.022 | 0.020 | 0.020 | NA | |||
| Average | 0.040 | 0.051 | |||||
| Stdev | 0.015 | 0.019 |
Figure 4.

SNR of [1-13C]lactate from kidney ROI vs concentration of unlabeled sodium lactate in dissolution buffer of injected [1-13C]pyruvate in rats H199, H322 and H326. Linear trend lines are indicated. Under these conditions, the x = 0 intercept is related to the amount of lactate exchange and flux generated 13C labeling at steady state.
As illustrated in Figure 4, [1-13C]lactate signal increases linearly with the concentration of unlabeled sodium lactate added to the dissolution buffer of injected [1-13C]pyruvate. Thus, the increase in [1-13C]lactate due to the exchange aided by the addition of 40 mM unlabeled lactate in the dissolution buffer, should equal the [1-13C]pyruvate generated by the injection of 40 mM hyperpolarized [1-13C]lactate containing 80 mM unlabeled pyruvate in the dissolution buffer. This is illustrated in Figure 5, where the 13Cpyr/lac and 13Clac/pyr injections are normalized to one another by the ratio of the total carbon signals observed following each injection.
Figure 5.
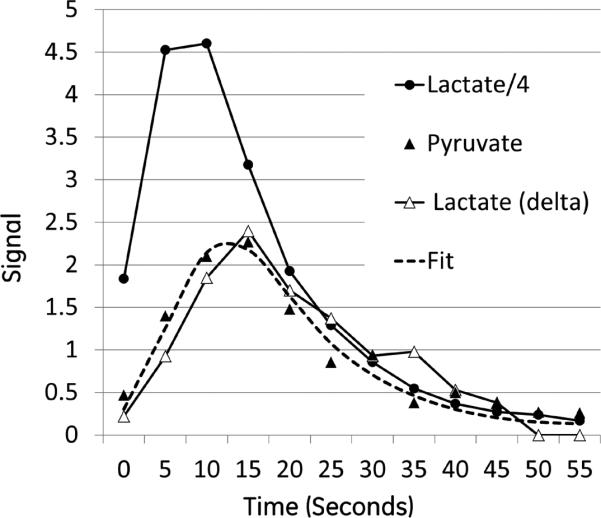
Time-resolved response from kidney ROI in rat H254 following injection of hyperpolarized 40 mM [1-13C]lactate containing 80 mM of unlabeled sodium pyruvate in the dissolution buffer. Black filled circles represent the signal from the [1-13C]lactate bolus/4. Black filled triangles represents the [1-13C]pyruvate produced. The dashed line is a fit to the lactate-pyruvate exchange with an apparent klp = 0.018 s-1. The open triangles are the [1-13C]lactate signal difference from two additional injections in which the hyperpolarized substrate was 80 mM [1-13C]pyruvate with and without 40 mM unlabeled lactate in the dissolution buffer. This difference signal was multiplied by the ratio of the total carbon signal observed following the [1-13C]lactate injection over the total carbon signal observed following the final [1-13C]pyruvate injection.
Discussion
The results presented here demonstrate a general increase in the conversion of hyperpolarized [1-13C]pyruvate to hyperpolarized [1-13C]lactate when unlabeled sodium lactate is added to the dissolution buffer, at least under the dose and tissue conditions surveyed. This result supports the importance of isotopic exchange in vivo and the link between NADH availability and saturation. Although it is possible that the effect is primarily in blood, with increased [1-13C]lactate being generated in blood or elsewhere, and carried into the tissue of interest, the larger effect in kidney (Fig. 3) provides some evidence otherwise. It is also interesting to note that the shape and timing of the [1-13C]lactate dynamics do not change appreciably with and without addition of unlabeled lactate, adding some support to this conclusion. There appears to be some variability in the size of the effect, which may reflect differences in the initial availability of [NADH] from steady-state lactate (exchange) and other oxidative processes (flux). This is especially true in the liver ROI at these typical preclinical doses, where, in two cases, no added isotope exchange was observed (H322 and H326). This method is valuable as a test for lactate pool size limits in vivo. The presence or absence of a lactate pool size limit is important information for any combination of dose, anatomy and physiological condition to be explored quantitatively. Although the primary comparison was between 80 mM [1-13C]pyruvate with no added lactate and 80 mM [1-13C]pyruvate with 40 mM lactate, a limited number of studies compared higher levels of unlabeled lactate versus control. However, these data did not provide any evidence of increased isotope exchange at those higher levels. This is confounded by limited numbers, differences in osmolarity, and potentially an increased impact of monocarboxylic acid transport (MCT) to the overall rate limit at higher lactate concentrations (5). The use of this method to measure 13C isotope exchange from [1-13C]lactate to pyruvate is also an important tool, which unlike [1-13C]pyruvate injections, may provide a measure of exchange without the background of a large steady state pyruvate pool. Further, this rate should be approximately equal to a rate determined from the increase in exchange due to the addition of 40 mM unlabeled lactate in the second [1-13C]pyruvate injection. Since the added unlabeled lactate [lacΔ] in the second [1-13C]pyruvate injection is equal to the lactate concentration in the hyperpolarized [1-13C]lactate [lac] injection, KplΔ [lacΔ] should be approximately Klp[lac] = Kexchange under these conditions. Unlike the Kpl values listed in Table 2, which are rate constants for the conversion of [1-13C]pyruvate to [1-13C]lactate relative to the [1-13C]pyruvate bolus, KplΔ is the rate constant for the conversion of [1-13C]pyruvate to [1-13C]lactate relative to the unlabeled sodium lactate added to the bolus. Since the sodium lactate is not labeled and therefore not observed in this experiment, the measurement of Kexchange via KplΔ takes advantage of the separate, but matched, bolus injection, with [1-13C]lactate as the labeled substrate. This appears to be consistent with the measurement of KplΔ in kidney (0.018 +/- 0.002).
Conclusions
A method is introduced, exchange-linked dissolution agents (ELDA), which can be used to measure pool size limits and exchange rates in hyperpolarized [1-13C]pyruvate metabolic imaging. Consistent with studies on cell suspensions (2,5), these in vivo results suggest that lactate pool size and thus [NADH] availability can limit the [1-13C]lactate signal level in hyperpolarized [1-13C]pyruvate metabolic imaging. The method introduced provides a simple way to check for the pool size limits under the experimental conditions of any study that hopes to interpret changes in lactate signal level or rate constant. In addition, we show that the addition of unlabeled pyruvate to an injection of hyperpolarized [1-13C]lactate can be used to measure exchange rate in the reverse direction.
Acknowledgments
Funded by:
NIH EB015891, AA018681, AA05965, AA13521-INIA, EB009070
Abbreviations
- DNP
Dynamic Nuclear Polarization
- EDTA
Ethylene diamine tetraacetic acid
- ELDA
Exchange linked dissolution agent
- NaOH
Sodium Hydroxide
References
- 1.Albers MJ, Bok R, Chen AP, Cunningham CH, Zierhut ML, Zhang VY, Kohler SJ, Tropp J, Hurd RE, Yen YF, Nelson SJ, Vigneron DB, Kurhanewicz J. Hyperpolarized 13C lactate, pyruvate, and alanine: noninvasive biomarkers for prostate cancer detection and grading. Cancer Res. 2008;68(20):8607–8615. doi: 10.1158/0008-5472.CAN-08-0749. [DOI] [PMC free article] [PubMed] [Google Scholar]
- 2.Day SE, Kettunen MI, Gallagher FA, Hu DE, Lerche M, Wolber J, Golman K, Ardenkjaer-Larsen JH, Brindle KM. Detecting tumor response to treatment using hyperpolarized 13C magnetic resonance imaging and spectroscopy. Nat Med. 2007;13(11):1382–1387. doi: 10.1038/nm1650. [DOI] [PubMed] [Google Scholar]
- 3.Zierhut ML, Yen YF, Chen AP, Bok R, Albers MJ, Zhang V, Tropp J, Park I, Vigneron DB, Kurhanewicz J, Hurd RE, Nelson SJ. Kinetic modeling of hyperpolarized 13C1-pyruvate metabolism in normal rats and TRAMP mice. J Magn Reson. 2010;202(1):85–92. doi: 10.1016/j.jmr.2009.10.003. [DOI] [PMC free article] [PubMed] [Google Scholar]
- 4.Xu T, Mayer D, Gu M, Yen YF, Josan S, Tropp J, Pfefferbaum A, Hurd R, Spielman D. Quantification of in vivo metabolic kinetics of hyperpolarized pyruvate in rat kidneys using dynamic (13) C MRSI. NMR Biomed. 2011;24(8):997–1005. doi: 10.1002/nbm.1719. [DOI] [PMC free article] [PubMed] [Google Scholar]
- 5.Witney TH, Kettunen MI, Brindle KM. Kinetic modeling of hyperpolarized 13C label exchange between pyruvate and lactate in tumor cells. J Biol Chem. 2011;286(28):24572–24580. doi: 10.1074/jbc.M111.237727. [DOI] [PMC free article] [PubMed] [Google Scholar]
- 6.Romijn JA, Chinkes DL, Schwarz JM, Wolfe RR. Lactate-pyruvate interconversion in blood: implications for in vivo tracer studies. Am J Physiol. 1994;266(3 Pt 1):E334–340. doi: 10.1152/ajpendo.1994.266.3.E334. [DOI] [PubMed] [Google Scholar]
- 7.Kettunen MI, Hu DE, Witney TH, McLaughlin R, Gallagher FA, Bohndiek SE, Day SE, Brindle KM. Magnetization transfer measurements of exchange between hyperpolarized [1-13C]pyruvate and [1-13C]lactate in a murine lymphoma. Magn Reson Med. 2010;63(4):872–880. doi: 10.1002/mrm.22276. [DOI] [PubMed] [Google Scholar]
- 8.Spielman DM, Mayer D, Yen YF, Tropp J, Hurd RE, Pfefferbaum A. In vivo measurement of ethanol metabolism in the rat liver using magnetic resonance spectroscopy of hyperpolarized [1-13C]pyruvate. Magn Reson Med. 2009;62(2):307–313. doi: 10.1002/mrm.21998. [DOI] [PMC free article] [PubMed] [Google Scholar]
- 9.Mayer D, Yen YF, Tropp J, Pfefferbaum A, Hurd RE, Spielman DM. Application of subsecond spiral chemical shift imaging to real-time multislice metabolic imaging of the rat in vivo after injection of hyperpolarized 13C1-pyruvate. Magn Reson Med. 2009;62(3):557–564. doi: 10.1002/mrm.22041. [DOI] [PMC free article] [PubMed] [Google Scholar]
- 10.Josan S, Hurd RE, Kerr AB, Yen Y-F, Larson PE, Pfefferbaum A, Spielman D,, MD . Proceedings of the ISMRM. Montreal, Canada: 2011. Effects of RF excitation scheme on signal-to-noise-ratio and apparent rate constant estimation in dynamic volumetric imaging of hyperpolarized [1-13C]pyruvate. p. 3528. [Google Scholar]