

Abstract
The influenza viral membrane protein hemagglutinin (HA) is required at high concentrations on virion and host-cell membranes for infectivity. Because the role of actin in membrane organization is not completely understood, we quantified the relationship between HA and host-cell actin at the nanoscale. Results obtained using superresolution fluorescence photoactivation localization microscopy (FPALM) in nonpolarized cells show that HA clusters colocalize with actin-rich membrane regions (ARMRs). Individual molecular trajectories in live cells indicate restricted HA mobility in ARMRs, and actin disruption caused specific changes to HA clustering. Surprisingly, the actin-binding protein cofilin was excluded from some regions within several hundred nanometers of HA clusters, suggesting that HA clusters or adjacent proteins within the same clusters influence local actin structure. Thus, with the use of imaging, we demonstrate a dynamic relationship between glycoprotein membrane organization and the actin cytoskeleton at the nanoscale.
Introduction
Cell plasma membranes are widely understood to be laterally heterogeneous, and membrane-associated proteins can be distributed in complexes and aggregations that span a range of length scales (1,2). In one cell, a single species of protein can have one subset undergoing Brownian diffusion whereas other subsets undergo confined or anomalous diffusion (3). Indeed, early evidence from various methods suggested that the lateral mobility of proteins in cell membranes could be restrained by forces beyond those of the viscosity of the membrane itself, such as those exerted by the actin cytoskeleton (4,5), and such restraints may help to form or maintain protein clusters by corralling the proteins together between barriers.
The idea that the cytoskeleton can organize protein clusters or membrane domains by acting as a physical structure that confines the diffusion of membrane-bound proteins and lipids is long-standing (6,7), and many studies have emphasized the importance of the cytoskeleton in membrane organization (8–12). Investigators have proposed different mechanisms for the role of actin. Transmembrane (TM) proteins bound to the underlying actin cytoskeleton may act as obstacles that restrict the lateral diffusion of other proteins in the bilayer (6), clustering of membrane proteins may be promoted by local enrichment of cortical actin filaments (13), or the actin filaments themselves may act as barriers to lateral diffusion (14). Additionally, the actin cytoskeleton can interact with the plasma membrane through actin-binding proteins (ABPs) such as spectrin, filamin, and ezrin, and such interactions have also been hypothesized to aid in the organization of membrane proteins (15,16). Discriminating among the diverse range of models that have been proposed to explain how actin can alter the diffusion and cell-surface distribution of membrane-bound proteins has proved to be challenging. Although we have gained a considerable understanding of membrane organization with the use of techniques such as Förster resonance energy transfer (FRET (8)), single-particle tracking (SPT (17)), and fluorescence recovery after photobleaching (FRAP (18)), the submicron length scale and dynamic nature of whole native membrane domains in living cells make these domains unsuitable for imaging by either conventional light microscopy or electron microscopy. This technical impasse has resulted in a strong need for information about the size range, composition, and dynamic properties of protein clusters in unperturbed cells. Moreover, the precise spatial and dynamic relationships between actin and membrane proteins at relevant scales have remained elusive.
To investigate membrane organization and its role in viral infection, we studied hemagglutinin (HA), the TM viral fusion protein from influenza (19), expressed in NIH3T3-HAb2 fibroblast cells. The local concentration of HA on the surface of virions is crucial for influenza entry via membrane fusion (20), and HA concentration on host-cell membranes is crucial for release of bud particles from infected cells (21). Both of these processes are promoted by clustering of HA at the host-cell membrane and depend on membrane organization at the nanoscale (22). Intriguingly, influenza viruses analyzed by mass spectrometry were found to contain β-actin and a number of actin-associated proteins, including cofilin, several annexins, tropomyosins, and profilin (23). Although colocalization between HA and actin on coarse spatial scales has been observed (24), direct binding between HA and actin or ABPs (in the absence of other viral components) has not yet been reported. Rather, HA may influence actin organization through signaling pathways. For example, the host-cell surface accumulation of HA and its clustering is required for influenza infection because membrane accumulation of HA triggers activation of the Raf/ERK/MEK cascade via protein kinase C α (PKCα) activation and induces export of the viral ribonucleoprotein from the host-cell nucleus (25).
Our goal in this work was to elucidate the role of the actin cytoskeleton in cell membrane organization, using HA as a canonical membrane-associated protein that is known to organize into nanoscopic and larger scale domains (26,27). In particular, we focused on the question of how actin mediates HA dynamics and clustering at the nanoscale, using the superresolution method fluorescence photoactivation localization microscopy (FPALM) (28). Our results reveal how actin distribution and the perturbation of the actin cytoskeletal network affect the membrane organization of this critical viral component—information that can be used to develop new antiviral therapies. Surprisingly, the ABP cofilin was excluded from regions within several hundred nanometers of HA clusters, suggesting that HA or adjacent proteins in the same clusters influence local actin structure. We propose a feedback mechanism that couples the clustering of HA at the cell surface to the distribution of ABPs adjacent to those clusters. This concept can serve as a general model for cross talk between membrane-associated proteins and the underlying cortical actin cytoskeleton.
Materials and Methods
For more details regarding the materials and methods used in this work, see the Supporting Material.
Constructs
pDendra2-HA (29) and pPAmCherry-β-actin (30) (hereafter referred to as Dendra2-HA and PAmCherry-actin, respectively) were based on the pEGFP-N1 vector (Clontech, Mountain View, CA) and are described in detail elsewhere. The coding DNA of the hemagglutinin gene of the A/X-31B (Puerto Rico/8/1934-Aichi/2/1968) (H3N2)strain of influenza virus was used in the pDendra2-HA plasmid. pPAmCherry-cofilin (hereafter referred to as PAmCherry-cofilin) was made by cloning human (nonmuscle) cofilin 1 (NCBI accession number: NM_005507.2) between BamHI-AgeI sites of the pEGFP-pPAmCherry vector. This vector is the same as that used for pPAmCherry-β-actin, with pEGFP replaced by pPAmCherry in pEGFP-N1 (Clontech).
Cell culture
NIH3T3-HAb2 fibroblast cells (NIH3T3 cells that stably overexpress the hemagglutinin gene of the A/Japan/305/57 H2N2 strain of human influenza virus (20,31)) were maintained in growth media (Dulbecco’s modified Eagle’s medium) supplemented with 10% calf bovine serum (ATCC, Manassas, VA) and antibiotics (100 U/mL penicillin and 100 μg/mL streptomycin; Gibco/Invitrogen, Carlsbad, CA), and cultured at 37°C in 5% CO2.
Superresolution imaging
Cells were transfected using Lipofectamine 2000 (Life Technologies, Invitrogen) and constructs for fluorescent protein-tagged proteins of interest, plated in eight-well coverglass chambers (Nalge Nunc), and imaged according to established procedures (32). Imaged molecules were localized according to established procedures, and the determined coordinates for molecules that met thresholds for quality of fit and localization precision were further analyzed for clustering.
Nearest-neighbor-based cluster analysis
After identification and position averaging of molecules visible for more than one consecutive frame, fixed-cell data sets on HA comprised 23,120,711 localized molecules in NIH3T3-HAb2 cells. Clusters were identified by single-linkage cluster analysis (SLCA) (33). All molecules within a given distance dc of one another were assigned to the same cluster. Using dc = 30 nm, roughly equal to the position uncertainty for the majority of molecules, individual clusters could be identified from a set of coordinates. Similar results were obtained using dc = 40 nm.
Cluster morphological properties
Given the coordinates of molecules determined to lie within the same cluster, the area and density (number of particles per unit area) were then determined for each cluster. The area was measured from the shape formed by stamping a circle of radius dc around each molecule in the cluster and taking the area of that continuous shape. The density was calculated as the number of molecules per square micron of area in the cluster.
Actin cytoskeleton disruption and staining
NIH3T3-HAb2 cells were incubated with full growth media supplemented with 1 μM Latrunculin A (LatA) for 10 min, 1 μM Cytochalasin D (CytoD) for 60 min, 1 μM jasplakinolide (Jas) for 30 min, or 0.01% dimethyl sulfoxide (DMSO; control) for 60 min. Subsequently, the cells were rinsed three times with UV-bleached phosphate-buffered saline (PBS) and fixed in 4% paraformaldehyde in PBS at room temperature (RT) for 20 min before being rinsed a further three times and imaged in UV-bleached PBS. To visualize F-actin, Alexa 488 phalloidin (Life Technologies, Invitrogen) diluted 1:200 in PBS with 0.5% bovine serum albumin was added to the cells for 20 min at RT.
Confocal microscopy
An Olympus Fluoview FV1000 microscope was used to image Alexa 488 phalloidin at RT in the confocal mode. Images were obtained using either a 60×/1.2 NA water or a 60×/1.42 NA oil immersion objective with 488 nm excitation and 505–525 nm detection.
SLCA
Molecular positions were analyzed to determine clustering. As described previously (33,34), the positions of molecules that were within a maximum distance of 30 nm were defined as being within the same cluster. Using an iterative approach, we first identified all molecules within 30 nm of a given molecule and then added those to a list, searched all new molecules added to the list for neighbors within 30 nm, and repeated the process until all members of that cluster had been obtained. For more details, please see the Supporting Material.
Results
HA colocalizes with actin at the nanoscale in both fixed and live cells at 37°C
For colocalization studies, we used Dendra2-HA and PAmCherry-actin plasmids transiently transfected into nonpolarized NIH3T3-HAb2 mouse fibroblast cells (20). We previously showed that PAmCherry-actin labels the same filamentous actin structures as phalloidin in NIH3T3-HAb2 cells (32). In this study, two-color FPALM revealed irregular clusters of HA and actin distributions in both fixed and live NIH3T3-HAb2 cells (Fig. 1) within ±0.5 μm (the effective focal depth of this FPALM imaging) of bottom plasma membranes. Although Fig. 1 shows a striking example of elongated HA clusters, we observed considerable variability in cluster morphology from cell to cell and within cells, with most cells showing both elongated and more compact (i.e., globular) HA clusters, consistent with previously published work (26,27). Clusters of HA were often spatially colocalized with clusters of actin. Pair correlation analysis with bleed-through correction revealed a strong correlation between HA and actin in live NIH3T3-HAb2 cells (Fig. 1 G; n = 10 cells) on length scales of ∼50 nm to >1 μm. The accumulation of actin and HA together at the bottom membrane raises the possibility that the clustering observed here represents projections of unclustered proteins distributed in convoluted membranes. However, evidence provided by electron microscopy imaging of NIH3T3-HAb2 membranes (27) indicates that the degree of membrane convolution in these cells is not sufficient to result in the clustering on the scales of hundreds of nanometers to micrometers we observed here with FPALM. We next imaged HA membrane domains and actin in fixed and live cells, and examined the timescale of their persistence in live cells. Through FPALM time-lapse imaging (Fig. 2, B and C), we were able to observe the persistence of HA clusters in living NIH3T3-HAb2 cells over many tens of seconds. To test whether the actin cytoskeleton was influencing local HA mobility, we measured the trajectories of individual HA molecules and compared them in regions of different actin densities.
Figure 1.
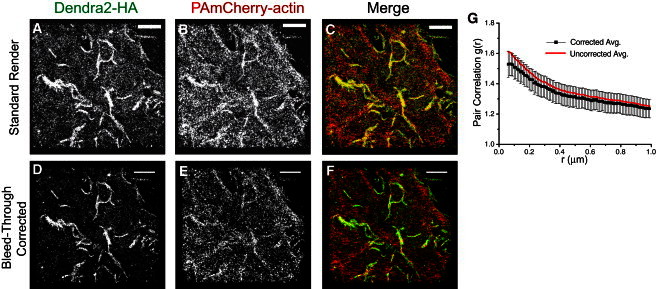
Two-color, live-cell FPALM imaging reveals a correlation between HA and actin in nonpolarized NIH3T3-HAb2 cells. (A–C) Clusters of Dendra2-HA (A, green channel) colocalize with PAmCherry-actin (B, red channel), shown merged in C. (D–F) Bleed-through corrected versions of panels A–C. (G) The pair correlation g(r) between HA and actin is significant (amplitude of one is random) with (black points) or without (red points) bleed-through correction. Data shown are the average of n = 10 live cells, mean ± SE. Scale bar = 2 μm.
Figure 2.
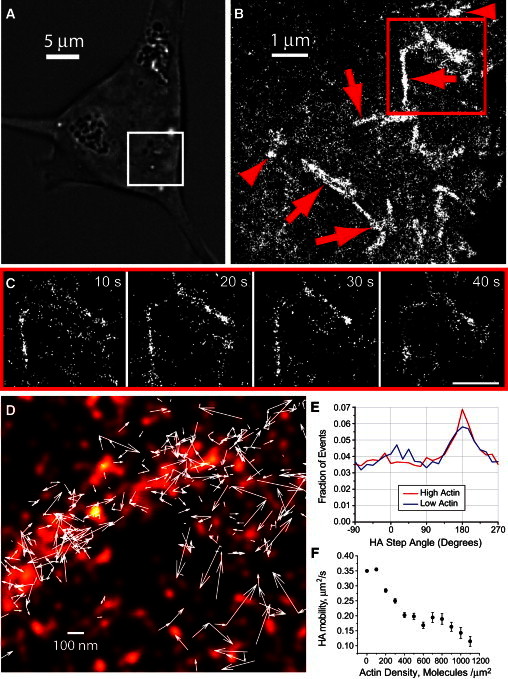
HA mobility differs according to the surrounding actin density. (A) Transmitted light image of a living NIH3T3-HAb2 cell. The area enclosed by the white box shows the region imaged in B obtained using FPALM. (B) Time-integrated (∼217 s) FPALM image of Dendra2-HA (43,180 molecules) shows both linear (red arrows) and globular (red arrowheads) HA clusters. (C) Consecutive FPALM renderings in ∼10 s intervals of the boxed region in B show persistent linear clusters as a function of time. Scale bar = 1 μm. (D–F) The dynamics of Dendra2-HA correlates with actin density. (D) Superimposed two-color (Dendra2-HA and PAmCherry-actin) live-cell FPALM image of PAmCherry-actin (red pseudocolor) and 377 trajectories of Dendra2-HA molecules (white arrows) in a living NIH3T3-HAb2 fibroblast at 37°C. (E) Histogram of HA turn angles (the angle of a given step measured relative to the previous step) for 26,669 molecules (trajectories) in n = 19 untreated cells in regions with below-median local actin density (blue line) and above-median actin density (red line). Trajectories were acquired at 31.75 ms/frame and lasted up to ∼20 frames. (F) HA mobility (as measured by MSD per second) decreases with increasing actin density, suggesting that HA motion is restricted by actin-associated structures.
HA mobility is dependent on local actin density
We obtained trajectories of individual HA molecules with a time resolution of 16.7 ms by localizing individual Dendra2-HA molecules as a function of time for several frames (ranging from two to 23 steps spanning tens to hundreds of milliseconds). We then analyzed these trajectories by diffusion analysis (see Eqs. 1 and 2 in the Supporting Material) to determine the mean-squared displacement (MSD) per unit time. For Dendra2-HA expressed alone and imaged in NIH3T3-HAb2 cells (n = 29 cells), the histogram of turn angles (defined as the angle between a given step of an individual molecule and the previous step) shows biases for angles 0° ± 45° (i.e., the molecule continues ahead, 25.15% ± 0.07% of all steps) and 180° ± 45° (i.e., the molecule reverses direction, 29.72% ± 0.07%), compared with 90° ± 45° (i.e., right turn, 22.55% ± 0.06%) and −90° ± 45° (left turn, 22.58% ± 0.06%; see Fig. S1).
Next, we compared the trajectories of HA molecules in regions of above- and below-median actin density (see Supporting Material for definitions of each) in NIH3T3-HAb2 cells expressing both Dendra2-HA and PAmCherry-actin. HA molecules in regions of above-median actin density (Fig. 2 E, red line) were significantly less likely to take two consecutive steps in a given direction (within ±37.5° of the original direction; 22.2% ± 0.7% of events) than HA molecules in regions of below-median actin density (24.0% ± 0.7% of events; Fig. 2 E, blue line). Thus, the restriction of HA mobility was correlated with actin density. Furthermore, we measured the MSDs of individual HA molecules and found that, over tens of milliseconds, the step sizes of HA molecules reduced as local actin density increased (Fig. 2 F). We hypothesized that these trends reflected multiple populations of HA, with the confinement of each depending on the surrounding actin density. We therefore quantified the diffusion behavior of labeled HA molecules in live cells.
Two distinct populations of HA revealed by particle image correlation spectroscopy
In live NIH3T3-HAb2 cells, particle image correlation spectroscopy (PICS) analysis (35) of individual Dendra2-HA molecules (Fig. 3) revealed two populations of Dendra2-HA with distinct modes of diffusion. One population undergoes free diffusion (Fig. 3 C) with D = 0.109 ± 0.066 μm2/s (74% ± 7% of molecules) and the other (26% ± 7% of molecules) shows confined diffusion (Fig. 3 D) with D = 0.028 ± 0.018 μm2/s within a region of characteristic confinement size L = 150 ± 56 nm (see Eq. 5 in the Supporting Material for details of the analysis). Note that these results do not preclude the existence of more than two HA populations, but suggest that at least two must be invoked to describe the observed distribution of MSDs of HA as a function of time. The confined population suggests that lateral motion of HA molecules is restricted.
Figure 3.
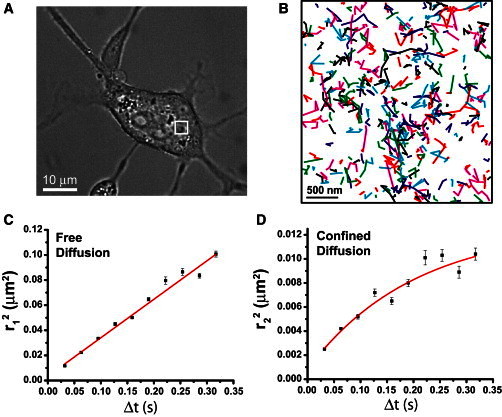
Analysis of trajectories of individual HA molecules by PICS within a living NIH3T3-HAb2 cell at 37°C shows two populations of HA molecules with distinct mobilities. (A) Transmitted light image of a living NIH3T3-HAb2 cell transfected with Dendra2-HA at 37°C. (B) The white box in A shows a region of the plasma membrane imaged by FPALM, in which the trajectories of individual molecules were determined over durations from 16.7 ms to 1.01 s (trajectories were between one and 32 steps at 16.7–31.7 ms per step). The time dependence of the displacements of the HA molecules was analyzed by PICS (35), revealing two distinct populations of HA molecules. (C) The first population (74% ± 7%) had a diffusion coefficient D1 = 0.109 ± 0.066 μm2/s and underwent normal Brownian free diffusion within the uncertainties of the measurement. (D) In contrast, the second population (26% ± 7%) had a significantly lower diffusion coefficient D2 = 0.026 ± 0.018 μm2/s and underwent confined diffusion within a region of size L = 150 ± 56 nm. The relationship in D could not be fit with a straight line.
Actin regulates HA cluster morphology in nonpolarized NIH3T3-HAb2 fibroblast cells: native HA cluster morphology
We next examined the HA-actin relationship at the scale of a cluster, the biological membrane structure that precedes viral assembly and enables sufficient HA densities for infectivity (22). First, we analyzed the positions of 23,120,711 localized Dendra2-HA molecules in fixed NIH3T3-HAb2 cells (Fig. 4) using SLCA (33,36) to quantify the cluster area and density (Table S1). Clusters were defined by a maximum HA-HA radial separation of 30 nm for nearest neighbors within the same cluster. These analyses identified 22,186 clusters of at least 50 localized HA molecules, and 6793 clusters with at least 200 HA molecules (n = 25 cells). Area and density histograms for all HA clusters (not just those with at least 50 molecules) are shown in Figs. S2 and S3. These histograms demonstrate a range of cluster areas from just a few molecules up to nearly 0.2 μm2 and a range of densities from ∼500 HA/μm2 up to nearly 10,000 HA/μm2. As expected from the live-cell data on HA dynamics, elongated and branched clusters of HA were observed in control NIH3T3-HAb2 cells (Figs. 2, A–C, and 4 A) that sometimes showed distinct angular junctions suggestive of a network of linear structures.
Figure 4.
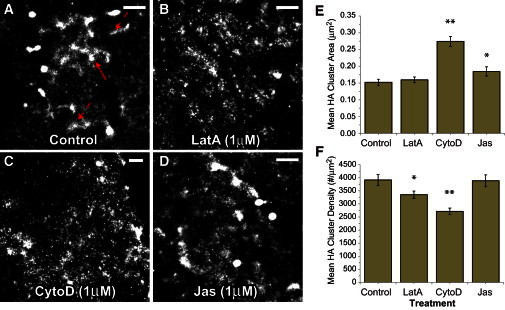
Actin mediates nanoscale HA cluster morphology. (A) Clusters of Dendra2-HA in fixed NIH3T3-HAb2 fibroblasts were imaged by FPALM after incubation with actin-disrupting drugs. HA clusters in control cells (imaged in 0.01% DMSO as vehicle control for actin-disrupting drugs) are either linear (dashed arrows) or globular (solid arrows). (B–D) A range of cluster morphologies is also observed in cells treated with actin disruptors: (B) 1μM Lat A for 10 min, (C) 1 μM CytoD for 60 min, and (D) 1 μM Jas for 30 min. The media for all treatments also contained 0.01% DMSO. Scale bar = 1 μm. (E and F) Treated cells show significant differences compared with controls in terms of (E) mean HA cluster area and (F) cluster density (i.e., number of HA molecules per cluster) measured for at least 149 clusters per treatment type. Statistical significance is indicated by a single asterisk (*p < 0.05) or double asterisk (**p < 0.001) as reported by Student’s t-test comparing control with treatment means. Bars indicate means ± SE. For details on cluster comparisons, see Table S1.
Actin cytoskeletal disrupters cause specific changes to HA cluster density and area
If actin mediates HA clustering, then disruption of actin should alter HA clustering. Because HA mobility was found to be restricted within actin-rich membrane regions (ARMRs), we hypothesized that reducing or increasing the density of actin filaments would alter HA clustering. LatA sequesters actin monomers, thereby inhibiting actin polymerization (37). CytoD selectively binds filament barbed ends and blocks the addition of actin monomers (38). These agents can therefore reduce the total amount of filamentous cellular actin by interrupting actin treadmilling in mechanistically distinct ways. Conversely, Jas binds actin filaments and inhibits actin depolymerization (39), and thus can increase the fraction of filamentous cellular actin. Confocal images of Alexa-488-phalloidin-labeled NIH3T3-HAb2 cells (Fig. S4) treated with actin disrupters confirmed that stress fibers persisted with Jas treatment but were severely reduced in number with LatA or CytoD treatment, as expected. Confocal imaging of Dendra2-HA and Alexa-680-phalloidin confirmed the colocalization of HA with endogenous actin (Fig. S5). We characterized the effects of each of these actin-disrupting drugs on the morphology of HA clusters in Dendra2-HA-transfected NIH3T3-HAb2 cells (Fig. 4). Clusters were analyzed using SLCA (see Materials and Methods, and Supporting Material), which defines a cluster as any HA molecules within 30 nm of each other. SLCA (34,36) and pair correlation (32,40,41) are complementary methods for quantifying the properties of molecular clusters. The pair correlation provides a probability distribution (relative to random) of finding an HA molecule as a function of radial distance from another HA molecule. The density and size information extracted from pair correlation is an average over many molecules in many clusters. SLCA identifies individual clusters based on a maximum NN distance, and therefore can be used to measure the distribution of individual cluster properties (34). To quantify the role of actin on HA cluster area and density, we analyzed clusters of HA in cells treated with 1 μM LatA for 10 min, 1 μM CytoD for 60 min, or 1 μM Jas for 30 min, and compared them with HA clusters in corresponding vehicle (0.01% DMSO)-treated controls. The trends for clusters of ≥200 HA (see Table S1) and ≥50 HA molecules (not shown) were similar. Each actin-disrupting drug had specific effects on areas of HA clusters and the density of HA molecules within them (Fig. 4). LatA treatment resulted in a significant decrease in the mean density of HA within clusters, but no change in mean cluster area. CytoD induced a significant decrease in HA density within clusters and a significant increase in mean cluster area. Jas induced a significant increase in mean cluster area, but did not alter the mean density of HA within clusters (Fig. 4; Table S1).
Together, the results of these actin-disruption experiments indicate that actin can mediate the size and density of clusters of the membrane-associated protein HA. Because the ABP cofilin has been shown to be important in regulating actin structure across various cellular contexts (42–66), we next examined the relationship between HA clustering and cofilin distribution.
Cofilin is excluded from clusters of HA in NIH3T3-HAb2 cells
Two-color FPALM imaging of Dendra2-HA and PAmCherry-cofilin in transfected NIH3T3-HAb2 cells (Fig. 5) revealed that clusters of HA were predominantly surrounded by areas of cofilin exclusion, spanning hundreds of nanometers to micrometers. This exclusion was not absolute, however, and small, dense clusters of HA were sometimes colocalized with cofilin. Images were taken with an effective focal depth of 0.5 μm from the bottom membrane in fixed NIH3T3-HAb2 cells. Aside from areas within a lateral radius of 1–2 μm from HA clusters, cofilin was generally distributed diffusely throughout the cells. Quantification of the pair cross-correlation between HA and cofilin revealed, on the average (n = 14 cells), anticorrelation on length scales of ∼150 nm to >1 μm (Fig. 5 D).
Figure 5.
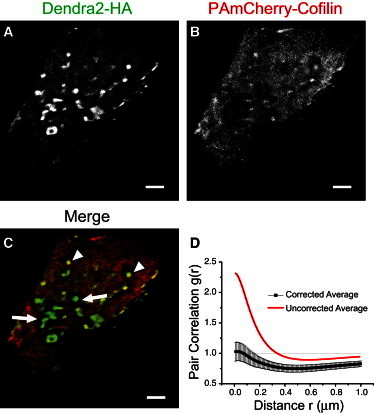
Cofilin is differentially excluded from HA clusters. Clusters of Dendra2-HA and PAmCherry-cofilin were imaged by two-color FPALM in fixed NIH3T3-HAb2 cells. (A, green channel) Clusters of HA span a range of length scales. (B, red channel) Cofilin was dispersed diffusely throughout the cell, except for areas surrounding HA clusters. (C) Merge. Extending hundreds of nanometers to micrometers from the periphery of HA clusters was typically a zone excluding cofilin (white arrows), although this pattern was not absolute. Some small HA clusters colocalized with cofilin clusters (white arrowheads). These images were taken at the bottom membrane with an effective focal depth of ±0.5 μm. Scale bar = 2 μm. (D) The pair-cross-correlation function for HA and cofilin depends strongly on bleed-through correction. The uncorrected curve (red line) overestimates correlation and underestimates anticorrelation. The corrected (black points ± SE, n = 14 fixed cells) shows significant anticorrelation, especially on length scales of ∼600 nm.
In summary, we show here that domains of the membrane-associated protein HA associate with specific local enrichments in actin, underlying actin can influence the organization of HA in these domains, and these domains predominantly exclude the ABP cofilin.
Discussion
Imaging of HA clusters demonstrates mediation of membrane protein domains by the actin cytoskeleton on micro- and nanoscales
FPALM, which allows one to examine the dynamics of the molecular organization of cell membranes at the nanoscale, was used to image the relationship between actin and HA, a canonical example of a clustered membrane protein relevant to viral infection. Several surprising findings emerged. In the absence of any other viral components, HA was concentrated in ARMRs on nanometer length scales in nonpolarized NIH3T3-HAb2 cells. In many cases, clustered structures hundreds of nanometers long, containing both HA and actin, were observed at physiological temperatures.
On the average, pair correlation analyses suggested an ∼2-fold enrichment of HA in regions within 100 nm of actin-enriched regions. Based on the relatively large amplitude of the pair correlation (Fig. 1 G) from ∼50 nm to >1 μm (compared with that expected for an uncorrelated distribution), HA and actin colocalize over a range of length scales. One caveat to this result is that all two-color FPALM distances are measured as a projection onto the x-y plane and do not account for any separation in the axial direction (z) other than the coarse discrimination in z due to the depth of field (±0.5 μm from the focal plane). However, based on electron microscopy of the same cell type by serial section (27), the z-position variation of the coverslip-proximal membrane does not explain the observed clustering.
The use of SLCA enabled us to measure the distribution of HA cluster areas and densities (the distribution contains far more information than the average cluster size). Such data are potentially useful for quantitatively testing physical membrane models of protein clustering, for example, or for determining the fraction of membrane clusters with a minimum area or density.
Disruption of actin caused HA clusters to change in size and density. The disruptive effect was specific to the agent being used: LatA significantly reduced the densities of HA within clusters (number of HA molecules/cluster unit area), and CytoD significantly increased the cluster area and also significantly reduced the HA density within clusters (Fig. 4, A–C, E, and F). Although CytoD does inhibit elongation at the barbed ends of actin filaments, it does not inhibit the de novo nucleation of actin filaments, and thus it could be expected to have a less stringent effect on actin filament load than LatA. We propose that the decreases in HA density within clusters seen with LatA and CytoD treatments could result from either the lateral dispersion of previously clustered HA molecules or the dispersal and reformation of less dense de novo clusters after drug treatments. We believe the former possibility applies to our models (Fig. S6), although the principles of underlying actin organization are the same for both scenarios. Because actin disruptors also cause changes in cell morphology, these changes may also contribute to the observed changes in cluster morphology.
If the actin filaments themselves serve as obstacles to cage each cluster, then depolymerizing these filaments should result in the dispersal of molecules in these clusters. Indeed, this is consistent with the results we observed after treatment with LatA or CytoD. In the context of such a confinement model, one would also expect that Jas treatment, by stabilizing the actin filament barriers, would keep the HA cluster sizes constant. However, Jas treatment resulted in increased HA cluster areas, indicating a mechanism whereby actin density is positively correlated with HA clustering, and increases in cortical actin filament density stabilize existing membrane domains and their peripheries (Fig. 4 E). Similarly, instead of finding that clusters had an anticorrelation or no association with actin, as might be expected if individual actin filaments were confining whole clusters, we observed the colocalization of actin and HA at length scales spanning from tens of nanometers up to several micrometers. The alteration in HA cluster density and size with these actin-disrupting agents instead indicates that individual actin filaments (at an increased density adjacent to the HA cluster) may provide points of anchor for clustered membrane proteins.
We observed a striking lateral heterogeneity in the density of actin, and differences in the movement characteristics of HA molecules in regions of high or low actin density. Other imaging studies have illustrated the three-dimensionality of the actin cytoskeleton (67,68), and we propose that areas of dense cortical actin meshwork provide one structural basis for cluster cohesion. The highly protein-specific segregation of membrane proteins (8) is not easily explained by models that invoke arrangements of TM proteins to reduce the lateral diffusion of membrane components (see Chichili and Rodgers (13) for review). Furthermore, we observed that actin and HA colocalize on the nanoscale, which suggests that actin and membrane proteins work in concert on molecular length scales to stabilize membrane domains.
On timescales of tens of milliseconds, the motion of HA molecules was slower in proximity to actin (Fig. 2 F). The peak at ∼0° in the histogram of HA turn angles (Fig. 2 E) corresponds to HA molecules that took two successive steps in the same direction. The peak at ∼180° corresponds to HA molecules that took one step in a given direction, followed by a step in the opposite direction. The strong biases (peaks) in the histogram as a function of angle suggest confinement of HA. The dependence of the frequency of these steps on actin density suggests a role for actin in the confinement. These findings suggest that ARMRs or other actin-associated cell components constrain the motion of HA. The colocalization of HA with actin and the elongated HA cluster shape further support this interpretation.
HA clusters are associated with heterogeneous cofilin distribution: cluster-actin feedback
Cofilin is an ABP that can act to increase the dissociation (off) rates of actin monomers from filaments (48), nucleate actin filaments (44), or sever actin filaments (69) depending on the cofilin/actin molar ratios. Cofilin is implicated in a range of diverse cellular processes, including regulation of actin dynamics during cell motility and leading-edge protrusion (43).
Our finding that the actin remodeling protein cofilin is laterally excluded from regions within several hundred nanometers of HA clusters suggests that HA can directly or indirectly mediate the spatial distribution of ABPs. HA mediation of the distribution of cofilin is expected to have an effect on actin organization that provides a (possible) mechanism for two-way coupling between clustering of membrane proteins and the local actin environment (Fig. 6).
Figure 6.
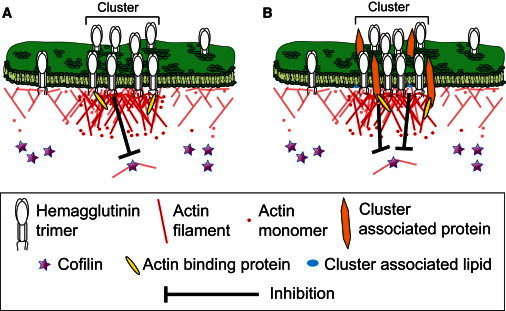
Cluster feedback. Models of actin-mediated organization of membrane proteins, and membrane protein-mediated organization of underlying actin. (A) HA signals to inactivate cofilin immediately adjacent to the plasma membrane, resulting in a higher local density of longer, more stable actin filaments. These filaments create a meshwork and increase the numbers of potential anchor points for HA molecules. Intermediate ABPs that may link actin filaments and HA proteins are unknown. Inverted black T indicates inhibition of cofilin. (B) HA clusters with other membrane-bound proteins and lipids, which themselves signal to inactivate cofilin locally. As in model A, this inactivation results in an increased local density of actin filaments and hence an increase in the number of anchor points for proteins in the cluster. Inverted black T indicates inhibition of cofilin.
Although there is considerable evidence for interactions between other influenza viral components and actin, we found no published evidence for HA interacting directly with actin. However, surface accumulation of HA can activate the PKCα and Raf/MEK/ERK signaling pathways (25), which both depend on and mediate actin structure (70,71). Thus, although we have not demonstrated the role of signaling in the observed HA and cofilin distributions, pathways have been identified through which HA could mediate actin and ABP organization.
Lateral mobility of HA: dynamic properties depend on local actin density
The dynamic nature of the actin cytoskeleton cannot be easily portrayed in a static figure. The observed effects of a 10 min LatA treatment on HA cluster morphology indicate that the actin filaments underlying these HA domains are likely turning over within this time. This highlights an important point: if membrane-associated actin filaments were dynamically treadmilling, one would expect attachments between HA and actin to be transitory, as has been proposed for potassium channels in living cell membranes (17).
We observed two mobile populations of HA: one fraction (74% ± 7%) with a diffusion coefficient (D1 = 0.109 ± 0.066 μm2/s) that is consistent with the mobile fraction and diffusion coefficient measured by FRAP at 37°C (18,72). Note that the interpretation of the fraction of the two HA populations could be complicated by exchange between the two populations, and by the limited timescale over which HA trajectories can be obtained. Interestingly, the slow-moving HA fraction we observed could appear to be the immobile fraction in FRAP experiments. The finding that the slow-moving HA population is not completely immobile demonstrates that even within membrane regions that are highly concentrated with HA, and despite the strong correlation between HA and actin distributions, some lateral mobility is retained. Although it is consistent with predictions of anomalous lateral diffusion, the observation of HA mobility precludes the possibility that the HA molecules themselves serve as either immobile pickets in the membrane-associated fence, or that HA itself is bound directly to such immobile pickets.
Previous research has indicated the involvement of the G-protein-activated Src-family kinase Lyn in inducing periods of reduced mobility in clusters of GPI-anchored receptors (73). The cross-linking of GPI-anchored receptors also induces the formation of clusters on the order of hundreds of nanometers in size that colocalize with actin (41). It is unclear in our case whether HA acts to reorganize actin by directly initiating signaling cascades (Fig. 6 A) or indirectly through other regulators of actin organization (Fig. 6 B). Because cortical actin can mediate phase separation of membrane lipids (74,75), local enrichments in cortical actin may allow for a framework to which some membrane proteins can bind, while also stabilizing patches of certain lipids and proteins around these aggregations. Cell-surface accumulation and clustering of HA are known to activate PKCα and Raf/MEK/ERK pathways (25), both of which can regulate cofilin (63,76). Phosphatidylinositol bisphosphate (PIP2) (4,5) is associated with each of these pathways (77,78) and is a regulator of cofilin activity (79). PIP2 has also been implicated in mediating signaling from membrane domains to the cytoskeleton (80). Further work in which cofilin is imaged together with its regulators will help to elucidate the upstream pathways that ultimately control local cytoskeletal organization and its interactions with membrane components.
Acknowledgments
The authors thank J. Rochira, J. Bewersdorf, S. Bolduc, P. Blank, P. Wadsworth, S.R. McKay, A. DeCarlo, M. Parent, P. Andresen, P. Gunning, T. Fath, J. Bamburg, and R.D. Astumian for useful discussions; T. Tripp and D. Breton for machining, D. Bouchard, S. Ashworth, L. Hutchinson, R. Kennedy, M. Pietraszewski, R. Phennicie, J. Shim, K. Brothers, M. Mason, E. Allgeyer, and P. Millard for help with equipment and experiments; P. Byard for administrative assistance; and T. Schmidt and S. Semrau for the PICS analysis software and discussion.
This work was funded by the National Institutes of Health (NIH Career Award K25-AI65459, NIH R15-GM094713, NSF MRI CHE-0722759, and IGERT-0221625), the Maine Technology Institute (MTAF 1106 and 2061), UMaine V.P. for Research, the Maine Economic Improvement Fund (MEIF), and the Intramural Research Program of the National Institute of Child Health and Human Development. T.J.G. benefited from an MEIF doctoral dissertation fellowship. S.T.H. and T.J.G. hold patents in superresolution microscopy. S.T.H. serves on the scientific advisory board of Vutara, Inc.
Footnotes
Manasa V. Gudheti’s present address is Department of Biology, University of Utah, and Vutara, Inc., Salt Lake City, Utah.
Travis J. Gould’s present address is Department of Cell Biology, Yale University School of Medicine, New Haven, Connecticut.
Supporting Material
References
- 1.Anderson R.G.W., Jacobson K. A role for lipid shells in targeting proteins to caveolae, rafts, and other lipid domains. Science. 2002;296:1821–1825. doi: 10.1126/science.1068886. [DOI] [PubMed] [Google Scholar]
- 2.Jacobson K., Mouritsen O.G., Anderson R.G. Lipid rafts: at a crossroad between cell biology and physics. Nat. Cell Biol. 2007;9:7–14. doi: 10.1038/ncb0107-7. [DOI] [PubMed] [Google Scholar]
- 3.Feder T.J., Brust-Mascher I., Webb W.W. Constrained diffusion or immobile fraction on cell surfaces: a new interpretation. Biophys. J. 1996;70:2767–2773. doi: 10.1016/S0006-3495(96)79846-6. [DOI] [PMC free article] [PubMed] [Google Scholar]
- 4.Elson E.L., Schlessinger J., Webb W.W. Measurement of lateral transport on cell surfaces. Prog. Clin. Biol. Res. 1976;9:137–147. [PubMed] [Google Scholar]
- 5.Sako Y., Kusumi A. Barriers for lateral diffusion of transferrin receptor in the plasma membrane as characterized by receptor dragging by laser tweezers: fence versus tether. J. Cell Biol. 1995;129:1559–1574. doi: 10.1083/jcb.129.6.1559. [DOI] [PMC free article] [PubMed] [Google Scholar]
- 6.Fujiwara T., Ritchie K., Kusumi A. Phospholipids undergo hop diffusion in compartmentalized cell membrane. J. Cell Biol. 2002;157:1071–1081. doi: 10.1083/jcb.200202050. [DOI] [PMC free article] [PubMed] [Google Scholar]
- 7.Sheetz M.P. Membrane skeletal dynamics: role in modulation of red cell deformability, mobility of transmembrane proteins, and shape. Semin. Hematol. 1983;20:175–188. [PubMed] [Google Scholar]
- 8.Chichili G.R., Rodgers W. Clustering of membrane raft proteins by the actin cytoskeleton. J. Biol. Chem. 2007;282:36682–36691. doi: 10.1074/jbc.M702959200. [DOI] [PubMed] [Google Scholar]
- 9.Goswami D., Gowrishankar K., Mayor S. Nanoclusters of GPI-anchored proteins are formed by cortical actin-driven activity. Cell. 2008;135:1085–1097. doi: 10.1016/j.cell.2008.11.032. [DOI] [PMC free article] [PubMed] [Google Scholar]
- 10.Holowka D., Sheets E.D., Baird B. Interactions between Fc(ε)RI and lipid raft components are regulated by the actin cytoskeleton. J. Cell Sci. 2000;113:1009–1019. doi: 10.1242/jcs.113.6.1009. [DOI] [PubMed] [Google Scholar]
- 11.Villalba M., Bi K., Altman A. Vav1/Rac-dependent actin cytoskeleton reorganization is required for lipid raft clustering in T cells. J. Cell Biol. 2001;155:331–338. doi: 10.1083/jcb.200107080. [DOI] [PMC free article] [PubMed] [Google Scholar]
- 12.Jordan S., Rodgers W. T cell glycolipid-enriched membrane domains are constitutively assembled as membrane patches that translocate to immune synapses. J. Immunol. 2003;171:78–87. doi: 10.4049/jimmunol.171.1.78. [DOI] [PubMed] [Google Scholar]
- 13.Chichili G.R., Rodgers W. Cytoskeleton-membrane interactions in membrane raft structure. Cell. Mol. Life Sci. 2009;66:2319–2328. doi: 10.1007/s00018-009-0022-6. [DOI] [PMC free article] [PubMed] [Google Scholar]
- 14.Jaqaman K., Kuwata H., Grinstein S. Cytoskeletal control of CD36 diffusion promotes its receptor and signaling function. Cell. 2011;146:593–606. doi: 10.1016/j.cell.2011.06.049. [DOI] [PMC free article] [PubMed] [Google Scholar]
- 15.Viola A., Gupta N. Tether and trap: regulation of membrane-raft dynamics by actin-binding proteins. Nat. Rev. Immunol. 2007;7:889–896. doi: 10.1038/nri2193. [DOI] [PubMed] [Google Scholar]
- 16.Sheetz M.P., Sable J.E., Döbereiner H.-G. Continuous membrane-cytoskeleton adhesion requires continuous accommodation to lipid and cytoskeleton dynamics. Annu. Rev. Biophys. Biomol. Struct. 2006;35:417–434. doi: 10.1146/annurev.biophys.35.040405.102017. [DOI] [PubMed] [Google Scholar]
- 17.Weigel A.V., Simon B., Krapf D. Ergodic and nonergodic processes coexist in the plasma membrane as observed by single-molecule tracking. Proc. Natl. Acad. Sci. USA. 2011;108:6438–6443. doi: 10.1073/pnas.1016325108. [DOI] [PMC free article] [PubMed] [Google Scholar]
- 18.Kenworthy A.K., Nichols B.J., Lippincott-Schwartz J. Dynamics of putative raft-associated proteins at the cell surface. J. Cell Biol. 2004;165:735–746. doi: 10.1083/jcb.200312170. [DOI] [PMC free article] [PubMed] [Google Scholar]
- 19.White J., Helenius A., Gething M.J. Haemagglutinin of influenza virus expressed from a cloned gene promotes membrane fusion. Nature. 1982;300:658–659. doi: 10.1038/300658a0. [DOI] [PubMed] [Google Scholar]
- 20.Ellens H., Bentz J., White J.M. Fusion of influenza hemagglutinin-expressing fibroblasts with glycophorin-bearing liposomes: role of hemagglutinin surface density. Biochemistry. 1990;29:9697–9707. doi: 10.1021/bi00493a027. [DOI] [PubMed] [Google Scholar]
- 21.Chen B.J., Leser G.P., Lamb R.A. Influenza virus hemagglutinin and neuraminidase, but not the matrix protein, are required for assembly and budding of plasmid-derived virus-like particles. J. Virol. 2007;81:7111–7123. doi: 10.1128/JVI.00361-07. [DOI] [PMC free article] [PubMed] [Google Scholar]
- 22.Takeda M., Leser G.P., Lamb R.A. Influenza virus hemagglutinin concentrates in lipid raft microdomains for efficient viral fusion. Proc. Natl. Acad. Sci. USA. 2003;100:14610–14617. doi: 10.1073/pnas.2235620100. [DOI] [PMC free article] [PubMed] [Google Scholar]
- 23.Shaw M.L., Stone K.L., Palese P. Cellular proteins in influenza virus particles. PLoS Pathog. 2008;4:e1000085. doi: 10.1371/journal.ppat.1000085. [DOI] [PMC free article] [PubMed] [Google Scholar]
- 24.Simpson-Holley M., Ellis D., Digard P. A functional link between the actin cytoskeleton and lipid rafts during budding of filamentous influenza virions. Virology. 2002;301:212–225. doi: 10.1006/viro.2002.1595. [DOI] [PubMed] [Google Scholar]
- 25.Marjuki H., Alam M.I., Pleschka S. Membrane accumulation of influenza A virus hemagglutinin triggers nuclear export of the viral genome via protein kinase Cα-mediated activation of ERK signaling. J. Biol. Chem. 2006;281:16707–16715. doi: 10.1074/jbc.M510233200. [DOI] [PubMed] [Google Scholar]
- 26.Hess S.T., Gould T.J., Zimmerberg J. Dynamic clustered distribution of hemagglutinin resolved at 40 nm in living cell membranes discriminates between raft theories. Proc. Natl. Acad. Sci. USA. 2007;104:17370–17375. doi: 10.1073/pnas.0708066104. [DOI] [PMC free article] [PubMed] [Google Scholar]
- 27.Hess S.T., Kumar M., Zimmerberg J. Quantitative electron microscopy and fluorescence spectroscopy of the membrane distribution of influenza hemagglutinin. J. Cell Biol. 2005;169:965–976. doi: 10.1083/jcb.200412058. [DOI] [PMC free article] [PubMed] [Google Scholar]
- 28.Hess S.T., Girirajan T.P.K., Mason M.D. Ultra-high resolution imaging by fluorescence photoactivation localization microscopy. Biophys. J. 2006;91:4258–4272. doi: 10.1529/biophysj.106.091116. [DOI] [PMC free article] [PubMed] [Google Scholar]
- 29.Gould T.J., Gunewardene M.S., Hess S.T. Nanoscale imaging of molecular positions and anisotropies. Nat. Methods. 2008;5:1027–1030. doi: 10.1038/nmeth.1271. [DOI] [PMC free article] [PubMed] [Google Scholar]
- 30.Subach F.V., Patterson G.H., Verkhusha V.V. Photoactivatable mCherry for high-resolution two-color fluorescence microscopy. Nat. Methods. 2009;6:153–159. doi: 10.1038/nmeth.1298. [DOI] [PMC free article] [PubMed] [Google Scholar]
- 31.Sambrook J., Rodgers L., Gething M.J. Lines of BPV-transformed murine cells that constitutively express influenza virus hemagglutinin. EMBO J. 1985;4:91–103. doi: 10.1002/j.1460-2075.1985.tb02322.x. [DOI] [PMC free article] [PubMed] [Google Scholar]
- 32.Gunewardene M.S., Subach F.V., Hess S.T. Superresolution imaging of multiple fluorescent proteins with highly overlapping emission spectra in living cells. Biophys. J. 2011;101:1522–1528. doi: 10.1016/j.bpj.2011.07.049. [DOI] [PMC free article] [PubMed] [Google Scholar]
- 33.Sneath P.H. The application of computers to taxonomy. J. Gen. Microbiol. 1957;17:201–226. doi: 10.1099/00221287-17-1-201. [DOI] [PubMed] [Google Scholar]
- 34.Greenfield D., McEvoy A.L., Liphardt J. Self-organization of the Escherichia coli chemotaxis network imaged with super-resolution light microscopy. PLoS Biol. 2009;7:e1000137. doi: 10.1371/journal.pbio.1000137. [DOI] [PMC free article] [PubMed] [Google Scholar]
- 35.Semrau S., Schmidt T. Particle image correlation spectroscopy (PICS): retrieving nanometer-scale correlations from high-density single-molecule position data. Biophys. J. 2007;92:613–621. doi: 10.1529/biophysj.106.092577. [DOI] [PMC free article] [PubMed] [Google Scholar]
- 36.Gower J.C., Ross G.J.S. Minimum spanning trees and single linkage cluster analysis. J. R. Stat. Soc. Ser. C Appl. Stat. 1969;18:54–64. [Google Scholar]
- 37.Coué M., Brenner S.L., Korn E.D. Inhibition of actin polymerization by latrunculin A. FEBS Lett. 1987;213:316–318. doi: 10.1016/0014-5793(87)81513-2. [DOI] [PubMed] [Google Scholar]
- 38.Brown S.S., Spudich J.A. Cytochalasin inhibits the rate of elongation of actin filament fragments. J. Cell Biol. 1979;83:657–662. doi: 10.1083/jcb.83.3.657. [DOI] [PMC free article] [PubMed] [Google Scholar]
- 39.Bubb M.R., Senderowicz A.M.J., Korn E.D. Jasplakinolide, a cytotoxic natural product, induces actin polymerization and competitively inhibits the binding of phalloidin to F-actin. J. Biol. Chem. 1994;269:14869–14871. [PubMed] [Google Scholar]
- 40.Veatch S.L., Machta B.B., Baird B.A. Correlation functions quantify super-resolution images and estimate apparent clustering due to over-counting. PLoS ONE. 2012;7:e31457. doi: 10.1371/journal.pone.0031457. [DOI] [PMC free article] [PubMed] [Google Scholar]
- 41.Sengupta P., Jovanovic-Talisman T., Lippincott-Schwartz J. Probing protein heterogeneity in the plasma membrane using PALM and pair correlation analysis. Nat. Methods. 2011;8:969–975. doi: 10.1038/nmeth.1704. [DOI] [PMC free article] [PubMed] [Google Scholar]
- 42.Bamburg J.R. Proteins of the ADF/cofilin family: essential regulators of actin dynamics. Annu. Rev. Cell Dev. Biol. 1999;15:185–230. doi: 10.1146/annurev.cellbio.15.1.185. [DOI] [PubMed] [Google Scholar]
- 43.Bernstein B.W., Bamburg J.R. ADF/cofilin: a functional node in cell biology. Trends Cell Biol. 2010;20:187–195. doi: 10.1016/j.tcb.2010.01.001. [DOI] [PMC free article] [PubMed] [Google Scholar]
- 44.Andrianantoandro E., Pollard T.D. Mechanism of actin filament turnover by severing and nucleation at different concentrations of ADF/cofilin. Mol. Cell. 2006;24:13–23. doi: 10.1016/j.molcel.2006.08.006. [DOI] [PubMed] [Google Scholar]
- 45.Arber S., Barbayannis F.A., Caroni P. Regulation of actin dynamics through phosphorylation of cofilin by LIM-kinase. Nature. 1998;393:805–809. doi: 10.1038/31729. [DOI] [PubMed] [Google Scholar]
- 46.Bernard O. Lim kinases, regulators of actin dynamics. Int. J. Biochem. Cell Biol. 2007;39:1071–1076. doi: 10.1016/j.biocel.2006.11.011. [DOI] [PubMed] [Google Scholar]
- 47.Borisy G.G., Svitkina T.M. Actin machinery: pushing the envelope. Curr. Opin. Cell Biol. 2000;12:104–112. doi: 10.1016/s0955-0674(99)00063-0. [DOI] [PubMed] [Google Scholar]
- 48.Carlier M.-F., Laurent V., Pantaloni D. Actin depolymerizing factor (ADF/cofilin) enhances the rate of filament turnover: implication in actin-based motility. J. Cell Biol. 1997;136:1307–1322. doi: 10.1083/jcb.136.6.1307. [DOI] [PMC free article] [PubMed] [Google Scholar]
- 49.Endo M., Ohashi K., Mizuno K. LIM kinase and slingshot are critical for neurite extension. J. Biol. Chem. 2007;282:13692–13702. doi: 10.1074/jbc.M610873200. [DOI] [PubMed] [Google Scholar]
- 50.Endo M., Ohashi K., Mizuno K. Control of growth cone motility and morphology by LIM kinase and Slingshot via phosphorylation and dephosphorylation of cofilin. J. Neurosci. 2003;23:2527–2537. doi: 10.1523/JNEUROSCI.23-07-02527.2003. [DOI] [PMC free article] [PubMed] [Google Scholar]
- 51.Ghosh M., Song X., Condeelis J.S. Cofilin promotes actin polymerization and defines the direction of cell motility. Science. 2004;304:743–746. doi: 10.1126/science.1094561. [DOI] [PubMed] [Google Scholar]
- 52.Gu J., Lee C.W., Zheng J.Q. ADF/cofilin-mediated actin dynamics regulate AMPA receptor trafficking during synaptic plasticity. Nat. Neurosci. 2010;13:1208–1215. doi: 10.1038/nn.2634. [DOI] [PMC free article] [PubMed] [Google Scholar]
- 53.Gungabissoon R.A., Bamburg J.R. Regulation of growth cone actin dynamics by ADF/cofilin. J. Histochem. Cytochem. 2003;51:411–420. doi: 10.1177/002215540305100402. [DOI] [PubMed] [Google Scholar]
- 54.Kiuchi T., Ohashi K., Mizuno K. Cofilin promotes stimulus-induced lamellipodium formation by generating an abundant supply of actin monomers. J. Cell Biol. 2007;177:465–476. doi: 10.1083/jcb.200610005. [DOI] [PMC free article] [PubMed] [Google Scholar]
- 55.Kuhn T.B., Meberg P.J., Bamburg J.R. Regulating actin dynamics in neuronal growth cones by ADF/cofilin and rho family GTPases. J. Neurobiol. 2000;44:126–144. [PubMed] [Google Scholar]
- 56.McGough A., Pope B., Weeds A. Cofilin changes the twist of F-actin: implications for actin filament dynamics and cellular function. J. Cell Biol. 1997;138:771–781. doi: 10.1083/jcb.138.4.771. [DOI] [PMC free article] [PubMed] [Google Scholar]
- 57.Minamide L.S., Painter W.B., Bamburg J.R. Differential regulation of actin depolymerizing factor and cofilin in response to alterations in the actin monomer pool. J. Biol. Chem. 1997;272:8303–8309. doi: 10.1074/jbc.272.13.8303. [DOI] [PubMed] [Google Scholar]
- 58.Nakano K., Mabuchi I. Actin-depolymerizing protein Adf1 is required for formation and maintenance of the contractile ring during cytokinesis in fission yeast. Mol. Biol. Cell. 2006;17:1933–1945. doi: 10.1091/mbc.E05-09-0900. [DOI] [PMC free article] [PubMed] [Google Scholar]
- 59.Nishimura Y., Yoshioka K., Itoh K. A role of LIM kinase 1/cofilin pathway in regulating endocytic trafficking of EGF receptor in human breast cancer cells. Histochem. Cell Biol. 2006;126:627–638. doi: 10.1007/s00418-006-0198-x. [DOI] [PubMed] [Google Scholar]
- 60.Okreglak V., Drubin D.G. Cofilin recruitment and function during actin-mediated endocytosis dictated by actin nucleotide state. J. Cell Biol. 2007;178:1251–1264. doi: 10.1083/jcb.200703092. [DOI] [PMC free article] [PubMed] [Google Scholar]
- 61.Pawlak G., Helfman D.M. MEK mediates v-Src-induced disruption of the actin cytoskeleton via inactivation of the Rho-ROCK-LIM kinase pathway. J. Biol. Chem. 2002;277:26927–26933. doi: 10.1074/jbc.M202261200. [DOI] [PubMed] [Google Scholar]
- 62.Rosso S., Bollati F., Cáceres A. LIMK1 regulates Golgi dynamics, traffic of Golgi-derived vesicles, and process extension in primary cultured neurons. Mol. Biol. Cell. 2004;15:3433–3449. doi: 10.1091/mbc.E03-05-0328. [DOI] [PMC free article] [PubMed] [Google Scholar]
- 63.Sakuma M., Shirai Y., Saito N. Novel PKCα-mediated phosphorylation site(s) on cofilin and their potential role in terminating histamine release. Mol. Biol. Cell. 2012;23:3707–3721. doi: 10.1091/mbc.E12-01-0053. [DOI] [PMC free article] [PubMed] [Google Scholar]
- 64.Sarmiere P.D., Bamburg J.R. Regulation of the neuronal actin cytoskeleton by ADF/cofilin. J. Neurobiol. 2004;58:103–117. doi: 10.1002/neu.10267. [DOI] [PubMed] [Google Scholar]
- 65.Wang W., Mouneimne G., Condeelis J.S. The activity status of cofilin is directly related to invasion, intravasation, and metastasis of mammary tumors. J. Cell Biol. 2006;173:395–404. doi: 10.1083/jcb.200510115. [DOI] [PMC free article] [PubMed] [Google Scholar]
- 66.Yang N., Higuchi O., Mizuno K. Cofilin phosphorylation by LIM-kinase 1 and its role in Rac-mediated actin reorganization. Nature. 1998;393:809–812. doi: 10.1038/31735. [DOI] [PubMed] [Google Scholar]
- 67.Pollard T.D., Borisy G.G. Cellular motility driven by assembly and disassembly of actin filaments. Cell. 2003;112:453–465. doi: 10.1016/s0092-8674(03)00120-x. [DOI] [PubMed] [Google Scholar]
- 68.Verkhovsky A.B., Chaga O.Y., Borisy G.G. Orientational order of the lamellipodial actin network as demonstrated in living motile cells. Mol. Biol. Cell. 2003;14:4667–4675. doi: 10.1091/mbc.E02-10-0630. [DOI] [PMC free article] [PubMed] [Google Scholar]
- 69.Chen H., Bernstein B.W., Bamburg J.R. Regulating actin-filament dynamics in vivo. Trends Biochem. Sci. 2000;25:19–23. doi: 10.1016/s0968-0004(99)01511-x. [DOI] [PubMed] [Google Scholar]
- 70.Su B., Bu Y., Gelman I.H. SSeCKS/Gravin/AKAP12 inhibits cancer cell invasiveness and chemotaxis by suppressing a protein kinase C-Raf/MEK/ERK pathway. J. Biol. Chem. 2010;285:4578–4586. doi: 10.1074/jbc.M109.073494. [DOI] [PMC free article] [PubMed] [Google Scholar]
- 71.Larsson C. Protein kinase C and the regulation of the actin cytoskeleton. Cell. Signal. 2006;18:276–284. doi: 10.1016/j.cellsig.2005.07.010. [DOI] [PubMed] [Google Scholar]
- 72.Engel S., Scolari S., Veit M. FLIM-FRET and FRAP reveal association of influenza virus haemagglutinin with membrane rafts. Biochem. J. 2010;425:567–573. doi: 10.1042/BJ20091388. [DOI] [PubMed] [Google Scholar]
- 73.Suzuki K.G., Fujiwara T.K., Kusumi A. GPI-anchored receptor clusters transiently recruit Lyn and G α for temporary cluster immobilization and Lyn activation: single-molecule tracking study 1. J. Cell Biol. 2007;177:717–730. doi: 10.1083/jcb.200609174. [DOI] [PMC free article] [PubMed] [Google Scholar]
- 74.Liu A.P., Fletcher D.A. Actin polymerization serves as a membrane domain switch in model lipid bilayers. Biophys. J. 2006;91:4064–4070. doi: 10.1529/biophysj.106.090852. [DOI] [PMC free article] [PubMed] [Google Scholar]
- 75.Baumgart T., Hammond A.T., Webb W.W. Large-scale fluid/fluid phase separation of proteins and lipids in giant plasma membrane vesicles. Proc. Natl. Acad. Sci. USA. 2007;104:3165–3170. doi: 10.1073/pnas.0611357104. [DOI] [PMC free article] [PubMed] [Google Scholar]
- 76.Nebl G., Fischer S., Samstag Y. Dephosphorylation of cofilin is regulated through Ras and requires the combined activities of the Ras-effectors MEK and PI3K. Cell. Signal. 2004;16:235–243. doi: 10.1016/s0898-6568(03)00133-5. [DOI] [PubMed] [Google Scholar]
- 77.Lopez C.I., Pelletán L.E., Belmonte S.A. Diacylglycerol stimulates acrosomal exocytosis by feeding into a PKC- and PLD1-dependent positive loop that continuously supplies phosphatidylinositol 4,5-bisphosphate. Biochim. Biophys. Acta. 2012;1821:1186–1199. doi: 10.1016/j.bbalip.2012.05.001. [DOI] [PubMed] [Google Scholar]
- 78.Garrenton L.S., Stefan C.J., Thorner J. Pheromone-induced anisotropy in yeast plasma membrane phosphatidylinositol-4,5-bisphosphate distribution is required for MAPK signaling. Proc. Natl. Acad. Sci. USA. 2010;107:11805–11810. doi: 10.1073/pnas.1005817107. [DOI] [PMC free article] [PubMed] [Google Scholar]
- 79.Yonezawa N., Nishida E., Sakai H. Inhibition of the interactions of cofilin, destrin, and deoxyribonuclease I with actin by phosphoinositides. J. Biol. Chem. 1990;265:8382–8386. [PubMed] [Google Scholar]
- 80.Johnson C.M., Rodgers W. Spatial segregation of phosphatidylinositol 4,5-bisphosphate (PIP(2)) signaling in immune cell functions. Immunol. Endocr. Metab. Agents Med. Chem. 2008;8:349–357. doi: 10.2174/187152208787169233. [DOI] [PMC free article] [PubMed] [Google Scholar]
Associated Data
This section collects any data citations, data availability statements, or supplementary materials included in this article.