

Abstract
Recent studies have focused on the association between dialysate sodium (Na+) prescriptions and interdialytic weight gain (IDWG). We report on a case series of 13 patients undergoing conventional, thrice-weekly in-center hemodialysis with an individualized dialysate Na+ prescription. Individualized dialysate Na+ was achieved in all patients through a stepwise weekly reduction of the standard dialysate Na+ prescription (140 mEq/L) by 2–3 mEq/L until reaching a Na+ gradient of −2 mEq/L (dialysate Na+ minus average plasma Na+ over the preceding 3 months). Interdialytic weight gain, with and without indexing to dry weight (IDWG%), blood pressure, and the proportion of treatments with cramps, intradialytic hypotension (drop in systolic blood pressure >30 mmHg) and intradialytic hypotension requiring an intervention were reviewed. At the beginning of the observation period, the pre-hemodialysis (HD) plasma Na+ concentration ranged from 130 to 141 mEq/L. When switched from the standard to the individualized dialysate Na+ concentration, IDWG% decreased from 3.4% ± 1.6% to 2.5% ± 1.0% (P = 0.003) with no change in pre- or post-HD systolic or diastolic blood pressures (all P > 0.05). We found no significant change in the proportion of treatments with cramps (6% vs. 1.3%), intradialytic hypotension (62% vs. 65%), or intradialytic hypotension requiring an intervention (29% vs. 33%). Individualized reduction of dialysate Na+ reduces IDWG% without significantly increasing the frequency of cramps or hypotension.
Keywords: Hemodialysis, dialysate sodium, individualized dialysate sodium, sodium gradient, interdialytic weight gain
INTRODUCTION
Excess Na+ intake and subsequent volume overload are major clinical problems among patients on hemodialysis (HD),1–4 which contribute to short- and long-term adverse outcomes. Over the last 30 years, dialysale Na+ concentrations gradually increased to facilitate shorter HD session length (the “t” of Kt/V), higher ultrafiltration rates (UFRs), and volumes, and to minimize associated patient discomfort.5–7 Standard dialysale Na+ prescriptions in the 1970s were around 125–130 mEq/L and are now in the range of 140–145 mEq/L or sometimes higher in the context of sodium modeling,6,8
Hemodialysis wiih a positive Na+ gradient, i.e., dialysate Na+ exceeds plasma Na+, allows for Na+ to diffuse from the dialysate into the plasma. A positive Na+ balance stimulates the thirst mechanism to return plasma Na+ to its preferred osmolar set point or inherent plasma Na+ concentration.4,6,9–11. This “vicious cycle” results in excess interdialytic weight gain (IDWG). As total per session ultrafiltration (UF) is limited by patient tolerability to high UFR,12 many patients suffer from chronic volume overload, often resulting in the prescription of additional anli-hypertensive agents, further compromising UFR, and resulting in patients not reaching prescribed target (“dry”) weight. Volume overload is associated wilh hypertension,3 left ventricular hypertrophy,13 congestive heart failure,1 and other adverse cardiovascular sequelae.7,13,14
The use of lower dialysate sodium prescriptions has been shown to reduce thirst, IDWG, blood pressure, and total UF required to achieve dry weight.12 Hemodialysis with an isonatremic dialysate prescription in 27 stable patients on conventional, thrice-weekly in-center HD in Brazil resulted in a reduction in thirst, IDWG, uncontrolled blood pressure, and also intradialytic adverse events.4 Similarly findings from New Zealand reported a reduction in blood pressure when dialysate Na+ prescriptions were lowered throughout the dialysis facility.15 We recently reported that a standardized reduction in dialysate Na+ prescriptions among patients on in-center nocturnal HD resulted in a significant reduction in IDWG and pre-HD blood pressure without increasing adverse events.16 As an “eunatremic Na+ prescription” with minimal Na+ diffusion is expected to occur when the dialysale Na+ is 1.5–5 mmol/L below the plasma Na+,17 a gradient of −2 mEq/L was chosen as the individualized reduced Na+ target. Herein, we report a case series of 13 patients on conventional HD, whose dialysate Na+ prescription was decreased individually to achieve a gradient of −2 mEq/L and the resultant effects on IDWG, blood pressure, and adverse events.
METHODS
We report a prospective case series of 13 patients with end-stage renal disease (ESRD), all of whom were followed by a single physician-provider and were undergoing conventional, thrice-weekly in-center HD from September 2010 to December 2010.
All patients were initially dialyzed with a standard dialysate Na+ prescription of 140 mEq/L for 2 weeks. This period is referred to as phase A (Figure 1). Then, the dialysale Na+ prescription was tapered weekly by 2–3 mEq/L until reaching a Na+ gradient of −2 mEq/L. The tapering phase lasted for 4 weeks. Abrupt changes in dialysale Na+ prescriptions were avoided to prevent acute osmotic fluid shifts. The Na+ gradient was defined by the prescribed dialysate Na+ minus the average plasma Na+, the latter calculated as the mean of the plasma Na+ over the preceding 3 months. During the study, the dialysate Na+ was not further readjusted to monthly plasma Na+ levels. Although individuals reached a Na+ gradient of −2 mEq/L at varying times, they transitioned to phase B on the same day. Phase B refers to a 4-week period during which all patients were dialyzed with a Na+ gradient of −2 mEq/L. The goal Na+ gradient of −2 mEq/L was a nominal target and did not reflect effective sodium diffusion gradients. Dialysate Na+ was not measured or estimated by dialysate conductivity measurements. Plasma sodium was measured by indirect ion selective electrode measurements.
Figure 1.
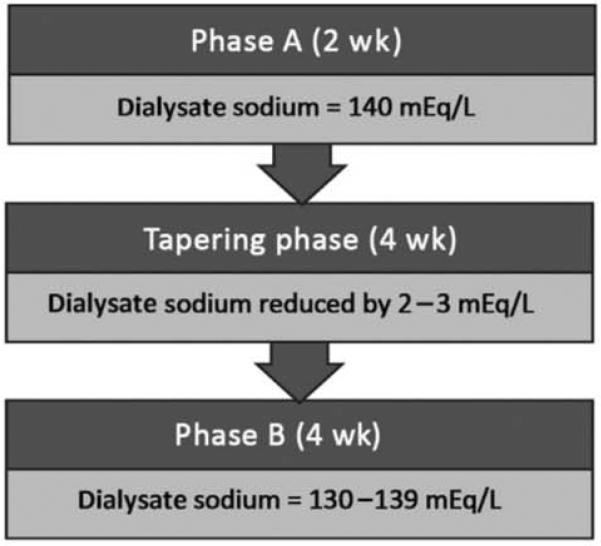
Outline of study phases.
All patients were dialyzed using high flux, large surface area polysulfone dialyzers. Standard dialysate prescriptions were composed of the following solution: potassium. 1–3 mEq/L; bicarbonate, 40 mEq/L; and calcium, 2.5–3.5 mEq/L. The prescription included a session length of 150–255 minute, blood flow of 300–450 mL/minute, and dialysate flow of 600–900 mL/minute.
All blood samples were collected during the third week of every month per standard protocol at Satellite Healthcare, Inc., and processed at Satellite Laboratories (Redwood City, CA, USA). Routine laboratory values drawn included pre- and post-HD plasma Na+, glucose, albumin, and urea nitrogen. The electronic medical record system was used to collect demographics, vintage (time since the start of HD), comorbidities, access type, dry weight, dialysate prescription, systolic blood pressure (SBP) and diastolic blood pressure (DBP) (pre-, intra-, and post-HD), IDWG, UFR, symptoms, and interventions.
All patients received routine dietary education to limit salt intake to no more than 5 g/day. Dry weight was estimated by the treating nephrologist, and adjustments were made by nursing staff according to the standard protocol. Any change greater than 1.0 kg required physician approval.
OPERATIONAL DEFINITIONS
Interdialytic weight gain was defined as the difference between pre-HD weight minus post-HD weight from the previous session The IDWG% was calculated by dividing the IDWG by the dry weight multiplied by 100. Ultrafiltration volume was defined as pre-HD weight minus post-HD weight taken on the same day. Ultrafiltration rate (mL/hour/kg) was calculated by dividing UF by the length of treatment in hours divided hy post-HD weight.
Hemodialysis-related adverse events including cramps and hypotension were recorded by the nursing staff. Intradialytic hypotension (IDH) was defined as the difference in pre-HD SBP and lowest intradialytic SBP > 30 mmHg or difference between any two intradialytic SBP > 30 mmHg. Interventions included normal saline administration, placement in Trendelenburg or supine position, and UF reduction or discontinuation.
Statistical analysis
We used the Student's t-test for paired samples to compare continuous variables between phase A and phase B. Two-tailed P values < 0.05 were considered statistically significant. The Wilcoxon signed-rank test, a nonparametric analog to the paired t-test, was used to analyze the differences between the paired measurements (the proportion of treatments with adverse events between phases—cramps. IDH, and IDH requiring interventions) for each patient. We used Microsoft Office Excel 2007 and the SAS version 9.2 (SAS Institute, Inc., Cary, NC, USA) for all calculations.
RESULTS
We analyzed a total of 383 sessions in the 13 patients. Baseline demographics and clinical characteristics of the study population are shown in Table 1. All patients dialyzed at the same dialysis unit under the care of one nephrologist (GMC).
Table 1.
Baseline demographic and clinical characteristics of patients
| Characteristics | n = 13 |
|---|---|
| Age (y) | 61 (56–72) |
| Male (%) | 10 (77) |
| Black (%) | 3 (23) |
| Dialysis vintage (mo) | 34 (20–82) |
| Length of treatment (min) | 180 (180–195) |
| Access (%) | |
| Arteriovenous fistula | 8 (62) |
| Arteriovenous graft | 3 (23) |
| Catheter | 2 (13) |
| spKt/V | 1.7 ± 0.2 |
| Dry body weight (kg) | 71.5 ± 13.8 |
| Glucose (mg/dL) | 142 ± 72.8 |
| Hemoglobin (g/dL) | 11.5 ± 0.7 |
| Albumin (g/dL) | 3.9 ± 0.3 |
| Cause of end-stage renal disease | |
| Diabetes | 5 (38) |
| Hypertension | 7 (54) |
| Chronic glomerulonephritis | 1 (8) |
| Comorbidities | |
| Congestive heart failure (%) | 3 (24) |
| Diabetes (%) | 7 (54) |
Values are expressed as mean ± SD, number (%), or median (25th–75th percentile) to describe selected characteristics.
spKt/V = single pool Kt/V per session.
The baseline pre-HD plasma sodium concentration was 135.3 ± 3.7 mEq/L, with an average of 1% intraindividual coefficient of variation. In phase A, the post-HD plasma Na+ increased by 1.5 ± 0.4 mEq/L compared with the pre-HD plasma sodium (Table 2). Hemodialysis with an individually reduced dialysate Na+ achieving a gradient of −2 mEq/L in phase B did not change pre-HD sodium values. Normal saline was administered in 10 of 92 treatments (11%) within the observation phase and 23 of 156 (15%) in phase B. One patient with noncirrhotic hepatitis C and a remote history of sigmoid adenocarcinoma requiring surgical resection received normal saline boluses with every treatment during both phases due to asymptomatic hypotension.
Table 2.
Plasma sodium concentration and outcomes
| Baseline (A) n = 13 | Intervention (B) n = 13 | Pa | |
|---|---|---|---|
| Dialysate Na+ (mEq/L) | 140 | 134.1 ± 3.4b | — |
| Na+ gradient (mEq/L)c | 3.9 ± 3.4 | −2.0 ± 0.3 | — |
| Pre-HD Na+ (mEq/L) | 135.5 ± 3.7 | 134.9 ± 3.9 | 0.3 |
| Post-HD Na+ (mEq/L) | 137.0 ± 3.1 | 134.3 ± 3.4 | 0.03 |
| Dry weight | 71.5 ± 13.8 | 72.3 ± 13.6 | 0.05 |
| IDWG (kg) | 2.4 ± 1.2 | 1.8 ± 0.7 | 0.005 |
| IDWC (%) | 3.4 ± 1.6 | 2.5 ± 1.0 | 0.003 |
| UFR (mL/h/kg) | 10.5 ± 4.3 | 8.0 ± 2.8 | 0.004 |
| Pre-HD Hood pressure | |||
| Systolic (mmHg) | 144.5 ± 31.4 | 143.6 ± 32.4 | 0.8 |
| Diastolic (mmHg) | 76.4 ± 15.8 | 78.0 ± 16.2 | 0.4 |
| MAP (mmHg) | 99.3 ± 20.6 | 100.1 ± 20.7 | 0.7 |
| Post-HD blood pressure | |||
| Systolic (mmHg) | 131.9 ± 22.8 | 132.1 ± 23.3 | 0.98 |
| Diastolic (mmHg) | 72.4 ± 11.6 | 73.1 ± 12.7 | 0.6 |
| MAP (mmHg) | 92.4 ± 14.9 | 92.9 ± 15.6 | 0.7 |
Values are expressed as mean ± SD.
P value reflects comparison by paired t-test between phases A and B.
Dialysate Na+ established at the beginning of intervention, not read-justed per monthly plasma Na+.
Na+ gradient = dialysate Na+ minus average plasma Na+.
HD = hemodialysis; IDWG = interdialytic weight gain; IDWG% = (IDWG/estimated dry weight) × 100; MAP = mean arterial pressure; UFR = ultrafiltration rate.
One patient received an extra HD session during phase A and during the tapering phase due to intradialytic nausea, resulting in early cessation of treatments and subsequent inability to reach dry weight. Compared with other patients, this individual had the highest Na+ gradient (+8 mEq/L) at baseline. There was one hospitalization for hyperkalemia, and three inpatient admissions for non–HD-related issues including gastrointestinal discomfort, pneumonia, and angioedema.
During this 10-week period, the dry weight increased modestly in 7 patients (range: 0.3–3.0 kg). Four of these patients had an initial increase in the dry weight during the tapering phase. The dry weight decreased in one patient by 1.2 kg in phase B. The mean increase in dry weight between phase A and the tapering phase was 0.2 kg vs. 0.5 kg between the lapering phase and phase B. Corrected for a change in dry weight, the average IDWG% in phase A was 3.4% and decreased to 2.5% in phase B (P = 0.003), a relative reduction of 26% (Figure 2). The IDWG% increased in two patients by 0.2% and 0.7%, respectively. The latter patient had a baseline plasma Na+ of 132 mEq/L, the lowest osmolar set point among this cohort. This individual also had multiple comorbidities including ulcerativc colitis necessitating a total proctocoicctomy with ileostomy and intermittent high volume diarrhea. Neither patient had a change in their dry weight. The average UFR in phase A was 10.5 mL/hour/kg (range: 2.4–17.3 mL/hour/kg) and decreased to 8.0 mL/hour/kg (range: 3.6–12.1 mL/hour/kg) in phase B (P = 0.004). There was no difference between pre- or post-HD systolic, diastolic or mean arterial pressure (MAP) between both phases.
Figure 2.

Interdialytic weight gain corrected for dry weight for each subject during phase A and phase B.
Comparing phase A with phase B, the proportion of treatments with hypotension without any interventions (62% vs. 65%) as well as hypotension requiring an intervention (29% vs. 33%) was not significantly different. In contrast, the proportion of treatments with patients experiencing cramps increased from 6% to 13%, although this difference did not reach statistical significance. A higher proportion of patients with diabetes experienced adverse events during phases A and B compared with those without diabetes (no inference tests were performed due to small numbers). While the majority of patients (n = 8.62%) did not experience any cramps during either phase, two individuals accounted for 76% of treatments with cramps. Details of all adverse events are summarized for each individual patient in Table 3 including patient characteristics. One patient (patient #1 in Table 3) experienced cramps during 2 of 7 (29%) treatments in phase A and 7 of 12 (58%) treatments in phase B. The other patient (patient #11 in Table 3) did not have cramps during the observation phase but had 9 of 12 treatments complicated by cramps when dialyzed with an individualized dialysate sodium prescription.
Table 3.
Individual patients with demographics and characteristics during both phases A and B including intradialytic adverse events
| Plasma scdium |
% of treatments with events |
||||||||||||||
|---|---|---|---|---|---|---|---|---|---|---|---|---|---|---|---|
| ID | Age | Gender | DM | Study phase | Dry weight (kg) | Dialysate Na+ (mEq/L) | Na+
gradient (mEq/L) |
IDWG (kg) | IDWG% | UFR (mL/h/kg) | Pre-HD (mEq/L) | Post-HD (mEq/L) | Cramps (%) | IDH (%) | IDH-I (%) |
| 1 | 56 | M | Yes | A | 72.0 | 140 | 5.0 | 3.4 | 4.7 | 14.9 | 137.7 | 139.0 | 28.6 | 100 | 42.9 |
| B | 74.4 | 133 | −2.0 | 2.6 | 3.6 | 11.9 | 137.0 | 134.8 | 58.3 | 100 | 58.3 | ||||
| 2 | 61 | M | Yes | A | 68.0 | 140 | 3.3 | 1.8 | 2.6 | 9.1 | 137.0 | 139.0 | 0 | 85.7 | 0 |
| B | 68.3 | 135 | −1.7 | 1.6 | 2.4 | 8.5 | 135.0 | 137.0 | 0 | 33.3 | 0 | ||||
| 3 | 34 | F | No | A | 51.0 | 140 | 1.7 | 2.2 | 4.3 | 13.9 | 138.7 | 138.0 | 0 | 14.3 | 0 |
| B | 51.8 | 136 | −2.3 | 1.3 | 2.5 | 8.5 | 139.8 | 134.3 | 0 | 41.7 | 8.3 | ||||
| 4 | 27 | M | No | A | 81.6 | 140 | 0.7 | 3.7 | 4.5 | 13.1 | 138.7 | 138.0 | 0 | 28.6 | 0 |
| B | 84.0 | 137 | −2.3 | 2.1 | 2.5 | 7.7 | 136.3 | 136.2 | 0 | 50.0 | 16.7 | ||||
| 5 | 84 | M | No | A | 71.5 | 140 | −0.7 | 1.7 | 2.4 | 6.6 | 141.1 | 141.0 | 0 | 42.9 | 0 |
| B | 71.5 | 139 | −1.7 | 1.5 | 2.1 | 6.5 | 139.8 | 136.5 | 0 | 58.3 | 0 | ||||
| 6 | 68 | F | Yes | A | 61.0 | 140 | 2.0 | 1.4 | 2.3 | 8.6 | 136.6 | 138.0 | 0 | 57.1 | 28.6 |
| B | 62.5 | 136 | −2.0 | 1.6 | 2.5 | 10.1 | 135.2 | 133.5 | 0 | 91.7 | 58.3 | ||||
| 7 | 72 | F | Yes | A | 93.0 | 140 | 1.0 | 2.0 | 2.1 | 7.6 | 136.4 | 137.0 | 28.6 | 100 | 85.7 |
| B | 91.8 | 137 | −2.0 | 0.9 | 1.0 | 3.8 | 137.2 | 137.8 | 8.3 | 58.3 | 25.0 | ||||
| 8 | 57 | M | No | A | 63.5 | 140 | 7.3 | 3.1 | 4.9 | 15.6 | 132.4 | 133.0 | 0 | 0 | 0 |
| B | 63.5 | 131 | −1.7 | 2.2 | 3.4 | 11.9 | 133.8 | 137.0 | 0 | 0 | 0 | ||||
| 9 | 53 | M | Yes | A | 63.0 | 140 | 8.3 | 3.6 | 5.8 | 17.3 | 131.0 | Not available | 12.5 | 100 | 75.0 |
| B | 66.0 | 130 | −1.7 | 2.9 | 4.5 | 12.1 | 131.2 | 130.2 | 8.3 | 100 | 100 | ||||
| 10 | 78 | M | Nc | A | 62.0 | 140 | 0.0 | 1.3 | 2.0 | 6.5 | 139.1 | 140.0 | 0 | 57.1 | 14.3 |
| B | 62.0 | 138 | −2.0 | 1.3 | 2.0 | 6.6 | 138.0 | 138.8 | 0 | 83.3 | 16.7 | ||||
| 11 | 70 | M | No | A | 62.0 | 140 | 7.0 | 2.6 | 4.2 | 11.3 | 130.0 | 131.0 | 0 | 85.7 | 42.9 |
| B | 62 0 | 131 | −2.0 | 1.6 | 2.6 | 7.0 | 132.2 | 128.8 | 75.0 | 75.0 | 66.7 | ||||
| 12 | 57 | M | Yes | A | 99.1 | 140 | 7.7 | 4.4 | 4.5 | 10.1 | 132.0 | 133.0 | 14.3 | 85.7 | 71.4 |
| B | 99.5 | 130 | −2.3 | 3.0 | 3.0 | 6.2 | 132.8 | 133.2 | 25.0 | 91.7 | 66.7 | ||||
| 13 | 84 | M | Yes | A | 82.0 | 140 | 8.0 | 0.3 | 0.3 | 2.4 | 131.3 | 137.0 | 0 | 28.6 | 14.3 |
| B | 82.0 | 130 | −2.0 | 0.9 | 1.0 | 3.6 | 125.8 | 128.3 | 0 | 41.7 | 8.3 | ||||
DM = diabetes mellitus; HD = hemcdialysis; IDH = intradialytic hypotension; IDWG = interdialytic weight gain; IDWG% = (IDWG/estimated dry weight) × 100; UFR = ultrafiltration rate
DISCUSSION
This case series explored the use of individualized dialysate Na+ prescriptions among patients on conventional, thrice-weekly in-center HD. We found that HD with an individualized dialysate, defined as dialyzing at a Na+ gradient of −2 mEq/L, resulted in a significant reduction in IDWG and IDWG% without a significant increase in the proportion of sessions complicated by IDH and cramps, the primary rationale for using higher dialysate Na+ prescriptions.
Excess sodium intake and volume overload contribute to ihe high morbidity and mortality among patients on HD. The role of dietary Na+ restriction to control hypertension and reduce cardiovascular damage has been described in detail in the general population, as well as in patients with chronic kidney disease18–20 However, a reduction in intradialytic Na+ balance is emerging as an alternative strategy for salt restriction.
Reasons for intradialylic Na+ loading are multifold: higher dialysate Na+ prescriptions (including “sodium modeling”), treatment of intradialytic symptoms with normal or hypertonic saline boluses, and saline used for priming and rinsing of the extracorporeal circuit.2,21 It has become standard practice to use high dialysate Na+ prescriptions to avoid dialysis disequilibrium syndrome, a constellation of adverse symptoms that result from rapid solute and fluid removal. However, any advantage of higher dialysate Na+ must be balanced by the consequences of net Na+ gain during dialysis.22
The optimal dialysate sodium prescription is unknown. In this case series, we described that dialysis with individualized dialysate prescriptions is a practical and feasible solution to minimize volume overload. The estimated Na+ gradient of −2 mEq/L, previously defined as “isonatremic or eunatremic,” was determined in a practical way for reproducibility by clinicians as proposed previously and described in detail in our prior quality improvement project in nocturnal HD patients.16 Patients with ESRD have varied Na+ intake due to regional and personal preferences as well as variations in residual kidney function: therefore, it is unrealistic to expect a single dialysate Na+ prescription to meet the needs of such a diverse patient population.5
We reported a reduction in the average IDWG% from 3.4% to 2.5% with an individualized dialysate prescription. This observation is in accordance with previous studies, showing that the use of an isonatremic dialysate prescription minimizes diffusive Na+ transport across the dialysis membrane, preserves intracellular tonicily,5 and reduces IDWG.4,23,24 The dry weight increased in some patients per clinical assessment by their nephrologist. This suggests that the patients' clinical dry weights may have been inappropriately low to begin with, necessitating an upward correction over the course of the study. One might also speculate that the intervention increased intradialytic complications, prompting an increase in target weight as a countermeasure. This change could have attenuated the effects of the decrease in sodium balance, thereby obscuring the full effect of the dialysate sodium intervention on intradialytic symptoms. Despite these promising results, only 5 of 13 patients in each phase were dialyzed below an IDWG% of 2.5%. This has been identified as an independent predictor of mortality.25–27 Over 75% of patients on conventional HD are dialyzed above their osmolar set point;3 in our small series, 8 of 13 were dialyzed with a sodium gradient ≥3 mEq/L at baseline. In other studies, HD with a similarly high Na+ gradient has been associated with higher mortality and hospitalizations7 partly due to fluid retention28 and subsequent adverse cardiovascular events.13 Despite the observed improvement in weight gain, significant improvements in volume and hypertension management are still needed to address the high hospitalization and mortality rates among patients on HD.
We also observed that patients with excess IDWG required high UFR. Ultrafiltration rates greater than 10 mL/hour/kg body weight are also associated with a higher mortality risk.25 This problem can be countered by reducing the IDWG and/or extending the session length; the former would not only afford patients more comfort during their HD session but would also help to avoid volume overload during the 44–68 or more hour interdialytic interval. The latter strategy should not be discounted, but cannot be a singular solution.
While the patient sample was quite small, our experience here suggests that the dialysate Na+ concentration can be lowered by several mEq/L without inducing major adverse symptoms. Given the data reported by Penne et al. (an increase in intradialytic symptoms when dialyzing against a relatively large sodium gradient),7 in conjunction with these preliminary findings, any change in dialysate sodium concentration should be implemented gradually (e.g., in 1–3mEq/L increments) rather than abruptly. Our results here have led us to rethink the “default” dialysate Na+ concentration for admission HD orders and to carefully consider the dialysate Na+ concentration, especially among patients with large IDWG. It is noteworthy that we did not detect a difference in SBP, DBP, or MAP in our patients despite a reduction in IDWG. A several week delay between normalization of extracellular volume and reduction of blood pressure may explain these findings.29,30 Any future, formal investigation in this area should include longer-term assessments, including careful determination of blood pressure.
There was no control group (patients who were followed longer-term on the dialysate Na+ concentration provided in phase A) and no control of co-interventions (including antihypertensive therapy or dietary sodium or other factors). On the other hand, we convinced ourselves that adopting a 30-year-old strategy (lower dialysate Na+ concentrations) was feasible and appeared to be safe, at least in the short term. Formally conducted clinical trials will be needed in order to determine the effect of lower dialysate Na+ concentrations relative to current standard (140 mEq/L) or other methods (“sodium modeling”) and other strategies that might be employed to temper IDWG and improve cardiovascular and noncardiovascular health in patients on HD. It is time that we reconsider the use of individualized dialysate Na+ prescriptions given the potential advantages suggested by this study and others. Screening for patients most likely to benefit from this approach may be a reasonable next step.15
Acknowledgments
Support and financial disclosure declaration: Dr. Schiller and Ms. Sun are employees of Satellite Healthcare. Dr. Chertow serves on the Scientific Advisory Board and the Board of Directors of Satellite Healthcare. Drs. Arramreddy and Munoz Mendoza were supported in part by the Satellite Hans Wolf Research fellowship award.
REFERENCES
- 1.Ok E, Mees EJ. Unpleasant truths about salt restriction. Semin Dial. 2010;23:1–3. doi: 10.1111/j.1525-139X.2009.00670.x. [DOI] [PubMed] [Google Scholar]
- 2.Penne EL, Levin NW, Kotanko P. Improving volume status by comprehensive dietary and dialytic sodium management in chronic hemodialysis patients. Blood Purif. 2010;30:71–78. doi: 10.1159/000317124. [DOI] [PubMed] [Google Scholar]
- 3.Santos SF, Peixoto AJ. Revisiting the dialysate sodium prescription as a tool for better blood pressure and Interdialytic weight gain management in hemodialysis patients. Clin J Am Soc Nephrol. 2008;3:522–530. doi: 10.2215/CJN.03360807. [DOI] [PMC free article] [PubMed] [Google Scholar]
- 4.de Paula FM, Peixoto AJ, Pinto LV, Dorigo D, Patricio PJ, Santos SF. Clinical consequences of an individualized dialysate sodium prescription in hemodialysis patients. Kidney Int. 2004;66:1232–1238. doi: 10.1111/j.1523-1755.2004.00876.x. [DOI] [PubMed] [Google Scholar]
- 5.Flanigan MJ. How should dialysis fluid be Individualized for the chronic hemodialysis patient? Sodium. Semin Dial. 2008;21:226–229. doi: 10.1111/j.1525-139X.2008.00428.x. [DOI] [PubMed] [Google Scholar]
- 6.Flanigan MJ. Role of sodium in hemodialysis. Kidney Int Suppl. 2000;76:S72–S78. doi: 10.1046/j.1523-1755.2000.07609.x. [DOI] [PubMed] [Google Scholar]
- 7.Penne EL, Sergeyeva O. Sodium gradient: A tool to individualize dialysate sodium prescription in chronic hemodialysis patients? Blood Purif. 2011;31:86–91. doi: 10.1159/000321851. [DOI] [PubMed] [Google Scholar]
- 8.Munoz Mendoza J, Sun S, Chertow GM, Moran J, Doss S, Schiller B. Dialysate sodium and sodium gradient in maintenance hemodialysis: A neglected sodium restriction approach? Nephrol Dial Transplant. 2011;26:1281–1287. doi: 10.1093/ndt/gfq807. [DOI] [PMC free article] [PubMed] [Google Scholar]
- 9.Peixoto AJ, Gowda N, Parikh CR, Santos SF. Long-term stability of serum sodium in hemodialysis patients. Blood Purif. 2010;29:264–267. doi: 10.1159/000274460. [DOI] [PubMed] [Google Scholar]
- 10.Tomson CR. Advising dialysis patients to restrict fluid intake without restricting sodium intake is not based on evidence and is a waste of time. Nephrol Dial Transplant. 2001;16:1538–1542. doi: 10.1093/ndt/16.8.1538. [DOI] [PubMed] [Google Scholar]
- 11.Keen ML, Gotch FA. The association of the sodium “set-point” to interdialytic weight gain and blood pressure in hemodialysis patients. Int J Artif Organs. 2007;30:971–979. doi: 10.1177/039139880703001105. [DOI] [PubMed] [Google Scholar]
- 12.Daugirdas JT, Al-Kudsi RR, Ing TS, Norusis Mj. A double-blind evaluation of sodium gradient hemodialysis. Am J Nephrol. 1985;5:163–168. doi: 10.1159/000166927. [DOI] [PubMed] [Google Scholar]
- 13.Kalantar-Zadeh K, Regidor DL, Kovesdy CP, et al. Fluid retention is associated with cardiovascular mortality in patients undergoing long-term hemodialysis. Circulation. 2009;119:671–679. doi: 10.1161/CIRCULATIONAHA.108.807362. [DOI] [PMC free article] [PubMed] [Google Scholar]
- 14.Levin NW, Zhu F, Keen M. Interdialytic weight gain and dry weight. Blood Purif. 2001;19:217–221. doi: 10.1159/000046944. [DOI] [PubMed] [Google Scholar]
- 15.Thein H, Haloob I, Marshall MR. Associations of a facility level decrease in dialysate sodium concentration with blood pressure and interdialytic weight gain. Nephrol Dial Transplant. 2007;22:2630–2639. doi: 10.1093/ndt/gfm220. [DOI] [PubMed] [Google Scholar]
- 16.Munoz Mendoza J, Bayes LY, Sun S, Doss S, Schiller B. Effect of lowering dialysate sodium concentration on interdialytic weight gain and blood pressure in patients undergoing thrice-weekly in-center nocturnal hemodialysis: A quality improvement study. Am J Kidney Dis. 2011;58:956–963. doi: 10.1053/j.ajkd.2011.06.030. [DOI] [PMC free article] [PubMed] [Google Scholar]
- 17.Flanigan M. Dialysate composition and hemodialysis hypertension. Semin Dial. 2004;17:279–283. doi: 10.1111/j.0894-0959.2004.17327.x. [DOI] [PubMed] [Google Scholar]
- 18.Cook NR, Cutler JA, Obarzanek E, et al. Long term effects of dietary sodium reduction on cardiovascular disease outcomes: Observational follow-up of the trials of hypertension prevention (TOHP) BMJ. 2007;334:885–888. doi: 10.1136/bmj.39147.604896.55. [DOI] [PMC free article] [PubMed] [Google Scholar]
- 19.He J, Ogden LG, Bazzano LA, Vupputuri S, Loria C, Whelton PK. Dietary sodium intake and incidence of congestive heart failure in overweight US men and women: First National Health and Nutrition Examination Survey Epidemiologic Follow-up Study. Arch Intern Med. 2002;162:1619–1624. doi: 10.1001/archinte.162.14.1619. [DOI] [PubMed] [Google Scholar]
- 20.Kayikcioglu M, Tumuklu M, Ozkahya M, et al. The benefit of salt restriction in the treatment of end-stage renal disease by haemodialysis. Nephrol Dial Transplant. 2009;24:956–962. doi: 10.1093/ndt/gfn599. [DOI] [PubMed] [Google Scholar]
- 21.Thijssen S, Raimann JG, Usvyat LA, Levin NW, Kotanko P. The evils of intradialytic sodium loading. Contrib Nephrol. 2011;171:84–91. doi: 10.1159/000327333. [DOI] [PubMed] [Google Scholar]
- 22.Phipps LM, Harris DC. Review: Modelling the dialysate. Nephrology (Carlton) 2010;15:393–398. doi: 10.1111/j.1440-1797.2010.01299.x. [DOI] [PubMed] [Google Scholar]
- 23.Manlucu J, Gallo K, Heidenheim PA, Lindsay RM. Lowering postdialysis plasma sodium (conductivity) to increase sodium removal in volume-expanded hemodialysis patients: A pilot study using a biofeedback software system. Am J Kidney Dis. 2010;56:69–76. doi: 10.1053/j.ajkd.2009.12.037. [DOI] [PubMed] [Google Scholar]
- 24.Lambie SH, Taal MW, Fluck RJ, Mclntyre CW. Online conductivity monitoring: Validation and usefulness in a clinical trial of reduced dialysate conductivity. ASAIO J. 2005;51:70–76. doi: 10.1097/01.mat.0000150525.96413.aw. [DOI] [PubMed] [Google Scholar]
- 25.Movilli E, Gaggia P, Zubani R, et al. Association between high ultrafiltration rates and mortality in uraemicpatientson regular haemodialysis. A 5-year prospective observational multicentre study. Nephrol Dial Transplant. 2007;22:3547–3552. doi: 10.1093/ndt/gfm466. [DOI] [PubMed] [Google Scholar]
- 26.Lindberg M, Prutz KG, Lindberg P, Wikstrom B. Interdialytic weight gain and ultrafiltration rate in hemodialysis: Lessons about fluid adherence from a national registry of clinical practice. Hemodial Int. 2009;13:181–188. doi: 10.1111/j.1542-4758.2009.00354.x. [DOI] [PubMed] [Google Scholar]
- 27.Saran R, Bragg-Gresham JL, Rayner HC, et al. Nonadherence in hemodialysis: Associations with mortality, hospitalization, and practice patterns in the DOPPS. Kidney Int. 2003;64:254–262. doi: 10.1046/j.1523-1755.2003.00064.x. [DOI] [PubMed] [Google Scholar]
- 28.Wizemann V, Wabel P, Chamney P, et al. The mortality risk of overhydration in haemodialysis patients. Nephrol Dial Transplant. 2009;24:1574–1579. doi: 10.1093/ndt/gfn707. [DOI] [PMC free article] [PubMed] [Google Scholar]
- 29.Twardowski ZJ. Sodium, hypertension, and an explanation of the “lag phenomenon” in hemodialysis patients. Hemodial Int. 2008;12:412–425. doi: 10.1111/j.1542-4758.2008.00304.x. [DOI] [PubMed] [Google Scholar]
- 30.Charra B, Bergstrom J, Scribner BH. Blood pressure control in dialysis patients: Importance of the lag phenomenon. Am J Kidney Dis. 1998;32:720–724. doi: 10.1016/s0272-6386(98)70147-7. [DOI] [PubMed] [Google Scholar]