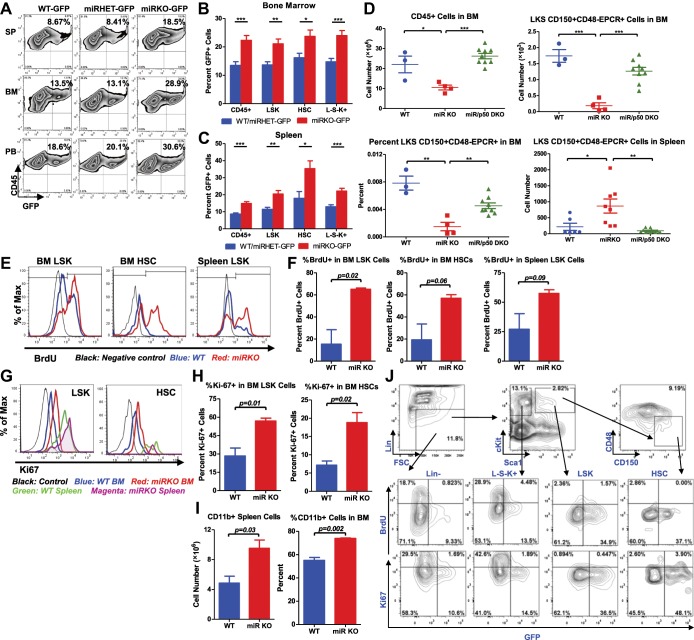
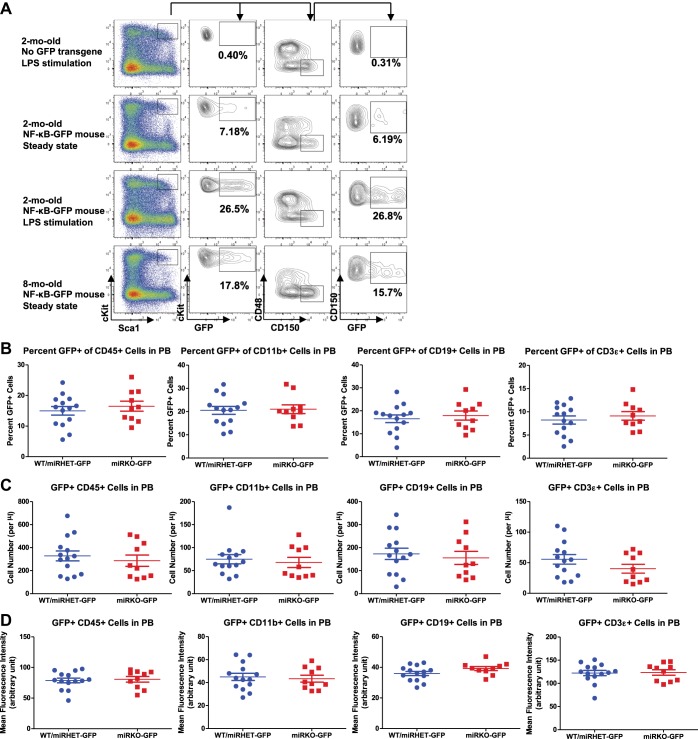
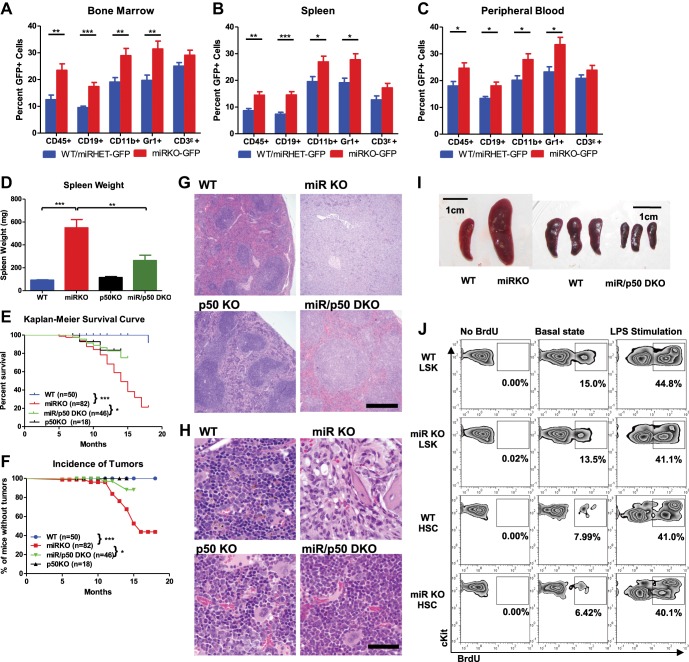
Figure 5. NF-κB regulates HSC homeostasis during chronic inflammation.
(A)–(C) 8-Week-old WT (WT-GFP), Mir146a+/− (miRHET-GFP), and Mir146a−/− (miRKO-GFP) NF-κB-GFP reporter mice were subjected to repeated intraperitoneal LPS stimulation (3 mg LPS/kg of body weight every other day) for 1 week. Percent of GFP+ cells in various lineages were quantified by FACS. (A) Representative FACS plots of GFP+ white blood cells (CD45+) in spleen (SP), bone marrow (BM), and peripheral blood (PB). Quantification of percent GFP+ cells of HSPCs in bone marrow (B) and spleen (C), including CD45+, LSK cells, HSCs (LSK CD150+CD48−) and L−S−K+ myeloid progenitor cells. (D) Age- and sex-matched WT, miR-146a KO (miR KO), and miR-146a/p50 double knockout (miR/p50 DKO) mice were allowed to age to 8–9 months before harvested for analysis. Quantification of total number of CD45+, LSK CD150+CD48−EPCR+ HSCs in BM, percent of LSK CD150+CD48−EPCR+ HSCs of total BM, and total number of LSK CD150+CD48−EPCR+ HSCs in spleen by FACS. (E)–(I) 8-Week-old WT and miR-146a KO (miR KO) mice were subjected to repeated low-dose of intraperitoneal LPS stimulation (1 mg LPS/kg of body weight) daily for 3 days. 1 mg of BrdU was injected intraperitoneally daily. BrdU+ and Ki-67+ HSPCs were quantified by FACS. (E) Representative FACS histograms of BrdU+ LSK cells and HSCs in BM and BrdU+ LSK cells in spleen. Blue: WT mice; red: miR KO mice. (F) Quantification of percent of BrdU+ cells in BM LSK cells, HSCs, and spleen LSK cells. (G) Representative FACS histograms of Ki-67+ LSK and HSCs in BM and spleen. Black: negative control; blue: WT BM; red: miR KO BM; green: WT spleen; magenta: miR KO spleen. (H) Quantification of Ki-67+ cells in BM LSK cells and HSCs. (I) Quantification of number and percent of CD11b+ myeloid cells in spleen and BM. (J) Representative FACS plots of BrdU+ or Ki-67+ and GFP+ cells of Lin−, L−S−K+, LSK and HSC in BM of 8-week-old WT-GFP mice stimulated with LPS (one dose, 1 mg/kg of body weight) for 4 hr.


