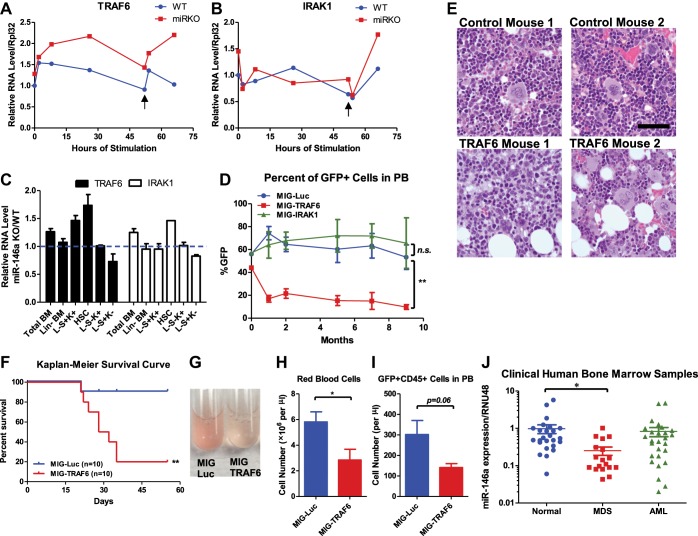
Figure 8. Derepression of TRAF6, a miR-146a target, is responsible for bone marrow failure.
Transcript levels of TRAF6 (A) and IRAK1 (B) in WT and miR-146a KO (miR KO) bone marrow–derived macrophages (BMMs) stimulated with LPS, which was added to the culture medium at 0 and 48 hr (black arrow). (C) Transcript levels of TRAF6 and IRAK1 in total BM, Lin− BM, and FACS-sorted LSK cells, LSK CD150+CD48− HSCs, L−K+S− cells, and L−K−S+ cells from 8-week-old WT and miR-146a KO mice. Fold change of miR-146a KO over WT cells was graphed. (D) and (E) BM HSPCs overexpressing luciferase (MIG-Luc), TRAF6 (MIG-TRAF6), or IRAK1 (MIG-IRAK1) were transplanted into lethally irradiated WT recipient mice. Transduction efficiency was about 50% in all groups as measured by FACS before transplantation. (D) Percent of GFP+ cells in transduced HSPCs before transplantation and in peripheral blood of reconstituted mice at month 1, 2, 5, 7, and 9 were analyzed by FACS. (E) Representative photographs of histological analysis (H&E stain) of femur bones of MIG-Luc control and MIG-TRAF6 mice harvested 9-month after transplantation. Scale bar, 40 μm. (F)–(I) BM HSPCs overexpressing luciferase (MIG-Luc) or TRAF6 (MIG-TRAF6) were transplanted into lethally irradiated WT recipient mice. Transduced HSPCs were sorted for GFP expression to ensure the transplanted HSPCs were 100% GFP+. (F) Kaplan–Meier survival curve of WT recipient mice reconstituted with BM HSPCs overexpressing luciferase (MIG-Luc) or TRAF6 (MIG-TRAF6). Peripheral blood (PB) analysis of MIG-Luc and MIG-TRAF6 mice at 1 month after transplantation. (G) Representative photograph of 1:1000 diluted PB in phosphate-buffered saline (PBS). Red blood cells in PB were counted with hemocytometer (H) and total number of GFP+CD45+ cells in PB (I) were measured by FACS. (J) Downregulation of miR-146a in human myelodysplastic syndromes (MDS) samples. Expression level of miR-146a in bone marrow samples from healthy donors (normal), MDS and acute myelogenous leukemia (AML) patients by Taqman RT-qPCR. RNU48 was used as the normalization gene.


