

Abstract
Aim:
Hyperhomocysteinemia and vitamins B6, B9, and B12 deficiencies usually result in various neurological, vascular, ocular, renal, and pulmonary abnormalities. However, to date, there are no simultaneous detection methods available for determining homocysteine, vitamins B6, B9, and B12 levels in various biological fluids. In this study, we aim to develop a new validated simultaneous detection method for all four compounds to save both cost and time of analysis.
Materials and Methods:
The mobile phase consisted of a mixture of methanol and 1-heptanesulfonic acid sodium salt (33:67) with 0.05% triethylamine. The pH of the entire mixture was adjusted to 2.3 and the flow rate was 0.5 mL/min. Separation was achieved using a C-18 column (5 μm; 150 mm × 4.6 mm) maintained at 28°C in a column oven and the detection was conducted at 210 nm.
Results:
The method was linear between 50 and 1600 ng/mL for all of the drugs. The limits of detection for homocysteine, vitamins B6, B9, and B12 were 5, 5, 10, and 10 ng/mL, respectively, while the limits of quantification were 10, 10, 25, and 25 ng/L, respectively. The developed method achieved good precision and accuracy and complies with the Food and Drug Administration (FDA) requirements.
Conclusion:
The developed and validated method is suitable to be used for the routine analysis of homocysteine, vitamins B6, B9, and B12 simultaneously in human serum.
KEY WORDS: Homocysteine, high performance liquid chromatography, simultaneous detection, vitamin B6, vitamin B9, vitamin B12
Introduction
Homocysteine is an amino acid that does not exist in the natural human diet but is an essential part of methionine metabolism.[1] It is produced as a result of methylation reactions.[2] Other metabolic functions of homocysteine include being a component of choline metabolism, recycling of tissue folates and serving as a precursor for cystathionine, cysteine, and other metabolites.[3] An increased concentration of homocysteine in the blood (hyperhomocysteinemia) can be caused by both endogenous and exogenous factors. The most significant exogenous factors are related to the composition of diets, such as folate deficiencies.[4]
Higher levels of homocysteine have been associated with many pathological conditions including vascular,[5] neurological,[6] ocular,[7] renal,[8] pulmonary,[9] and skeletal muscle abnormalities.[10] The main enzymes involved in the metabolism of homocysteine require the presence of cofactors, such as vitamins B6 and B12. Vitamin B6, vitamin B9 (also known as folic acid), and vitamin B12 deficiencies are also associated with elevated levels of homocysteine in various pathological conditions.[6,11] Therefore, it is important that the levels of these B vitamins are measured together with homocysteine[12] to provide a better representation of diseases.
Healthy subjects are reported to have plasma levels of vitamin B6, vitamin B9, and vitamin B12 at 7.4 ng/mL,[13] 2.7 - 17.0 ng/mL[14] and 200 - 900 pg/mL,[15] respectively. A deficiency occurs when the levels are less than 5 ng/mL,[13] 2.7 ng/mL,[14] and 200 pg/mL[15] for vitamins B6, B9, and B12, respectively. For homocysteine, the level in healthy subjects is less than 2700 ng/mL and the upper limit of 2027 - 3379 ng/mL is considered to be hyperhomocysteinemia.[16] The main challenge in developing methods for characterizing these compounds results from their low concentrations in plasma, especially with vitamins B6 and B12, thus making methods with good sensitivities a very important prerequisite.
Because of the inherent co-existence of vitamin deficiencies in many pathological conditions[6,11] the simultaneous detection of vitamins B6, B9, B12, and homocysteine becomes highly important. To date, all of the available methods have reported individual determinations of these compounds.[17,18] For example, various chromatographic methods have been developed for the individual quantification of vitamins B6, B9, B12, and homocysteine using ultraviolet (UV), fluorescence, and mass spectrometer detectors.[19,20] Two additional chromatographic methods were developed for either vitamins B6, B9, and B12 along with other B vitamins.[21] Previous studies have reported homocysteine and vitamin B6 measurements using a fluorescence detector, whereas vitamin B9 was measured either by using a radioimmunoassay[22] or a chemiluminescent enzyme immunoassay,[17] which can be hazardous to the health of the operator and tedious to conduct. To our knowledge, there was no method capable of simultaneously detecting all three types of vitamins, or even four compounds, using a single detector.
The objective of this study was to develop and validate a new rapid High Performance Liquid Chromatography (HPLC) method that allows the simultaneous detection of homocysteine, vitamins B6, B9, and B12 in human serum for routine analysis, which can lead to a substantial time and cost savings.
Materials and Methods
Chemicals and Reagents
Homocysteine [Figure 1a] and heptane-1-sulfonic acid sodium salt were purchased from Merck (Darmstadt, Germany). Vitamin B6 [Figure 1b] and vitamin B9 [Figure 1c] were purchased from Sigma-Aldrich, Co. (USA). Vitamin B12 [Figure 1d] was purchased from EMD Biosciences, Inc (USA). The internal standard (chlorogenic acid) [Figure 1e] was purchased from Sigma-Aldrich, Co. (USA). The organic solvents (methanol and acetonitrile) were of HPLC grade and were purchased from Merck (Darmstadt, Germany). Twice distilled deionized water was freshly prepared using a Milli-Q Q-Pod (Millipore, Billerica, MA).
Figure 1.
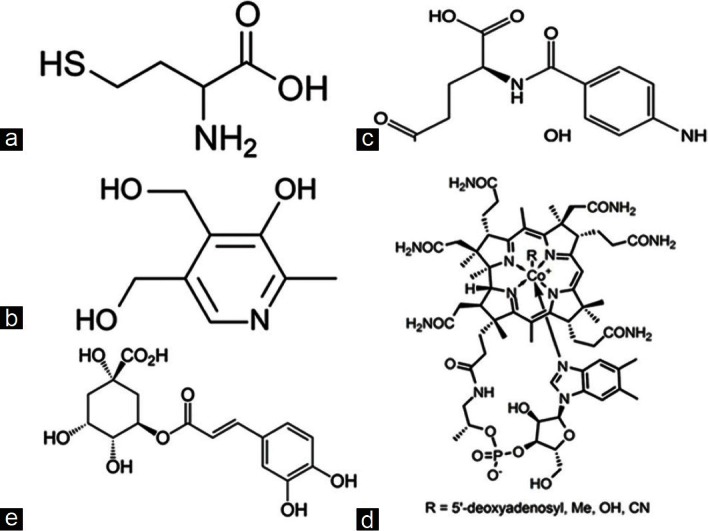
(a) Structure of homocysteine, (b) structure of vitamin B6, (c) structure of folic acid, (d) structure of vitamin B12, and (e) structure of chlorogenic acid
Instrumentation
The HPLC system consisted of an Agilent 1200 series G1379B micro-vacuum degasser linked to a G1312B binary pump SL with a seal wash option, coupled with a G1367D high performance auto sampler SL that was fitted with a 100 μL sample loop and a G1316B thermostated column compartment for the Agilent 1200 series high performance autosampler SL. This system was connected to a G1315C diode-array and a multiple wavelength detector SL. The analytical column was a LiChrocart (150 × 4.5 mm I.D., 5 μm) HPLC cartridge coupled with a Purospher Star RP-18 endcapped column (5 μm) from Merck, Darmstadt, Germany. The control of the HPLC system and data collection were performed using a HP-compatible computer equipped with LC Chemostation software (version B.04.01, Waldbronn, Germany).
All of the solvents were filtered under vacuum before use with a polytetrafluoroethylene (PTFE) membrane filter (0.22 μm) and were prepared fresh daily.
Preparation of Stock and Working Standard Solutions
Stock solutions of homocysteine, vitamins B6, B9, and B12 (100 μg/mL) were prepared by dissolving 1 mg of each compound in 10 mL of filtered deionized water (Millipore, Germany), followed by storage at 4°C. The working stock solutions (8 μg/mL) were individually prepared by diluting 400 μl of the stock solutions to 5 mL with filtered deionized water followed by storage at 4°C. All of the stock solutions of vitamins B9 and B12 were wrapped with aluminum foil to prevent degradation from light. Using the working stock solutions, the standards were freshly prepared daily at 50, 100, 200, 400, 800, and 1600 ng/mL.
For the internal standard, a stock solution of chlorogenic acid (100 μg/mL) was prepared by dissolving 1 mg of the powder into 10 mL of deionized water. A working standard solution (500 ng/mL) was freshly prepared daily from the internal stock solution using deionized water.
Method Development and Optimization
Determination of the suitable UV wavelength
Each compound (1 μg/mL) was injected into the rapid resolution liquid chromatography (RRLC) system and the absorbance measured using a photo diode array (PDA) detector between 190 and 400 nm. The initial HPLC system condition was running on a mobile phase consisting of 1-heptanesulfonic acid sodium salt (5 mM):Methanol (75:25) with 0.1% triethylamine (TEA) and the pH of the final mixture was adjusted to 2.8.
Determination of the suitable mobile phase pH
Five pH values (pH 2.0, 2.3, 2.8, 4.0, and 6.0) were selected based on the pKas of the tested drugs. The tested pH values were within the range recommended by the supplier to be suitable for the column. The pH was adjusted using 85% orthophosphoric acid or sodium hydroxide (1 M).
Determining the suitability of adding an organic modifier
The effects of adding an organic modifier, such as TEA, on the peak shape were investigated at different concentrations (0.05, 0.07, 0.10, 0.50, 0.75, and 1.00%).
Determining the suitable buffer type and its concentration
Two types of buffers 1-heptanesulfonic acid sodium salt and potassium dihydrogen sulfate (KH2PO4)] were investigated to determine the most suitable buffer type. The mobile phase was prepared fresh daily by dissolving the buffer salt in twice distilled deionized water. TEA (0.1%) was added and the pH was adjusted to 2.8 before filtering through the PTFE membrane filter (0.22 μm). In this experiment, different concentrations of buffers, such as heptane sulfonic sodium salt at 0.05 and 5.00 mM and KH2PO4 at 0.10 M, were tested.
Determining the suitable organic solvent and its percentage
The suitability of two different organic solvents (methanol and acetonitrile) were examined for the present study at four different combinations (70:30, 75:25, 67:33, 65:35, 63:37, 60:40) of organic solvent:Buffer.
Determining the suitable mobile phase flow rate
Four mobile phase flow rates (0.1, 0.2, 0.3, and 0.5 mL/ min) were used to determine the best flow rate for producing good peak shapes and areas.
Determining the suitable injection volume
Different injection volumes (20 and 40 μl) were also investigated to determine their effects on the chromatographic peaks.
Results and Discussion
Method Optimization
Optimization of the most suitable UV wavelength
All compounds had two observable maximum wavelengths in the spectra obtained from the PDA scanning measurements. Vitamin B6 absorbed at 210 and 290 nm [Figure 2] and vitamin B9 absorbed at 200 and 290 nm [Figure 2]. The maximum absorbance for vitamin B12 occurred at 210 and 360 nm [Figure 2], whereas the maximum absorbance for homocysteine occurred at 210 and 260 nm [Figure 2].
Figure 2.
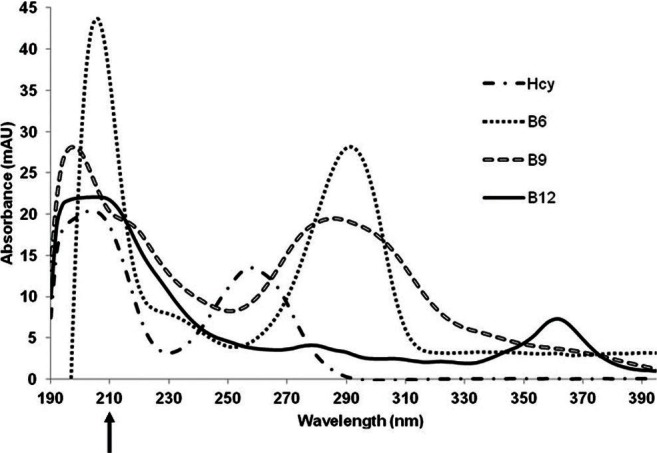
UV spectra of homocysteine (1 μg/ml), vitamin B6 (1 μg/ ml), folic acid (1 μg/ml), and vitamin B12 (1 μg/ml) obtained using a photodiode array (PDA) detector
Optimization of buffer type and its concentration
Two different types of buffers (KH2PO4 and 1-heptanesulfonic acid sodium salt) were tested. When KH2PO4 was used, homocysteine and vitamin B6 co-eluted; however, the co-elution did not occur when 1-heptanesulfonic acid sodium salt was used and all four compounds were eluted with good separation.
Optimization of the mobile phase pH
Several mobile phase pHs (2.0, 2.3, 2.8, 4.0, and 6.0) were tested with the wavelength was set to 210 nm, as determined above and 1-heptanesulfonic acid sodium salt at a concentration of 0.05 M.
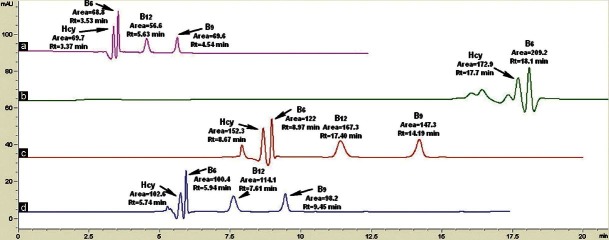
In the beginning of the method development, only the mobile phase pH for vitamins B6, B9, and B12 were optimized because of their similar pKa values. Following this optimization, homocysteine was added for further optimization. At pH 2.0 [Figure 3a], the vitamins B6 and B9 peaks were well separated. However, the vitamin B12 peak was delayed and presented gross peak broadening and a reduced peak height. At pH 2.8 [Figure 3b], there was good resolution for all three drugs. At pH 4.0 [Figure 3c], noise and negative peaks were observed between 3-4 min and 9-10 min. At pH 6.0 [Figure 3d], the area of vitamin B6 is halved. Furthermore, not only was the vitamin B9 peak eluted much faster when compared to the other compounds, it also co-eluted with the solvent front and the vitamin B12 peak was broadened. However, when homocysteine was injected at this pH, it was co-eluted with vitamin B6 [Figure 3d]. Therefore, the pH was decreased to 2.3 [Figure 3e], which resulted in the separation of all four compounds with good resolutions, peak shapes, and areas.
Figure 3.

The effect of varying the buffer pHs to (a) 2.0 (b) 2.8 (c) 4.0 (d) 6.0 (e) 2.3 (four compounds), the mobile phase used was 25:75 MeOH:Heptanesulfonic sodium salt (0.05 mM) with 0.1% TEA, running at 0.5 ml/min; (e) 2.3, the mobile phase used was 35:65 MeOH:Heptanesulfonic sodium salt (0.05 mM) with 0.05% TEA, running at 0.5 ml/min. The detection was done at 210 nm
Optimization of the type of organic modifier and its concentration
In this experiment, TEA was added at different concentrations [0.05%, 0.07%, 0.10%, 0.50%, 0.75%, and 1.00% (v/v)] to the mobile phase to investigate its effects on the peak shape. However, the addition of TEA increased the pH of the mobile phase to above 6.0, which then needed to be readjusted to pH 2.3. At low concentrations, 0.05% [Figure 4a], 0.07% [Figure 4b], and 0.10% [Figure 4c], the addition of TEA improved the peak shapes and also decreased the noise. The retention time and areas are similar when the percentage of TEA was increased to 0.75% [Figure 4d]. However, the vitamin B6 peak co-eluted with the negative peak at 3.7 min [Figure 4d]. When the concentration of TEA was increased to 1.00% [Figure 4e], the vitamin B6 peak split and the vitamin B9 peak was broadened, even though the vitamin B12 peak remained unchanged. When TEA was added at 0.50% [Figure 4f], vitamin B6 co-eluted with the negative peak at 3.8 min and there were good elutions of vitamins B6 and B12.
Figure 4.

The effects of adding different concentrations of organic modifier:TEA (a) 0.05% TEA, (b) 0.07% TEA, (c) 0.1% TEA, (d) 0.75% TEA, (e) 1% TEA, and (f) 0.5%. The mobile used was 25:75 MeOH:Heptanesulfonic sodium salt (0.05 mM) pH 2.8, running at 0.5 ml/min. The detection was done at 210 nm
Optimization of the percentage organic solvent
In this experiment, acetonitrile (ACN) was also investigated [Figure 5i]. However, vitamin B9 was not eluted when ACN was used. For this test, six percentages of MeOH were tested: 25%, 30%, 33%, 35%, 37%, and 40%. When MeOH was used, all examined percentages of the organic solvents provided adequate separation, except for 25% MeOH [Figure 5ii] where the vitamin B9 peak did not appear. When 30%, 33% or 35% MeOH compositions were used [Figure 5ii], all four compounds eluted with good resolution, peak area and peak shape. For 37% MeOH [Figure 5ii], the resolution between vitamins B6 and B12 was poor. The peak shapes of all four compounds were poor when 40% MeOH [Figure 5ii] was used as the organic solvent.
Figure 5.

(i) The effect of using ACN as organic solvent in mobile phase. (ii) The effects of varying the percentage of organic solvent: (a) 37% MeOH (b) 33% MeOH (c) 30% MeOH (d) 25% MeOH (e) 40% MeOH (f) 35% MeOH. The mobile phase used was 0.05 mM heptanesulfonic sodium salt with 0.05% TEA, pH 2.3, running at 0.3 ml/min. The detection was done at 210 nm
Optimization of suitable flow rate
For determining the optimal flow rate, four flow rates (0.1, 0.2, 0.3, and 0.5 mL/min) were tested. For the flow rate of 0.5 mL/min [Figure 6a], the total elution time was 5.63 min with high area counts. For the flow rate of 0.1 ml/min [Figure 6b], two compounds (B9 and B12) were not eluted. For the flow rate of 0.2 ml/min [Figure 6c], the total analytical time increased (14.19 min) and for the flow rate of 0.3 ml/min [Figure 6d], the total elution time was also long at 9.45 minutes.
Figure 6.
The effects of varying the flow rates: (a) 0.5 ml/min (b) 0.1 ml/min (c) 0.2 ml/min, (d) 0.3 ml/min. The mobile phase used was 33:67 MeOH:Heptanesulfonic sodium salt (0.05mM) with 0.05% TEA, pH 2.3. The detection was done at 210 nm
Optimization of injection volumes
From the chromatograms, the area count increases with an injection volume of 40 μl [Figure 7a]; however, with an injection volume of 20 μl [Figure 7b], the resolutions of homocysteine and vitamin B6 were not good.
Figure 7.
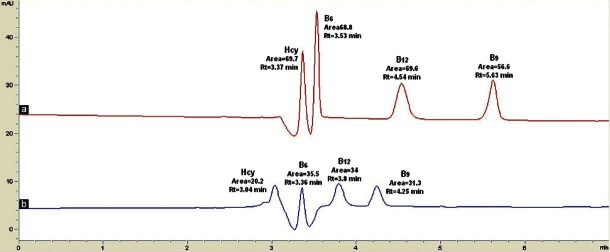
The effects of varying the injection volume (a) 40 μl (b) 20 μl. The mobile phase used was 33:67 MeOH:Heptanesulfonic sodium salt (0.05mM) with 0.05% TEA, pH 2.3, running at 0.5 ml/min. The detection was done at 210 nm
System suitability parameters
The system suitability parameters of the current method were within those recommended by the Food and Drug Administration (FDA).[23] The resolutions of homocysteine, vitamins B6, B9, and B12 were 1.7, 1.7, 5.1, and 2.4, respectively, and the tailing factors were 0.5, 0.5, 0.7, and 0.7, respectively. A plate count of more than 2,000 is recommended by the FDA for analytical methods; in our method, the plate counts for homocysteine, vitamins B6, B9, and B12 were 40,392, 2,959, and 4,624, respectively, which fulfilled the requirements of the FDA.
The final optimized parameters
It is concluded that the best RRLC parameters with good resolution for the simultaneous detection of homocysteine, vitamins B6, B9, and B12 with chlorogenic acid as the internal standard was at 210 nm by using 33:67 MeOH:Heptanesulfonic sodium salt (0.05 mM) with 0.05% TEA added as the organic modifier and the buffer pH adjusted to 2.3 [Figure 8]. The flow rate was 0.5 mL/min and the injection volume was 40 μl. Using these conditions, the retention times of homocysteine, vitamins B6, B9, and B12 and internal standard (chlorogenic acid) were 3.45 min, 3.62 min, 4.79 min, 6.01 min, and 7.05 min, respectively [Figure 8].
Figure 8.
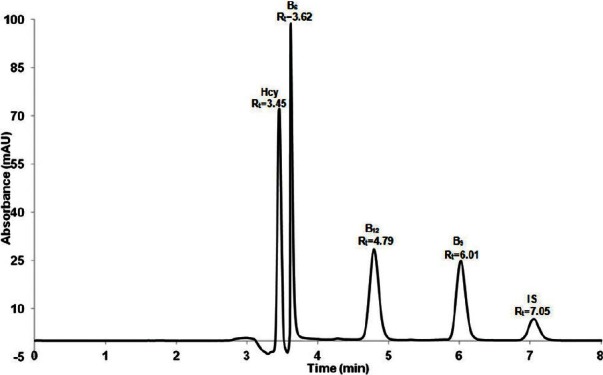
Representative of chromatograms after final optimization results
Concentration Ranges and Calibration Graphs
Using the optimized experimental conditions, the linearity of the method (corrected peak area ratio of the drugs to the internal standards versus concentrations) was evaluated in triplicate over a concentration range between 50 and 1,600 ng/mL. The slopes, intercepts and correlation coefficients obtained by the linear least squares regression analysis of the results are also provided [Figure 9]. The linearity of the calibration graph was demonstrated by the good determination coefficient (r2) obtained for the regression line.
Figure 9.
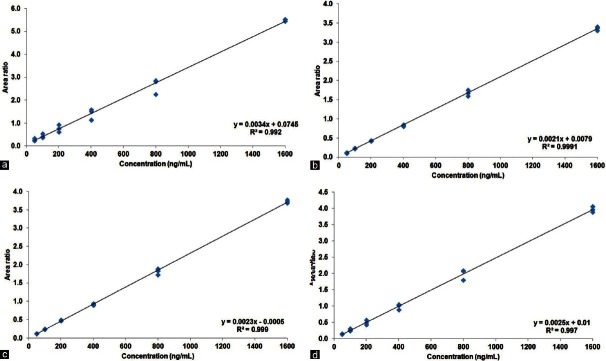
Linearity curve obtained from calibration graph based on area ratio of standard drug (a) vitamin B6 (b) folic acid (c) vitamin B12, and (d) homocysteine
Limit of Detection and Quantification
The limit of detection (LOD) is defined as the smallest quantity of compound that is clearly distinguishable from the baseline, which has a signal ratio of 3:1.[24] The LOD was 5 ng/mL for both homocysteine and vitamin B6, whereas for vitamins B9 and B12 the LOD was 10 ng/mL. The limits of quantification (LOQ), defined as the ratio considered, was 10:1 with a relative standard deviation (RSD) of less than 10%.[24] The LOQ was 10 ng/mL for both homocysteine and vitamin B6 and 25 ng/mL for both vitamins B9 and B12.
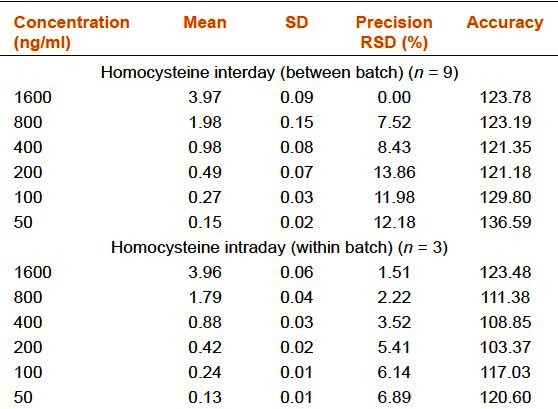
Precision and Accuracy
Inter and intraday run precisions were calculated three times from the injections for six concentrations (50, 100, 200, 400, 800, and 1,600 ng/mL). The mean values, standard deviations (SD), precisions and accuracies complied with the FDA's requirement [Table 1a–d].
Table 1a.
Precision and accuracy of the rapid resolution liquid chromatography method for vitamin B6
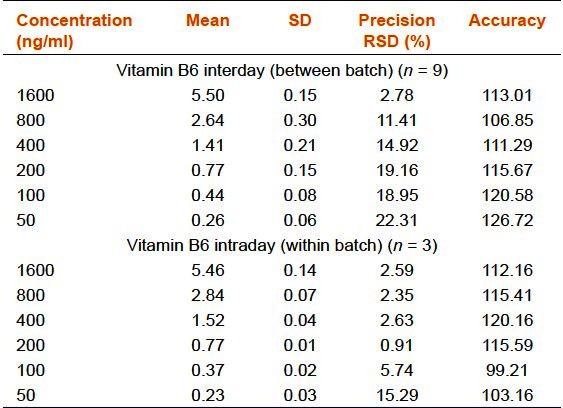
Table 1b.
Precision and accuracy of the rapid resolution liquid chromatography method for folic acid (vitamin B9)
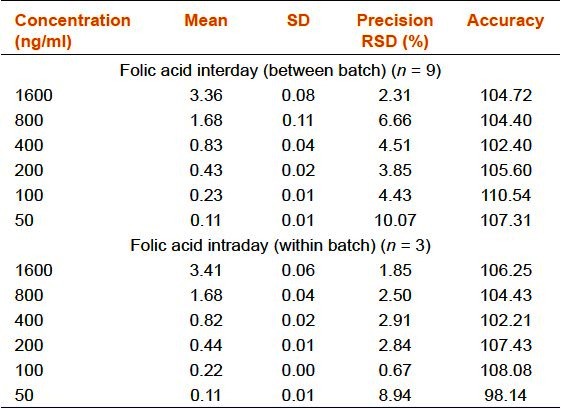
Table 1c.
Precision and accuracy of the rapid resolution liquid chromatography method for vitamin B12
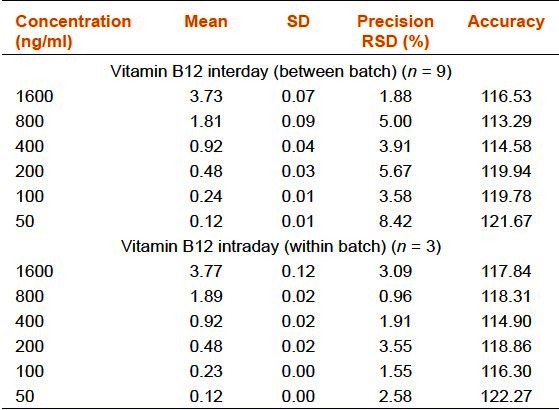
Table 1d.
Precision and accuracy of the rapid resolution liquid chromatography method for homocysteine
Discussion
Method Optimization
Based on the results, 210 nm was selected as the best wavelength for the simultaneous detection of vitamin B6, B9, B12, and homocysteine. 1-Heptanesulfonic acid sodium salt was selected as the buffer of choice as it eluted all the four compounds. The peak resolutions were better and the retention time was shorter when a concentration of 0.05 mM was used. Because high buffer salt concentrations may not be friendly to the column and may clog the column, especially if the column is not properly flushed after prolonged use, 0.05 mM was selected.
The acid dissociation constant (pKa) of homocysteine (2.20, 8.87, 10.86),[25] vitamin B6 (5.00),[26] vitamin B9 (4.70),[27] and vitamin B12 (7.50)[28] play an important role in the selection of pH; according to Henderson-Hasselbach equation,[24] drugs with lower pKa values elute faster, whereas drugs with higher pKa values tend to elute slower at lower pH because higher ionization tends to occur at lower pH. Keeping all of the above parameters and also comparing the retention times, peak heights and areas produced by different pHs, pH 2.8 was selected as the most suitable pH for the simultaneous determination of all three vitamins. However, when homocysteine was injected at this pH, it was co-eluted with vitamin B6. Therefore, the pH was decreased to 2.3, which resulted in the separation of all four compounds with good resolutions, peak shapes and areas [Figure 3e].
In addition to the partitioning behavior observed for the reversed-phase analyses, secondary interactions between an analyte and the column may cause peak tailing. The most common type of interaction is an ion exchange interaction between a positively charged basic compound and the silanols on the column surface, which are negatively charged. Because vitamins B6, B9, and B12 are acidic, the addition of a basic organic modifier to the mobile phase may eliminate problems,[24] which results in a better peak shape. Amines such as TEA in concentrations of 10-50 mM are reported to be effective in blocking the silanol groups that may cause secondary retention.[24] Because TEA is carcinogenic and extremely difficult to flush from the column,[29] the lowest concentration of TEA (0.05%) was selected as the best concentration.
The goal of optimizing the percentage of organic solvent is to obtain adequate separation of all compounds while allowing the elution of all strongly retaining compounds. Generally, the appropriate retention (k) range of 1 < k < 10 is preferred.[24] In this experiment, initially ACN was used because it gives a lower operating pressure and higher solvent strength compared to MeOH.[24] Furthermore, ACN has the advantages of having lower viscosities, which results in higher plate numbers, and having a lower UV cut-off of 185-210 nm, which leads to less baseline noise.[24] However, vitamin B9 was not eluted when ACN was used [Figure 5i]. When 30%, 33% or 35% MeOH compositions were used, all four compounds eluted with good resolution, peak area and peak shape but this is not true for 40% MeOH. Lower percentages of organic solvent, such as 33% MeOH, can result in long-term cost savings, this composition was selected.
From the chromatograms, the lowest flow rate yielded the biggest area counts, but with an increased total analytical time. Because 0.5 mL/min resulted in shorter analytical times without significant compensation on the area counts, this flow rate was selected. It was recommended that appropriate injections should not be greater than 10% of the loop volume.[30] If a larger mass of sample is introduced, it may overload the column, resulting in sample peak broadening. The loop volume for the RRLC is 1,500 μl. Based on this result, an injection volume of 40 μl was selected.
Validation
Based upon the results, the final optimized parameters were selected [Figure 8] since the accuracy and precision of the calibration graphs complied with the FDA guidelines.[23] The linearity of the calibration graph for all the compounds was demonstrated by the good determination coefficient (r2) obtained for the regression line.
Limitations of the Method
The sensitivity of the method especially for the detection of vitamins B6 and B12 needs to be increased further since plasma levels of these vitamins in healthy subjects are generally lower than the LOQ. Therefore, extraction should be done from higher amounts (1 mL) of plasma to achieve higher sensitivities.
Conclusions
The proposed HPLC method can be routinely applied for the simultaneous determination of homocysteine and vitamins B6, B9, and B12 from human serum. The proposed method is specific and demonstrated good linearity, accuracy and precision, and complies with the FDA requirements.
Acknowledgments
This study was supported by Research University Grant (1001/PPSP/815094), Universiti Sains Malaysia.
Footnotes
Source of Support: Research University Grant (1001/PPSP/815094), Universiti Sains Malaysia
Conflict of Interest: None declared
References
- 1.Finkelstein JD, Martin JJ. Homocysteine. Int J Biochem Cell Biol. 2000;32:385–9. doi: 10.1016/s1357-2725(99)00138-7. [DOI] [PubMed] [Google Scholar]
- 2.Brosnan JT, Jacobs RL, Stead LM, Brosnan ME. Methylation demand: A key determinant of homocysteine metabolism. Acta Biochim Pol. 2004;51:405–13. [PubMed] [Google Scholar]
- 3.Finkelstein JD. Methionine metabolism in mammals. J Nutr Biochem. 1990;1:228–37. doi: 10.1016/0955-2863(90)90070-2. [DOI] [PubMed] [Google Scholar]
- 4.Selhub J, Jacques PF, Rosenberg IH, Rogers G, Bowman BA, Gunter EW, et al. Serum total homocysteine concentrations in the third National Health and Nutrition Examination Survey (1991-1994): Population reference ranges and contribution of vitamin status to high serum concentrations. Ann Intern Med. 1999;131:331–9. doi: 10.7326/0003-4819-131-5-199909070-00003. [DOI] [PubMed] [Google Scholar]
- 5.Vyssoulis G, Karpanou E, Kyvelou SM, Adamopoulos D, Gialernios T, Gymnopoulou E, et al. Associations between plasma homocysteine levels, aortic stiffness and wave reflection in patients with arterial hypertension, isolated office hypertension and normotensive controls. J Hum Hypertens. 2010;24:183–9. doi: 10.1038/jhh.2009.50. [DOI] [PMC free article] [PubMed] [Google Scholar]
- 6.Nilforooshan R, Broadbent D, Weaving G, Gurton J, Moore V, Houston L, et al. Homocysteine in Alzheimer's disease: Role of dietary folate, vitamin B6 and B12. Int J Geriatr Psychiatry. 2011;26:876–7. doi: 10.1002/gps.2666. [DOI] [PubMed] [Google Scholar]
- 7.Xu F, Zhang L, Li M. Plasma homocysteine, serum folic acid, serum vitamin B12, serum vitamin B6, MTHFR and risk of pseudoexfoliation glaucoma: A meta-analysis. Graefes Arch Clin Exp Ophthalmol. 2012;250:1067–74. doi: 10.1007/s00417-011-1877-4. [DOI] [PubMed] [Google Scholar]
- 8.Ferechide D, Radulescu D. Hyperhomocysteinemia in renal diseases. J Med Life. 2009;2:53–9. [PMC free article] [PubMed] [Google Scholar]
- 9.Fimognari FL, Loffredo L, Di Simone S, Sampietro F, Pastorelli R, Monaldo M, et al. Hyperhomocysteinaemia and poor vitamin B status in chronic obstructive pulmonary disease. Nutr Metab Cardiovasc Dis. 2009;19:654–9. doi: 10.1016/j.numecd.2008.12.006. [DOI] [PubMed] [Google Scholar]
- 10.Tinazzi I, Caramaschi P, Patuzzo G, Bambara LM, Biasi D. Homocysteine and rheumatic disease. Recenti Prog Med. 2007;98:646–52. [PubMed] [Google Scholar]
- 11.Kummer A, Harsányi E. Comments on “Vitamin supplementation reduces the level of homocysteine in the urine of autistic children”. Nutr Res. 2011;31:873. doi: 10.1016/j.nutres.2011.09.019. [DOI] [PubMed] [Google Scholar]
- 12.Moriyama Y, Okamura T, Kajinami K, Iso H, Inazu A, Kawashiri M, et al. Effects of serum B vitamins on elevated plasma homocysteine levels associated with the mutation of methylenetetrahydrofolate reductase gene in Japanese. Atherosclerosis. 2002;164:321–8. doi: 10.1016/s0021-9150(02)00105-3. [DOI] [PubMed] [Google Scholar]
- 13.Tietz NW. 3rd ed. Philadelphia: W.B. Saunders; 1995. Clinical Guide to Laboratory Tests. [Google Scholar]
- 14.Evert A, Zieve D. Folic acid test. 2011. [Last accessed on 2012 Oct 17]. Available from: http://www.nlm.nih.gov/medlineplus/ency/article/003686.htm .
- 15.Vorvick LJ, Mason JR. Vitamin B12 level. 2010. [Last accessed on 2012 Oct 17]. Available from: http://www.nlm.nih.gov/medlineplus/ency/article/003705.htm .
- 16.Jacobsen DW. Homocysteine and vitamins in cardiovascular disease. Clin Chem. 1998;44:1833–43. [PubMed] [Google Scholar]
- 17.Turgut B, Kaya M, Arslan S, Demir T, Güler M, Kaya MK. Levels of circulating homocysteine, vitamin B6, vitamin B12, and folate in different types of openangle glaucoma. Clin Interv Aging. 2010;5:133–9. doi: 10.2147/cia.s9918. [DOI] [PMC free article] [PubMed] [Google Scholar]
- 18.Sturtzel B, Dietrich A, Wagner KH, Gisinger C, Elmadfa I. The status of vitamins B6, B12, folate, and of homocysteine in geriatric home residents receiving laxatives or dietary fiber. J Nutr Health Aging. 2010;14:219–23. doi: 10.1007/s12603-010-0053-6. [DOI] [PubMed] [Google Scholar]
- 19.Lamers Y. Indicators and methods for folate, vitamin B-12, and vitamin B-6 status assessment in humans. Curr Opin Clin Nutr Metab Care. 2011;14:445–54. doi: 10.1097/MCO.0b013e328349f9a7. [DOI] [PubMed] [Google Scholar]
- 20.Fermo I, Mazzola G, D’Angelo A, Paroni R. Determination of total plasma homocysteine: Comparison of a new enzyme immunoassay and a HPLC method. Thromb Haemost. 2000;83:968–9. [PubMed] [Google Scholar]
- 21.Chatzimichalakis PF, Samanidou VF, Verpoorte R, Papadoyannis IN. Development of a validated HPLC method for the determination of B-complex vitamins in pharmaceuticals and biological fluids after solid phase extraction. J Sep Sci. 2004;27:1181–8. doi: 10.1002/jssc.200401858. [DOI] [PubMed] [Google Scholar]
- 22.López-Alarcón M, Chávez-Negrete A, Montalvo-Velarde I, Maldonado-Hernández J, Vital-Reyes VS. Homocysteine after a methionine load in healthy subjects with adequate B-vitamin status. Cir Cir. 2011;79:432–8. [PubMed] [Google Scholar]
- 23.Center for Drug Evaluation and Research, US FDA. Guidance for Industry: Bioanalytical Method Validation. 2001. [Last accessed on 2012 Oct 17]. Available from: http://www.fda.gov/downloads/Drugs/…/Guidances/ucm070107.pdf .
- 24.Synder LR, Kirkland JJ, Glajch JL. 3rd ed. New York: Wiley John and Sons Inc; 1997. Practical HPLC method development. [Google Scholar]
- 25.Zirchrom. Dissociation Constants of Organic Acids And Bases. 2006. [Last accessed on 2012 Oct 17]. Available from: http://www.zirchrom.com/organic.htm .
- 26.Bilski P, Li MY, Ehrenshaft M, Daub ME, Chignell CF. Vitamin B6 (pyridoxine) and its derivatives are efficient singlet oxygen quenchers and potential fungal antioxidants. Photochem Photobiol. 2000;71:129–34. doi: 10.1562/0031-8655(2000)071<0129:sipvbp>2.0.co;2. [DOI] [PubMed] [Google Scholar]
- 27.Castillo ES. Folic acid. 1991. [Last accessed on 2012 Oct 17]. Available from: http://www.inchem.org/documents/pims/pharm/folicaci.htm .
- 28.Smith EL, Fantes KH, Ball S, Waller JG, Emery WB, Anslow WK, et al. B12 vitamins (cobalamins). I. Vitamins B12c and B12d. Biochem J. 1952;52:389–95. doi: 10.1042/bj0520389. [DOI] [PMC free article] [PubMed] [Google Scholar]
- 29.Rütters H, Möhring T, Rullkötter J, Griep-Raming J, Metzger JO. The persistent memory effect of triethylamine in the analysis of phospholipids by liquid chromatography/mass spectrometry. Rapid Commun Mass Spectrom. 2000;14:122–3. doi: 10.1002/(SICI)1097-0231(20000130)14:2<122::AID-RCM844>3.0.CO;2-R. [DOI] [PubMed] [Google Scholar]
- 30.Kromidas S. Weinheim: Wiley-VCH Verlag GmbH; 2000. Practical problem solving in HPLC. [Google Scholar]