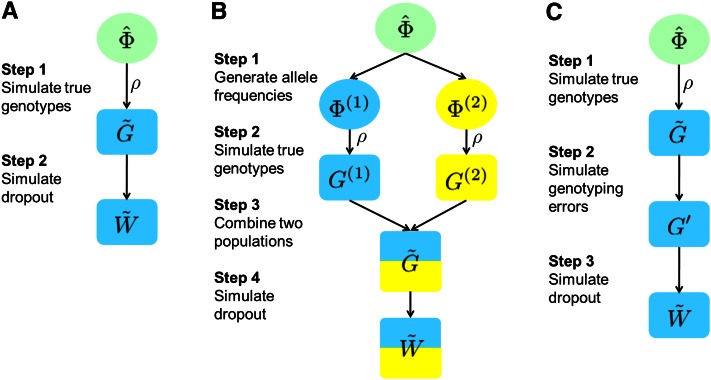
Figure 5 .
Simulation procedures. In all procedures, represents the allele frequencies estimated from the Native American data, represents the true genotypes generated under the inbreeding assumption, and is the observed genotypes with allelic dropout. (A) Procedure to generate the simulated Native American data (experiment 1). (B) Procedure to generate simulated data with population structure (experiment 2). In step 1, the allele frequencies of two subpopulations are generated using the F model. (C) Procedure to generate simulated data with genotyping errors other than allelic dropout (experiment 3).

