

Abstract
Motivation: Local ancestry analysis of genotype data from recently admixed populations (e.g. Latinos, African Americans) provides key insights into population history and disease genetics. Although methods for local ancestry inference have been extensively validated in simulations (under many unrealistic assumptions), no empirical study of local ancestry accuracy in Latinos exists to date. Hence, interpreting findings that rely on local ancestry in Latinos is challenging.
Results: Here, we use 489 nuclear families from the mainland USA, Puerto Rico and Mexico in conjunction with 3204 unrelated Latinos from the Multiethnic Cohort study to provide the first empirical characterization of local ancestry inference accuracy in Latinos. Our approach for identifying errors does not rely on simulations but on the observation that local ancestry in families follows Mendelian inheritance. We measure the rate of local ancestry assignments that lead to Mendelian inconsistencies in local ancestry in trios (MILANC), which provides a lower bound on errors in the local ancestry estimates. We show that MILANC rates observed in simulations underestimate the rate observed in real data, and that MILANC varies substantially across the genome. Second, across a wide range of methods, we observe that loci with large deviations in local ancestry also show enrichment in MILANC rates. Therefore, local ancestry estimates at such loci should be interpreted with caution. Finally, we reconstruct ancestral haplotype panels to be used as reference panels in local ancestry inference and show that ancestry inference is significantly improved by incoroprating these reference panels.
Availability and implementation: We provide the reconstructed reference panels together with the maps of MILANC rates as a public resource for researchers analyzing local ancestry in Latinos at http://bogdanlab.pathology.ucla.edu.
Contact: bpasaniuc@mednet.ucla.edu
Supplementary information: Supplementary data are available at Bioinformatics online.
1 INTRODUCTION
During the past decade, studies of recently admixed populations (e.g. Latinos, African Americans) have been used to detect associations of genomic regions with disease risk and for the inference of population genetic parameters (Seldin et al., 2011; Verdu and Rosenberg, 2011). These populations emerge from the mixing of genetically diverged ancestral populations for a relatively small number of generations (typically <20). Owing to crossover recombination events, the chromosome of any admixed individual is a mosaic of chromosomal regions originating from the ancestral populations. Identifying the ancestral origin of each of these regions is the goal of local ancestry inference.
Local ancestry inference has proven to be an extremely valuable resource for medical genetics in detecting genes associated with disease through admixture mapping or through a combination of genome-wide association, admixture mapping and re-sequencing studies (Fejerman et al., 2012; Freedman et al., 2006; Pasaniuc et al., 2011; Shriner et al., 2011; Yang et al., 2011). In additional to medical genetics, local ancestry has been successfully used in estimating fundamental quantities such as recombination rates, as well as in revealing the effects of natural selection and recent demography during the past generations (Hinch et al., 2011; Jarvis et al., 2012; Jin et al., 2012; Johnson et al., 2011; Tang et al., 2007).
Achieving the aforementioned goals critically relies on estimates of local ancestry that are both highly accurate and unbiased (not showing artifactual deviations) at any region in the genome (Pasaniuc et al., 2011; Seldin et al., 2011). Although a significant number of methods have been proposed and shown to be accurate in simulations, the performance of current approaches for multi-way admixed populations such as Latinos [with their genome a mixture of European (EUR), African (AFR) and Native American (NAM) chromosomes] has not been fully examined in empirical data (Baran et al., 2012; Brisbin et al., 2012; Johnson et al., 2011; Pasaniuc et al., 2009; Price et al., 2009; Sankararaman et al., 2008; Sundquist et al., 2008; Tang et al., 2006). Simulation studies inevitably make simplifying assumptions about the mixture process (such as random mating, number of generations of admixture, the per-generation admixture proportions) and the availability of accurate proxies for the true ancestral populations. The effect of violations of these assumptions on local ancestry inference and subsequent analyses has not been fully investigated in empirical data. For example, the use of inappropriate proxies for the ancestral populations could produce systematic local ancestry errors leading to false positive associations in admixture mapping (Baran et al., 2012). To correctly interpret genetic studies of Latinos, it is critical to assess local ancestry performance in empirical data.
In this work, we provide approaches to quantify the error rate in local ancestry estimates in empirical data without the use of simulations. Our approach uses the fact that local ancestries follow Mendelian inheritance. Local ancestry estimates (inferred by methods that do not model family relationships) that lead to Mendelian inconsistencies in trio families provide a lower bound on the errors present in the local ancestry estimates. We propose to measure the rate of Mendelian inconsistencies in local ancestry (which we term the MILANC rate) as a means to assess error rates in the local ancestry estimates (which we refer to simply as the error rate). Our approach mirrors widely used approaches in genotyping and sequencing studies that use Mendelian inconsistencies to assess the overall error rate. The MILANC rate provides, for the first time, a real data-based evaluation of local ancestry estimates as opposed to simulations that cannot measure systematic inaccuracies arising from violations of model assumptions. Violations from model assumptions can occur at a global scale (e.g. deviations from random mating) and at a local scale (e.g. improper modeling of recombination rates) that could lead to complex error patterns in the local ancestry estimates.
We analyze genotype data from 489 Mexican and Puerto Rican trio families from the Genetics of Asthma in Latino Americans [GALA study (Burchard et al., 2004)] in conjunction with 3204 unrelated Latinos from the Multiethnic Cohort (MEC) study (Kolonel et al., 2000) to assess the accuracy of local ancestry inference across the genome in Latinos. We use the MILANC rate to evaluate the error rate of severally widely used methods for local ancestry. We observe that the genome-wide average MILANC rate is significantly higher in empirical data as opposed to simulations. Thus, simulations under-estimate the true underlying error rate in the local ancestry estimates in Latinos. Second, we show that errors in local ancestry estimates vary substantially across the genome with several loci attaining significantly higher error rates than the average. Importantly, we observe that loci with increased deviations in the average local ancestry (more than three standard deviations) also show increased MILANC rate. This result holds for all considered methods, suggesting that this is a general property of local ancestry estimation.
Although the distribution of MILANC rates is approach specific, for the best performing methods, we observe a general pattern where the MILANC rate correlates with deviations in local ancestry. We hypothesize that this is due to the fact that the reference panels do not fully capture the genetic diversity in the ancestral populations of current day Latinos and therefore a large percentage of errors correspond to alleles being mislabeled preferentially toward a given ancestry. An implication of this observation is that loci with higher deviations in their local ancestry estimates tend to have elevated MILANC rates. Such loci could lead to false positive associations in scans of local ancestry across the genome (e.g. case-only admixture mapping). We provide maps of MILANC rates for all compared methods as a public resource for the scientific community.
An important caveat of studies of Latino populations is that the Native American component is estimated using current day Native American populations [e.g. Maya and Pima of the Human Genome Diversity Project (HGDP) (Li et al., 2008)] that may have been exposed to European gene flow. We use family information to accurately estimate panels of ‘virtual’ ancestral haplotypes (NAM, EUR and West African) for the Latino populations of GALA, in a manner similar to (Johnson et al., 2011). Here, we show that these ‘virtual’ ancestral panels yield increased accuracy and lower bias than cosmopolitan panels when used in local ancestry inference across both GALA and the MEC studies. This suggests that the new reference panels provide a better representation of the ancestral populations of current day Latinos. We provide the inferred reference panels as a public resource for the scientific community.
2 METHODS
GALA dataset. A total of 232 and 257 mother–father–child trio families of Mexican and Puerto Rican ethnicities were collected as part of the GALA Study (Burchard et al., 2004); GALA is a multi-center, international effort designed to identify and directly compare clinical, genetic and environmental risk factors associated with asthma, asthma severity and drug responsiveness among Latino ethnic groups. The trios were ascertained on an asthmatic proband. Genotyping was performed using the Affymetrix 6.0 GeneChip Array. SNPs were filtered based on call rates  %, Hardy–Weinberg equilibrium at significance level of 10e-6 (in founders),
  % Mendelian inconsistencies and an unambiguous mapping to the human reference genome (hg18). The total number of SNPs passing QC was 837 383. Subjects were filtered based on call rates
  %, consistency between reported and genetic sex and the absence of any unexpected identity by descent or by state. Familial relationships were confirmed using measures of identity by descent and Mendelian inconsistencies.
MEC dataset. The MEC is a large prospective cohort study in California (mainly Los Angeles County) and Hawaii (Kolonel et al., 2000). Included in this analyses were Latino breast and prostate cancer cases and control subjects from Genome-Wide Association Studies (GWAS) of these cancers in the MEC [546 breast cancer cases and 558 control subjects (Fejerman et al., 2012); 1043 prostate cancer cases and 1057 control subjects (Waters et al., 2009)]. Genotyping of both studies was conducted using the Illumina Infinium 660W array in the Epigenome Data Production Center at USC (breast) and the Broad Institute (prostate). We excluded all SNPs with minor allele frequency of  % and call rate of
  %, and we excluded samples that had a genotyping call rate of
  %, as well as samples that showed cryptic relatedness. For MEC local ancestry analyses, we intersected MEC and GALA SNP sets to achieve a SNP density of 127 935 across the genome.
Inferring local ancestry in Latinos. We evaluated the error characteristics of four methods for local ancestry inference: LAMP-LD (Baran et al., 2012), ALLOY (Bercovici et al., 2012), WINPOP (Pasaniuc et al., 2009) and PCAdmix (Brisbin et al., 2012). The first two methods model linkage disequilibrium (LD) in the ancestral populations, whereas the latter two methods model SNPs as independent conditional on local ancestry. All methods were run independently on each chromosome with default parameters. As proxy for the AFR ancestry we used the 226 haplotypes of the HapMap 3 phase 2 YRI (Yoruba in Ibadan, Nigeria) population, whereas for the NAM ancestry, we used 88 Native American samples (25 Bolivian Aymara, 24 Peruvian Quechua and 39 Mesoamericans) that were genotyped using the Affymetrix 6.0 array (Bigham et al., 2010). We inferred the Native American haplotypes from genotype data using the Beagle (Browning and Browning, 2007) phasing algorithm. For the EUR ancestry, we tested the results both using the 224 HapMap 3 phase 2 CEU (Utah residents with ancestry from northern and western Europe) haplotypes, as well as using a sample of Spanish individuals from the POPRES data (Nelson et al., 2008) genotyped on the Affymetrix 550k platform. To remove potential artifacts from mislabeling of the reference allele across populations, we disregarded the C/G and A/T SNPs. We merged all data by taking the intersection of all SNP sets. For GALA data, this procedure yielded 588 595 SNPs (denoted as 600k) for the data that uses CEU as proxy for the Europeans and 302 449 (denoted as 300k) for the dataset that uses POPRES Spanish as proxy for the EUR ancestry. For all compared methods, we used the most likely ancestry estimate at each locus in each individual.
Quantifying errors in local ancestry inference in real data. The presence of family relationships allows us to compare the estimates of local ancestry at a given SNP among the members of the trio. We expect the local ancestry at the child to be consistent with Mendelian inheritance rules. For example, an SNP at which the child is inferred to have EUR ancestry on both chromosomes while one of the parents does not have EUR ancestry alleles indicates an error in the estimated local ancestry. We refer to these errors as MILANC. MILANC is only relevant to methods that estimate local ancestry in unrelated individuals, when applied to family data. We infer local ancestry in real Latino trios using methods that treat every individual as unrelated and report the MILANC rate at every locus in the genome defined as the proportion of all trio families that contain at least one Mendelian inconsistencies in their estimated local ancestry. Unless otherwise noted, we averaged MILANC rate across all SNPs in contiguous non-overlapping windows of 1 Mb in length. The results were relatively insensitive to the choice of window lengths (Supplementary Table S4).
Relationship of MILANC rate and error rate in local ancestry estimation. Consider a single SNP at which local ancestry is inferred. The error rate in the local ancestry at this SNP is drawn from some distribution F with mean  and standard deviation
  . Given a trio of individuals and assuming that the errors in inferring the local ancestry of each allele in this trio are independent, the probability of at least a single local ancestry error in this trio is denoted ϵ. For small local ancestry error rates, the distribution of ϵ across SNPs has mean μ and standard deviation σ. Under the assumption of an uncorrelated error process across trios, the number of ancestry errors at this SNP for n trios is given by
  . Assume that a fraction α of these errors lead to Mendelian inconsistencies. Thus M, the MILANC, at this SNP follows
 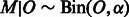 . Then the squared correlation coefficient in the population between MILANC and the error rate,
 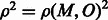 , is computed as follows:
 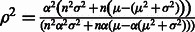 See Supplementary Note for complete derivation. Consider two cases.
 (No variation in the error rate across the genome). Then
  .
. (The error rate in local ancestry estimation varies across the genome). Then
 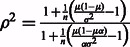 . For
. For  , we then have
  .
.
Simulations of Latino admixed chromosomes. To investigate the relation between MILANC and true underlying error rate, we simulated a Latino population by mixing of European, NAM and West African chromosomes [HapMap phase 3 data together with the 88 Native Americans of (Bigham et al., 2010), see earlier in the text]. Following the strategy of (Price et al., 2009), we simulated admixed chromosomes by first simulating recombination positions using a random walk from the  -end to the
  -end, with crossovers between chromosomes occurring as a Poisson process with rate
  times the recombination rate. Conditional on the positions of recombination events, we assigned the ancestry of each segment between two consecutive breakpoints using the admixture proportion of 0.45:0.45:0.1 for European, Native American and West African populations, respectively. Finally, we selected at random one haplotype per ancestry to create an admixed haplotype by copying segments according to the ancestry blocks. For all the simulation results presented here, we removed the haplotypes used in simulation of admixed data from the panel of haplotypes used as reference. For computational purposes, we restricted all simulations to the Affymetrix 6.0 SNPs from chromosome 1 (48 827 in total).
Inferring ancestral haplotype panels. We followed a two-step procedure to infer ancestral haplotypes from the GALA trios. First, we ran LAMP-HAP (Baran et al., 2012), a local ancestry method that takes family relationships into account to achieve highly accurate local ancestry estimates at every locus in the genome for every trio. LAMP-HAP provides an assignment of ancestry at each of the four haplotypes in the trio. In the second step, we selected all haplotype segments with corresponding ancestry assignment to form the reference panels of haplotypes (with segments from other ancestries set to missing). Similar approaches have been used in previous works for inferring ancestral haplotype segments (Bryc et al., 2010; Johnson et al., 2011).
Quantifying deviations in local ancestry and correlation to MILANC rate. We divided the genome into non-overlapping windows of 1 Mb and computed the average local ancestry  in each window w for each ancestral population
  . Using standard approaches, we normalized the deviations in local ancestry by subtracting the mean and dividing by observed variance:
  , where the mean and variance is taken across all windows w. We computed average MILANC
  for each window and correlated
  to
to  . To test the hypothesis that the correlation is zero, we used the statistic
  , where Nw is the number of considered regions assumed to be independent. This test statistic approximates well (at small values of ρ, as expected under null) the Fisher’s transformation
  known to be asymptotically normally distributed. We selected windows 10 Mb apart (yielding 271 in total across the genome) and assumed the observations are independent.
Expected variation in the average local ancestry across the genome. Under standard demographic assumptions (e.g. panmixia, no continuous influx of chromosomes from one ancestry), we can model the local ancestry as a draw from the multinomial distribution with parameter  , where θ denotes the vector of genome-wide proportions of the three ancestral populations. Therefore, the average EUR local ancestry in a sample of Nc chromosomes (the mean across Nc draws) has variance of
  (same for the other ancestries); we note that the theoretical estimates of the variance assume independence of the draws, which leads to deflated estimates. We estimate the empirical standard deviation as the square root of the empirical variance. We note that violations of the assumptions above (e.g. continuous influx of chromosomes in the admixture) have the potential of increasing the variance of the true local ancestries.
Quantifying the significance of reduction in MILANC rate by permutations. We measured the benefit of the new reference panel using the difference in the average MILANC rates as computed using the new panel versus the standard one. We measured statistical significance of the difference being greater than 0 using permutations. We randomly permuted the label of the MILANC rate in the given window across the two runs (with different reference panels) to create a null model of no differentiation between the average MILANC rate. Across 10 000 permutations, we did not observe any permutation that achieves a higher difference in the average MILANC rate that the one observed in the unpermuted data.
3 RESULTS
3.1 Identification of errors in local ancestry via family relationships
To measure error rates in empirical data, in which the true local ancestry is unknown, we leverage the fact that local ancestry follows Mendelian inheritance. Therefore, pedigree relationships can be used to identify errors in local ancestry estimates by simply testing whether the inferred ancestral status of the child’s chromosomes can arise through Mendelian inheritance from the ancestral status of the parents’ chromosomes. For example, if at a given locus, the father has AFR ancestry on both chromosomes, whereas the mother has EUR ancestry, the child must have a single chromosome that is AFR and one that is EUR (Fig. 1). We independently estimate local ancestry for each individual in a pedigree using methods that ignore family relationships and then test each position in the genome of the child with the genomes of the parents for Mendelian inconsistency in its local ancestry. The percentage of trios with at least one Mendelian inconsistency in local ancestry (termed MILANC rate) gives a direct lower bound of the error rate in local ancestry inference at any locus in the genome. Importantly, MILANC rate does not require the true ancestry and thus provides a measure of performance at each locus in real data. In contrast, the local error rate is hard to estimate in simulations, as the specific characteristics of the different loci in the genome cannot be fully accounted for.
Fig. 1.
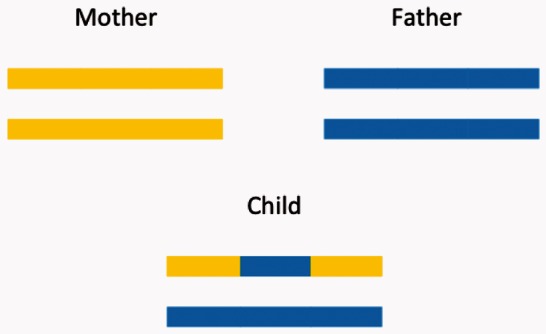
Schematic figure of a trio with 3 loci with middle locus showing a Mendelian Inconsistency (MILANC). Local ancestry is denoted by different colors
We analytically derived the correlation between MILANC rate and the underlying error rate in the local ancestry estimates as a function the number of trios, percentage of errors that manifest as MILANC and the mean and variance of the error rate across the genome (Section 2). We show that the correlation of MILANC to the true error rate converges to 1 with increasing number of trios as long as there exists variation in the local error rate across the genome. This proves that MILANC is informative of the underlying error rate in the limit of large sample sizes as long as there is variability in the error rate across the genome.
To further quantify the relationship between MILANC rate and the error rate, we simulated 500 Latino trios using standard parameters and estimated their local ancestry independently in each individual ignoring family relationships using LAMP-LD (Baran et al., 2012) (Section 2). The ancestry estimates attained an average genomic error rate (defined as percentage of all alleles with incorrect inferred ancestry) of 3.0% with standard deviation of 1.3%. This suggests that the error rate varies across the genome, thus making MILANC informative about the true underlying local error rate (see earlier in the text). We estimated the average MILANC (as percentage of trios with at least one MILANC) across loci of 1.5% (S.E.M. 0.2%). We observed that 8.2% (S.E.M. 0.6%) of the errors in local ancestry inference lead to MILANC, equivalent to roughly 24% all loci with at least one error in the trio yielding a MILANC. The squared correlation between MILANC and the error rate attained a value of 0.52 greatly exceeding the theoretical squared correlation of 0.07 under the assumption of no variability in the local error rate and roughly matches the theoretical squared correlation of 0.60 expected at 500 trios, error rate of 3% (standard deviation of 1.3%) and 8% of all errors leading to Mendelian inconsistencies. The difference between theoretical and observed correlation could be due to the correlations in the errors in local ancestry estimates and due to sampling variance. These results are consistent with an error model with variable rates across the genome out of which 8% of errors in local ancestry yield MILANC.
To better characterize the error rate in ancestry estimation on empirical data, we computed MILANC rates in the GALA Mexican and Puerto Rican trios using local ancestry estimates from methods that model ancestral haplotype structure [LAMP-LD (Baran et al., 2012), ALLOY (Bercovici et al., 2012)] and methods that assume independent SNPs when conditioning on ancestry [WINPOP (Pasaniuc et al., 2009), PCAdmix (Brisbin et al., 2012)]. Table 1 shows that the MILANC rate across the genome varies with methodology for ancestry inference employed, with best performing methods attaining an average MILANC rate ∼3%, significantly higher than simulation studies (MILANC of 1.5% in 500 simulated trios for LAMP-LD). These results suggest that the error rates estimated in simulations may be significantly lower than in real data (simulation assumptions may lead to reduced error rates). This further emphasizes the utility of studying error rate using MILANC in empirical data. As previously reported, we observe that modeling of ancestral LD through haplotypes leads to increased performance over methods that model independent SNPs conditional on their ancestry in Puerto Ricans (Baran et al., 2012).
Table 1.
MILANC rate and average local ancestry across methods on the GALA trios data
| Method | Average MILANC | Reported error rate | Average local ancestry |
||
|---|---|---|---|---|---|
| EUR | NAM | AFR | |||
| GALA Mexican | |||||
| WINPOP | 2.9 (1.3) | 12.8 | 45.4 (1.8) | 49.9 (1.8) | 4.7 (0.9) |
| LAMP-LD | 3.2 (1.5) | 9.9 | 48.5 (2.2) | 46.5 (2.2) | 5.1 (0.9) |
| ALLOY | 3.0 (1.3) | 12.5 | 62.3 (3.3) | 32.2 (3.3) | 5.5 (1.2) |
| PCAdmix | 17.1 (3.4) | 4.2a | 52.1 (6.0) | 42.3 (5.7) | 5.5 (1.5) |
| GALA Puerto Rican | |||||
| WINPOP | 3.2 (1.3) | 9.0 | 66.6 (2.5) | 13.3 (1.9) | 20.1 (1.9) |
| LAMP-LD | 2.5 (1.1) | 6.4 | 67.0 (2.6) | 11.4 (2.0) | 21.5 (2.0) |
| ALLOY | 4.3 (1.4) | 12.5 | 67.9 (2.9) | 11.2 (2.3) | 21.0 (2.2) |
| PCAdmix | 11.4 (2.4) | 4.2a | 69.2 (3.9) | 9.3 (3.0) | 21.5 (2.7) |
Note: Results were averaged in non-overlapping contiguous loci 1 Mb in size. Standard deviation of the MILANC rate and the average local ancestry across loci is denoted in parenthesis. Reported Error Rates are obtained as follows: Table 1 of Baran et al. (2012) for WINPOP/LAMP; Figure 3 of Bercovici et al. (2012) for ALLOY; Maya-Yoruba-French simulations from Supplementary Table S4 of Brisbin et al. (2012) for PCAdmix (aaccuracy for PCAdmix is only reported at calls confidently called at threshold 0.8, whereas all other methods report accuracy at all loci).
3.2 Loci with increased deviations in local ancestry show an elevated MILANC rate
We investigated whether loci with increased deviations in local ancestry are enriched with Mendelian inconsistencies (MILANC) in the GALA trios. Similar to previous works (Bryc et al., 2010; Jin et al., 2012), we defined loci with increased deviations in local ancestry as all loci showing ≥3 standard deviations increase or decrease in any of the three local ancestry components. Table 2 shows that for all considered methods for all ancestries, loci with increased deviation in local ancestry show an elevated MILANC rate. Results in Table 2 are consistent with a model in which deviations in local ancestry occur at loci with higher error rates in local ancestry inference.
Table 2.
MILANC rate across the genome or at loci with increased deviation in average local ancestry
| Method | Average MILANC | MILANC rate at loci with deviation in ancestry |
||
|---|---|---|---|---|
| EUR | NAM | AFR | ||
| GALA Mexican | ||||
| WINPOP | 2.9 | 4.9 (23) | 4.1 (25) | 7.5 (20) |
| LAMP-LD | 3.2 | 6.5 (12) | 4.9 (22) | 3.9 (13) |
| ALLOY | 3.0 | 5.6 (35) | 5.7 (34) | 6.9 (16) |
| PCAdmix | 17.09 | 19.0 (18) | 17.4 (17) | 21.0 (30) |
| GALA Puerto Rican | ||||
| WINPOP | 3.2 | 7.3 (6) | 4.9 (5) | 5.3 (10) |
| LAMP-LD | 2.5 | 3.6 (9) | 3.0 (10) | 3.8 (12) |
| ALLOY | 4.3 | 7.1 (23) | 6.1 (16) | 8.1 (15) |
| PCAdmix | 11.4 | 14.3 (11) | 14.1 (9) | 13.8 (23) |
Note: The number of loci with 3 or more standard deviations in local ancestry is denoted in paranthesis. We observed increased MILANC rate across all methods at loci with increased deviation in local ancestry.
Conversely, we quantified the average deviation in local ancestry at loci with elevated MILANC rates. Table 3 shows that for most methods, loci with elevated MILANC rate also show deviations in local ancestry. For example, in the Mexican data, we observe that at loci with 7.5% or greater MILANC rates, the average deviation in AFR local ancestry is 2.9 and 4.1 standard deviations for WINPOP and ALLOY, respectively. These results are consistent with an error model that mislabels alleles preferentially toward AFR ancestry. We observe similar patterns for haplotype-based methods (LAMP-LD and ALLOY) in Mexican trios with respect to EUR and NAM ancestry in that they tend to increase EUR ancestry at the expense of NAM ancestry. We also note that LAMP-LD attains fewer loci with extremely large MILANC rate than other methods.
Table 3.
Average local ancestry deviation (in normalized standard deviation units) at loci with increased MILANC rate
| Method | Number of loci with increased MILANC rate 5%/7.5% | Deviation in local ancestry |
||
|---|---|---|---|---|
| EUR | NAM | AFR | ||
| GALA Mexican | ||||
| WINPOP | 164/17 | −0.3/−1.6 | −0.1/0.0 | 0.7/2.9 |
| LAMP-LD | 294/28 | 0.8/1.3 | −0.9/−1.4 | 0.2/0.1 |
| ALLOY | 197/16 | 1.1/0.5 | −1.5/−2.0 | 1.0/4.1 |
| GALA Puerto Rican | ||||
| WINPOP | 252/21 | −0.1/−0.7 | 0.2/0.5 | 0.0/0.4 |
| LAMP-LD | 78/0 | 0.5/ | −0.8/ | 0.1/ |
| ALLOY | 712/53 | −0.0/−0.8 | −0.1/0.4 | 0.1/0.6 |
Note: We display results for two nominal levels of MILANC rate 5%, 7.5%. We did not display results for PCAdmix, as the mean MILANC rate of PCAdmix exceeds the nominal levels we considered.
3.3 Exploration of MILANC rates in Latinos
Having established that all methods considered show deviations in ancestry at loci with increased MILANC rate, we investigated in details factors affecting local ancestry estimates from LAMP-LD (one of the best performing methods). Figure 2 plots the MILANC rate across the genome for LAMP-LD (similar results are obtained for other methods, Supplementary Note). Twenty-three loci (non-overlapping regions of 1 Mb) in Mexicans and 24 loci in Puerto Ricans attained an elevated MILANC rate (at least three standard deviations above the average MILANC; nominal threshold of 7.6% for Mexican and 5.9% for Puerto Ricans). MILANC shows large variability across the genome, regardless of the method or reference panel used albeit different approaches yield increased error rates at different loci (Supplementary Note). These outliers are likely due to complex linkage disequilibrium and recombination rate patterns not represented in the reference panels.
Fig. 2.

MILANC rates in 232 Mexican (left) and 257 Puerto Rican (right) trios computed when ancestral LD is modeled (LAMP-LD) in local ancestry estimation procedure. Horizontal lines denote 3 (4) standard deviations from the average
We compared MILANC rate and deviations in the average local ancestry proportions of AFR, EUR and NAM ancestries. We observe that MILANC correlates to decreases in NAM and increased EUR local ancestry (Fig. 3). For example, in Mexicans, the Pearson correlation coefficient r is 0.41 between MILANC and EUR local average ancestry and −0.44 for MILANC and NAM; the correlation is significantly different from 0 at a P-value of  ) for the EUR (NAM) ancestry and is not significant (P-value of 0.12) for the AFR ancestry. The association of MILANC rate with average local ancestry persists across Latino populations and inference methods. In Puerto Ricans, we observe r of 0.16 (−0.26) between MILANC and EUR (NAM) ancestry with P-values of
  for r2 different from 0. Similar to Mexicans, we do not observe squared correlation significantly different from 0 (P-value 0.95) for the AFR ancestry (Fig. 3 and Supplementary Note). In addition, we observe significant correlations in MILANC between Puerto Ricans and Mexicans r2 = 0.08 (P-value
  ) in LAMP-LD estimates, as well as significant correlation across LAMP-LD and WINPOP of r2 = 0.09 (P-value
  ) for Mexicans and r2 = 0.11 (P-value
  ) for Puerto Ricans. The results are consistent with an error model in which certain regions are susceptible to increased error rates across populations and methods (presumably, the diversity in these regions is not accurately captured by the reference panels). We hypothesize that the correlation between the MILANC rate and EUR or NAM ancestries is due to a tendency to miscall NAM alleles as EUR, thus leading to inflated EUR estimates. Consequently, local ancestry estimates at loci with large MILANC are not simply noisier but are likely to be biased. This effect can lead to false positive associations, given large enough sample sizes, in local ancestry scans in Latinos (e.g. case-only admixture mapping or scans for selection) as loci with elevated error rates tend to also have increased EUR at the expense of NAM ancestry (Supplementary Note).
Fig. 3.
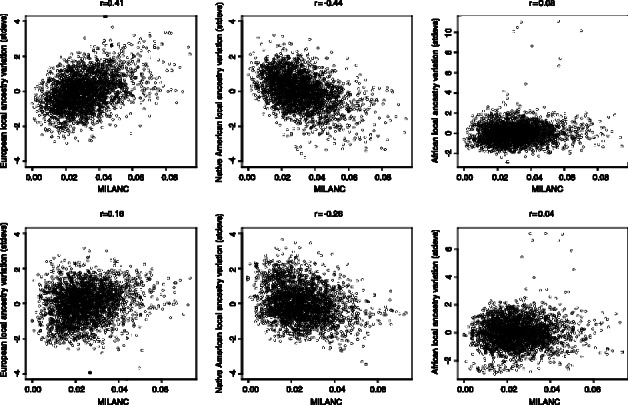
Normalized local ancestry deviation ( ) (EUR, NAM and AFR) versus average MILANC rate
  in the GALA families. Every dot denotes the average across contiguous 1 Mb genomic region. We observe significant correlation of MILANC rates to decreases in NAM ancestry and increases in EUR ancestry for both populations. Errors quantified by MILANC tend to increase EUR local ancestry at the expense of NAM one
Most of the errors that contribute to MILANC (72% in Mexicans and 54% in Puerto Ricans) are made between EUR and NAM ancestries (Supplementary Note). This effect could be explained by the fact that error rate correlates with genetic distance among the ancestral populations (Pasaniuc et al., 2009). This is also supported by the observation that the per-individual MILANC is negatively correlated with the genome-wide AFR ancestry proportion (Supplementary Note,  ), reflecting that it is easier to discriminate segments of AFR ancestry from those of EUR and NAM ancestries than it is to discriminate NAM ancestry from EUR ancestry. We note that as we do not know the true ancestry at any locus in the genome, we cannot assign directionality, and we therefore cluster the errors by pairs of ancestries.
We investigated whether a Northern [HapMap CEU (Altshuler et al., 2010)] or a Southern [POPRES Spanish (Nelson et al., 2008)] EUR ancestry panel provides a better performance for local ancestry in Latinos (Section 2). At similar SNP density, we observe (Table 4) that the Southern European reference panels provides marginal increase in performance. Interestingly, the advantage of using a Southern versus Northern European panels as proxy for the EUR ancestry in Latinos is similar in magnitude to the advantage attained by using a denser SNP panel (Table 4). However, the behavior is different across Mexicans and Puerto Ricans. We note a much larger gain in accuracy for Puerto Ricans when using a much denser panel of SNPs than for Mexicans. Potential explanations for this effect include having better proxy for the Native American contribution of Puerto Ricans in our Meso and South American reference panels (Martinez-Cruzado et al., 2005).
Table 4.
Average genomewide MILANC rate (s.e.m.) in percentage attained by LAMP-LD in the in the Mexican and Puerto Rican trios of the GALA study when different reference panels over various SNP sets were used as proxy for Europeans
| CEU-300 k | POPRES Spanish-300 k | CEU-600 k |
|---|---|---|
| GALA Mexican | ||
| 3.44 (0.03) | 3.15 (0.03) | 3.16 (0.03) |
| GALA Puerto Rican | ||
| 3.46 (0.03) | 3.26 (0.03) | 2.50 (0.02) |
3.4 Extendability of map of MILANC rates to multiple studies
We tested whether the map of MILANC rates inferred on the GALA cohort is useful for other studies in Latinos. We estimated local ancestry in 3204 unrelated Latino samples from the MEC data using LAMP-LD (Baran et al., 2012) (Section 2) and compared the MILANC rates inferred from the GALA Mexican trios with deviations in the average local ancestry in the MEC data. We observed correlations of 0.43, −0.42 and −0.01 between MILANC estimated in GALA data to EUR, NAM and AFR ancestry, respectively, estimated in MEC data. Thus, the correlation between MILANC and average local ancestry is not specific to the GALA cohort (Supplementary Note) but extends to other studies showing the usefulness of estimating MILANC in GALA.
We observe a mean ancestry of (0.631, 0.323, 0.046) in the MEC data with empirical standard deviations of (0.022, 0.022, 0.005) for the EUR, NAM and AFR ancestries. Genome-wide significant deviations from the average local ancestry (defined as 4 or more empirical standard deviations from the mean genome-wide ancestry) were observed only at the human leucocyte antigens region on chromosome 6 in the NAM ancestry (Supplementary Note). The significant deviations in average local ancestry at the human leucocyte antigens region could be the result of higher error rates observed at this region (the MILANC rate at this region varies between 5 and 6%) but can also be due to a real signal (e.g. recent selection in the region). Further work is required in determining whether significant deviations in local ancestry at this locus are an effect of selection or artifacts of local ancestry inference, or possibly a combination of both. No other genome-wide significant deviations were detected at this significance level, consistent with the phenotype ascertainment of this data.
3.5 Improving the reference panels for local ancestry inference in Latinos
In principle, having accurate estimates for local ancestry in Latinos should allow us to construct better reference panels of the ancestral populations for local ancestry inference. A reconstructed reference panel would be particularly valuable for the Native American component where the true ancestral estimates are not available or where current panels are limited in their sample size. Although recent works have reconstructed ancestral haplotypes for population demographic inferences (Bryc et al., 2010; Johnson et al., 2011), here we focus only on the utility of such reconstructed ancestral haplotype panels for local ancestry inference. Given 489 trios, we expect  NAM alleles at each locus (see genome-wide admixture proportions in Table 1). Thus, these inferred Native American panels could prove to be a better proxy for the ancestral Native Americans in other Latino populations. To assess the utility of these panels, we performed two experiments.
In the first experiment, we split the GALA trios into two datasets. We used LAMP-HAP, an extension of LAMP-LD to infer local ancestry in trios (Baran et al., 2012), to estimate the local ancestry in 123 randomly chosen GALA trios. We extracted the NAM, EUR, and AFR haplotype segments, thus creating new reference panels. The number 123 was chosen so that the total number of inferred NAM and EUR alleles roughly matches the number of alleles in the initial reference panels. To assess the accuracy of this reference panel, we computed MILANC on the LAMP-LD local ancestry estimates in the remaining 366 trios (treating each of the individuals independently). As a baseline, we computed MILANC attained by LAMP-LD using the reference panels containing a dense set of SNPs (600k) over the same 366 trios. We observe a significant reduction in the overall average MILANC rate when the newly constructed reference panels were used (genome average of 1.7% as opposed to the 2.6%, Supplementary Note), permutation P-value  (Section 2). Thus, our newly inferred reference panel provides a significantly better inference accuracy, suggesting a better estimate of the true ancestral components of Latinos, both at a global level and at particular loci (Supplementary Note).
In a second experiment, we tested whether the newly constructed reference panels are useful in studies over cohorts other than the ones that are part of the GALA study. To test this hypothesis, we assessed local ancestry estimates in the MEC sample when the newly built GALA reference panels were used in addition to the cosmopolitan reference panels. We observed mean of (0.598, 0.360, 0.042) with empirical standard deviations of (0.014, 0.014, 0.005) for the EUR, NAM and AFR ancestries, respectively. We observe a large decrease in the standard deviation of average local ancestry estimates across the genome, closer to the expected theoretical standard deviations of (0.006, 0.006, 0.002) for the three ancestries (although we note that we expect the theoretical variance to be deflated as it assumes all samples are independent, panmixia and a single admixture impulse, assumptions that may not always hold in practice). In addition, the decrease in EUR mean ancestry from 0.631 to 0.598 in conjunction with an increase in the NAM inferred ancestry from 0.323 to 0.360 further supports a reduction in the overall error rate coupled with a biased error model that preferentially mislabels NAM alleles as EUR (most likely due to a misrepresentation of the true NAM ancestry in the reference panels). This hypothesis is further supported by a significant reduction in the correlation of MILANC rate and the deviations in average local ancestry (e.g. r = 0.43 to r = 0.31 for EUR average local ancestry, permutation P-value  ) showing that the bias is reduced when our new reference panels are used in addition to the cosmopolitan reference datasets (Supplementary Note). Finally, we note that this effect (increased genome-wide EUR ancestry when computed from local ancestry estimates) is consistent to other recent works [Supplementary Figure S1 of Johnson et al. (Johnson et al., 2011)] that also show increased genome-wide EUR ancestry when computed from local ancestry estimates. These results emphasize the importance of accurate reference panels for future studies of local ancestry in Latino populations.
We also separately extracted the ancestral haplotypes from 232 Mexican trios and 257 Puerto Rican trios, respectively. We computed the standard allele frequency differentiation statistics FST between the inferred ancestral allele frequencies of Mexicans and Puerto Ricans computed from these haplotypes. We observe a much greater allele frequency differentiation between the ancestral Native American components of the two Latino population than the difference between the EUR ancestries consistent with previous works that show large genetic diversity among the NAM ancestors of current day Latinos (Martinez-Cruzado et al., 2005) (see Table 5).
Table 5.
FST estimates between inferred ancestral segments in Mexicans and Puerto Ricans and different ancestral panels computed on the 300 k set of SNPs
| Ancestral population | YRI | AFRPR | AFRMEX | |
|---|---|---|---|---|
| AFRMEX | 2.33% | 0.60% | – | – |
| AFRPR | 1.60% | – | 0.60% | – |
| CEU | Spanish | EURPR | EURMEX | |
|---|---|---|---|---|
 |
1.00% | 0.91% | 0.43% | – |
 |
0.89% | 0.72% | – | 0.43% |
| NA |  |
 |
||
|---|---|---|---|---|
 |
1.11% | 2.59% | – | – |
 |
2.61% | – | 2.59% | – |
4 DISCUSSION
Accurate local ancestry inference in Latinos forms an important component of disease and population genetic studies in these populations. Biases in local ancestry estimation would lead to false positive associations thereby invalidating the scientific results reported in these analyses. In this work, we quantified the accuracy of local ancestry inference at each location in the genome using real genotype data over >4000 Latino individuals. Our study provides the first comprehensive evaluation of local ancestry methods using external information taken from family data and thereby overcomes the simplifying assumptions of simulation-based assessments. We provide a direct analytic relation between the sample size, the MILANC and the error rates of ancestry inference. We estimated the MILANC rates for a number of state-of-the-art local ancestry methods—ALLOY (Bercovici et al., 2012), LAMP-LD (Baran et al., 2012), PCAdmix (Brisbin et al., 2012) and WINPOP (Pasaniuc et al., 2009). All methods exhibit qualitatively similar behavior. First, we observe that the MILANC rates associated with each of these methods vary considerably across the genome. We construct genomic maps of MILANC rates for different local ancestry inference methods that can be used to aid researchers in interpreting the results of studies of local ancestry in Latinos. Second, we find that loci with increased deviation in local ancestry inference show increased Mendelian inconsistency rates in local ancestry inference in Latinos. Our results strongly suggest that local ancestry estimates at these loci are biased. This is important for studies of local ancestry in Latinos such as case-only admixture mapping or studies of natural selection that aim at identifying loci with large deviations in local ancestry. The genomic maps of MILANC rates could serve as a valuable tool to distinguish true signals from loci where the local ancestry estimates are inaccurate. For example, we find 12 loci as putative for natural selection in the GALA Mexican data (more than 3 standard deviations increase in the EUR local ancestry). We observe an average MILANC rate of 6.5% at these loci, significantly higher than the average genomic rate of 3.2%. This suggests that an alternate explanation for part of the enrichment of EUR ancestry at these loci is error/bias of local ancestry inference.
As future work, we propose to incorporate the newly inferred error rates in robust association statistics that model the variation in error rates across the genome in addition to unbiased local ancestry inference methods. Our results also show that currently available genotype data from Latinos can be used to build better reference panels to be used as proxies for local ancestry inference in Latinos; this motivates the need for improved methodologies for recovery of ancestral haplotypes from admixed populations. In practice, to obtain high resolution map of the locus-specific error rates, our analysis should be replicated with a considerably larger sample size. However, even with the current sample size, we show a significant correlation between the MILANC results and the average ancestry, as well as a statistically significant reduction in MILANC rates when an improved reference panel is available. We observe this phenomenon when using a denser set of SNPs as a reference panel, as well as when using a closer population (e.g. Spanish instead of CEU). It is therefore crucial to construct highly accurate reference panels, and as a first step toward this goal, we show that a reference panel can be reconstructed by extracting the ancestral haplotypes from an admixed population. Clearly, another potentially viable approach may be to sequence a large number of NAM, EUR and AFR samples and use those as a reference.
Supplementary Material
ACKNOWLEDGEMENTS
The authors acknowledge the patients and their families for their participation. The authors also thank the numerous health care providers and community clinics for their support and participation in the GALA Study. They thank Lindsey Roth and Scott Huntsman for helping in the GALA trios quality control and genotyping. They thank Abigail Bigham and Mark Shriver for allowing them to use the Native American data. They also thank Amy Williams, Alkes L. Price and Nick Patterson for helpful comments and suggestions. E.H. is a faculty fellow of the Edmond J. Safra Center in Tel-Aviv University.
Funding: Research reported in this publication was supported in part by the National Cancer Institute of the National Institutes of Health under award (R03CA162200 to B.P.). The content is solely the responsibility of the authors and does not necessarily represent the official views of the National Institutes of Health. The research was also supported in part by the German-Israeli Foundation (GIF) grant number 109433.2/2010 and by the Israeli Science Foundation (grant 04514831).
Conflict of Interest: none declared.
REFERENCES
- Altshuler D, et al. Integrating common and rare genetic variation in diverse human populations. Nature. 2010;467:52–58. doi: 10.1038/nature09298. [DOI] [PMC free article] [PubMed] [Google Scholar]
- Baran Y, et al. Fast and accurate inference of local ancestry in latino populations. Bioinformatics. 2012;28:1359–1367. doi: 10.1093/bioinformatics/bts144. [DOI] [PMC free article] [PubMed] [Google Scholar]
- Bercovici S, et al. Ancestry inference in complex admixtures via variable-length markov chain linkage models. Res. Comput. Mol. Biol. 2012;7262:12–28. doi: 10.1089/cmb.2012.0088. [DOI] [PMC free article] [PubMed] [Google Scholar]
- Bigham A, et al. Identifying signatures of natural selection in Tibetan and Andean populations using dense genome scan data. PLoS Genet. 2010;6 doi: 10.1371/journal.pgen.1001116. pii: e1001116. [DOI] [PMC free article] [PubMed] [Google Scholar]
- Brisbin A, et al. PCAdmix: principal components-based assignment of ancestry along each chromosome in individuals with admixed ancestry from two or more populations. Hum. Biol. 2012;84:343–364. doi: 10.3378/027.084.0401. [DOI] [PMC free article] [PubMed] [Google Scholar]
- Browning S, Browning BL. Rapid and accurate haplotype phasing and missing data inference for whole genome association studies using localized haplotype clustering. Am. J. Hum. Genet. 2007;81:1084–1097. doi: 10.1086/521987. [DOI] [PMC free article] [PubMed] [Google Scholar]
- Bryc K, et al. Genome-wide patterns of population structure and admixture among Hispanic/Latino populations. Proc. Natl Acad. Sci. 2010;107:8954–8961. doi: 10.1073/pnas.0914618107. [DOI] [PMC free article] [PubMed] [Google Scholar]
- Burchard EG, et al. Lower bronchodilator responsiveness in puerto rican than in mexican subjects with asthma. Am. J. Respir. Crit. Care Med. 2004;169:386–392. doi: 10.1164/rccm.200309-1293OC. [DOI] [PubMed] [Google Scholar]
- Fejerman L, et al. Admixture mapping identifies a locus on 6q25 associated with breast cancer risk in us latinas. Hum. Mol. Genet. 2012;21:1907–1917. doi: 10.1093/hmg/ddr617. [DOI] [PMC free article] [PubMed] [Google Scholar]
- Freedman ML, et al. Admixture mapping identifies 8q24 as a prostate cancer risk locus in African-American men. Proc. Natl Acad. Sci. 2006;103:14068–14073. doi: 10.1073/pnas.0605832103. [DOI] [PMC free article] [PubMed] [Google Scholar]
- Hinch AG, et al. The landscape of recombination in African Americans. Nature. 2011;476:170–175. doi: 10.1038/nature10336. [DOI] [PMC free article] [PubMed] [Google Scholar]
- Jarvis JP, et al. Patterns of ancestry, signatures of natural selection, and genetic association with stature in western african pygmies. PLoS Genet. 2012;8:e1002641. doi: 10.1371/journal.pgen.1002641. [DOI] [PMC free article] [PubMed] [Google Scholar]
- Jin W, et al. Genome-wide detection of natural selection in african americans pre-and post-admixture. Genome Res. 2012;22:519–527. doi: 10.1101/gr.124784.111. [DOI] [PMC free article] [PubMed] [Google Scholar]
- Johnson NA, et al. Ancestral components of admixed genomes in a mexican cohort. PLoS Genet. 2011;7:e1002410. doi: 10.1371/journal.pgen.1002410. [DOI] [PMC free article] [PubMed] [Google Scholar]
- Kolonel LN, et al. A multiethnic cohort in Hawaii and Los Angeles: baseline characteristics. Am. J. Epidemiol. 2000;151:346–357. doi: 10.1093/oxfordjournals.aje.a010213. [DOI] [PMC free article] [PubMed] [Google Scholar]
- Li JZ, et al. Worldwide human relationships inferred from genome-wide patterns of variation. Science. 2008;319:1100–1104. doi: 10.1126/science.1153717. [DOI] [PubMed] [Google Scholar]
- Martinez-Cruzado A, et al. Reconstructing the population history of Puerto Rico by means of mtDNA phylogeographic analysis. Am. J. Phys. Anthropol. 2005;128:131–155. doi: 10.1002/ajpa.20108. [DOI] [PubMed] [Google Scholar]
- Nelson M, et al. The population reference sample, POPRES: a resource for population, disease, and pharmacological genetics research. Am. J. Hum. Genet. 2008;83:347–358. doi: 10.1016/j.ajhg.2008.08.005. [DOI] [PMC free article] [PubMed] [Google Scholar]
- Pasaniuc B, et al. Inference of locus-specific ancestry in closely related populations. Bioinfvormatics. 2009;25:i213–i221. doi: 10.1093/bioinformatics/btp197. [DOI] [PMC free article] [PubMed] [Google Scholar]
- Pasaniuc B, et al. Enhanced statistical tests for GWAS in admixed populations: assessment using African Americans from CARe and a Breast Cancer Consortium. PLoS Genet. 2011;7:e1001371. doi: 10.1371/journal.pgen.1001371. [DOI] [PMC free article] [PubMed] [Google Scholar]
- Price AL, et al. Sensitive detection of chromosomal segments of distinct ancestry in admixed populations. PLoS Genet. 2009;5:e1000519. doi: 10.1371/journal.pgen.1000519. [DOI] [PMC free article] [PubMed] [Google Scholar]
- Sankararaman S, et al. Estimating local ancestry in admixed populations. Am. J. Hum. Genet. 2008;8:290–303. doi: 10.1016/j.ajhg.2007.09.022. [DOI] [PMC free article] [PubMed] [Google Scholar]
- Seldin M, et al. New approaches to disease mapping in admixed populations. Nat. Rev. Genet. 2011;12:523–528. doi: 10.1038/nrg3002. [DOI] [PMC free article] [PubMed] [Google Scholar]
- Shriner D, et al. Mapping of disease-associated variants in admixed populations. Genome Biol. 2011;12:223. doi: 10.1186/gb-2011-12-5-223. [DOI] [PMC free article] [PubMed] [Google Scholar]
- Sundquist A, et al. Effect of genetic divergence in identifying ancestral origin using HAPAA. Genome Res. 2008;18:676–682. doi: 10.1101/gr.072850.107. [DOI] [PMC free article] [PubMed] [Google Scholar]
- Tang H, et al. Reconstructing genetic ancestry blocks in admixed individuals. Am. J. Hum. Genet. 2006;79:1–12. doi: 10.1086/504302. [DOI] [PMC free article] [PubMed] [Google Scholar]
- Tang H, et al. Recent genetic selection in the ancestral admixture of Puerto Ricans. Am. J. Hum. Genet. 2007;81:626–633. doi: 10.1086/520769. [DOI] [PMC free article] [PubMed] [Google Scholar]
- Verdu P, Rosenberg N. A general mechanistic model for admixture histories of hybrid populations. Genetics. 2011;189:1413–1426. doi: 10.1534/genetics.111.132787. [DOI] [PMC free article] [PubMed] [Google Scholar]
- Waters KM, et al. Generalizability of associations from prostate cancer genome-wide association studies in multiple populations. Cancer Epidemiol. Biomarkers Prev. 2009;18:1285–1289. doi: 10.1158/1055-9965.EPI-08-1142. [DOI] [PMC free article] [PubMed] [Google Scholar]
- Yang JJ, et al. Ancestry and pharmacogenomics of relapse in acute lymphoblastic leukemia. Nat. Genet. 2011;43:237–241. doi: 10.1038/ng.763. [DOI] [PMC free article] [PubMed] [Google Scholar]
Associated Data
This section collects any data citations, data availability statements, or supplementary materials included in this article.