

Abstract
Recurrent glioblastomas (GBs) are highly aggressive tumors associated with a 6–8 mo survival rate. In this study, we evaluated the possible benefits of an immunotherapeutic strategy based on mature dendritic cells (DCs) loaded with autologous tumor-cell lysates in 15 patients affected by recurrent GB. The median progression-free survival (PFS) of this patient cohort was 4.4 mo, and the median overall survival (OS) was 8.0 mo. Patients with small tumors at the time of the first vaccination (< 20 cm3; n = 8) had significantly longer PFS and OS than the other patients (6.0 vs. 3.0 mo, p = 0.01; and 16.5 vs. 7.0 mo, p = 0.003, respectively). CD8+ T cells, CD56+ natural killer (NK) cells and other immune parameters, such as the levels of transforming growth factor β, vascular endothelial growth factor, interleukin-12 and interferon γ (IFNγ), were measured in the peripheral blood and serum of patients before and after immunization, which enabled us to obtain a vaccination/baseline ratio (V/B ratio). An increased V/B ratio for NK cells, but not CD8+ T cells, was significantly associated with prolonged PFS and OS. Patients exhibiting NK-cell responses were characterized by high levels of circulating IFNγ and E4BP4, an NK-cell transcription factor. Furthermore, the NK cell V/B ratio was inversely correlated with the TGFβ2 and VEGF V/B ratios. These results suggest that tumor-loaded DCs may increase the survival rate of patients with recurrent GB after effective tumor debulking, and emphasize the role of the NK-cell response in this therapeutic setting.
Keywords: IFNγ, NK cells, dendritic cells, glioblastoma, immunotherapy
Introduction
Glioblastoma (GB) is the most aggressive type of primary brain tumor. Limitations regarding surgery, stemming from anatomical localization of the tumor and from its infiltrative nature, coupled to the partial resistance to multiple radio- and chemotherapeutic approaches lead to inevitable tumor recurrence. The overall survival (OS) time of GB patients receiving the standard treatment, which consists of surgery, concomitant radiotherapy and six or more cycles of temozolomide (TMZ) is 14.6 mo.1 Several lines of evidence indicate that the immune system is capable of interacting with cancer cells to prevent their growth as well as to destroy established tumors.2 However, attempts at utilizing the immune system to treat established tumors are confronted with consistent limitations, largely due to the immunosuppressive environment generated by malignant cells.3 The induction of anti-GB immunity has been documented in vitro as well as in animal models.4 Results from several early clinical trials using dendritic cell (DC) vaccines to initiate antitumor immune responses were promising,5 indicating that antitumor immunity was induced in a fraction of patients and that immunological responders exhibited a prolonged survival rate as compared with control patients. Furthermore, increased levels of interferon γ (IFNγ) in the peripheral blood as well as in peripheral blood mononuclear cells (PBMCs) of GB patients have been associated with prolonged survival, and tumor debulking is known to decrease the expression of immunosuppressive cytokines such as transforming growth factor β (TGFβ).6,7 Severe side effects have never been associated with DC-based vaccines, and the quality of life of patients treated with this immunotherapeutic intervention has been deemed acceptable.8
Although several GB-associated antigens have been identified, it is possible that the use of whole tumor-cell products as antigens (i.e., lysates, tumor-eluted peptides or fusion products between DCs and GB cells) may reduce the risk of tumor escape due to antigen-loss variants. An example of such escape has been provided by the recent results of a clinical trial targeting a tumor-associated antigen created by a large deletion of the epidermal growth factor receptor (EGFR)-coding gene (EGFRvIII), which is expressed by 25–30% of GB patients. Vaccinated patients demonstrated an increased survival rate that was correlated with increased anti-EGFRvIII antibody titers. Notably, recurrent tumors were devoid of GB cells expressing EGFRvIII, due to tumor immunoediting.9
Most clinical studies have emphasized the role of CD8+ T cells in antitumor immune responses as elicited by DC-based immunotherapy.6,10 Although it has been suggested that CD56+ natural killer (NK) cells play a role in such responses,11 the capacity of these cells in exerting beneficial effects against gliomas (and possibly other tumors) has not been fully evaluated. NK cells are large, granular lymphocytes belonging to the innate immune system. Unlike T or B lymphocytes, NK cells do not possess rearranged T-cell receptors or immunoglobulin genes and instead kill target cells based on the absent expression of MHC class I molecules.12 DCs have been recognized as major players in the regulation/initiation of both innate and adaptive immunity.13,14 Moreover, resting NK cells can be primed by the production and trans-presentation of interleukin (IL)-15 by DCs.15
In this study, we report the results obtained with 15 patients affected by recurrent GB receiving a DC-based vaccine and stress the relevance of NK cells in inhibiting tumor growth in the context of DC-based immunotherapy.
Results
Generation of mature and functionally active DCs
Mononuclear cells were isolated from the circulating blood of patients using an apheresis unit. An average of 9.2 × 10⁹ cells was obtained (range 3.8–20.0 × 10⁹). The mean percentage of CD14+ cells was 17.9% (range: 8–40%), and the mean yield of CD14+ cells was 2.0 × 10⁹ (range: 0.5–3 × 10⁹). After immunomagnetic separation, cell viability was evaluated and the cells were characterized with anti-CD3 and anti-CD14 monoclonal antibodies by flow cytometry (data not shown). The purity of DCs was consistently greater than 85% (mean: 91.7 ± 1.0), and the monocyte-to-mature DC (mDC) conversion factor was 12.0 ± 4.0%.
The quality of DCs was controlled before maturation by measuring the expression of CD14, CD80, CD83, CD86 and HLA-DR. Both CD83 and the co-stimulatory molecules CD86 and CD80 were upregulated in mDCs (responding to pro-inflammatory cytokines) as compared with immature DCs (iDCs) (Table S1). In particular, the expression of the monocytic marker CD14 decreased from 43.5 ± 23.9% in iDCs to 12.2 ± 8.5% in mDCs upon pulsing with tumor-cell lysates (p = 10−5), and the expression of the CD83 marker increased from 7.1 ± 9.9% in iDCs to 65.1 ± 8.9% in mDCs after pulsing (p < 10−11). HLA-DR levels were consistently high. The viability of the final cell preparation was assessed by trypan blue exclusion and was consistently greater than 86%.
The generation of mature and functionally active tumor-cell lysate-loaded DCs was confirmed by a mixed lymphocyte reaction (MLR) and proliferation assay with [3H] thymidine (Fig. S1).
To rule out the presence of viable tumor cells in the lysates, experiments were performed to determine the optimal sonication time. Aliquots of the tumor homogenate did not grow in culture, and no tumor growth was detected in immunodeficient mice 6 mo after the sub-cutaneous injection of human tumor-cell lysates.
Tumor volume and Karnofsky Performance Score affect patient survival
The principal schedule and data related to vaccination and survival are shown in Figure 1A and Table 2. The median follow-up period was 8 mo (range: 5–51), after which all patients died. Patient 6 died of heart failure following disease progression and was assessed radiologically, whereas all other patients died upon tumor progression.

Figure 1. Tumor volume and Karnofsky Performance Score affected patient survival. (A) Treatment schema for patients 1–6 (top) and for patients 7–15 (bottom). (B) Kaplan-Meier analysis correlating tumor volume with progression-free survival (PFS) and overall survival (OS). Median PFS of patients with small (< 20 cm3) vs. large (≥ 20 cm3) tumors: 6 mo vs. 3 mo (n = 8 vs. n = 7; p = 0.01); median OS: 16.5 mo vs. 7 mo (n = 8 vs. n = 7; p = 0.003). (C) Kaplan-Meier analysis of the correlation between Karnofsky Performance Score (KPS) with PFS and OS. Median PFS of patients with high KPS (≥ 70, n = 9) vs. low KPS (< 70, n = 6): 5 mo vs. 2.5 mo (p = 0.005); median OS: 12.5 (high, n = 9) vs. 7 mo (low, n = 6) (p = 0.4).
Table 2. Outcomes of dendritic cell-based immunotherapy.
| Patient | No. of vaccinations | Amount of DCs (x106) | PFS (mts) | OS (mts) |
Adverse Events |
|---|---|---|---|---|---|
| 1 |
3 |
40 |
3 |
7.5 |
Anemia grade II, Fever, Cutaneous enduration at IS |
| 2 |
3 |
40 |
8 |
12.5 |
Fever, Cutaneous flushing at IS |
| 3 |
5 |
60 |
7 |
51 |
Anemia grade II, Fever, Cutaneous enduration at IS |
| 4 |
3 |
40 |
4.5 |
7 |
Fever, Cutaneous flushing at IS |
| 5 |
6 |
60 |
4 |
11.5 |
Cutaneous flushing at IS |
| 6 |
5 |
60 |
22 |
25 |
Fever, Cutaneous flushing at IS |
| 7 |
4 |
25 |
5 |
16.5 |
None |
| 8 |
4 |
25 |
1 |
5 |
None |
| 9 |
7 |
55 |
14 |
17.5 |
Hydrocephalus |
| 10 |
5 |
35 |
12 |
16.5 |
None |
| 11 |
5 |
35 |
2 |
7 |
Seizures, Cerebral edema |
| 12 |
5 |
35 |
2 |
7 |
Seizures |
| 13 |
4 |
25 |
3 |
6 |
None |
| 14 |
6 |
45 |
4 |
7 |
Seizures |
| 15 | 4 | 25 | 5 | 8 | Tumor bleeding |
DC, dendritic cell; IS, injection site; PFS, progression-free survival; OS, overall survival
Seven patients completed all scheduled vaccinations, and eight patients discontinued treatment after at least four vaccinations (one because of intratumoral bleeding before progression and seven because of disease progression). Six patients already demonstrated evidence of tumor progression at the time of the first vaccination. Four of the progressing patients (patients 6, 7, 9 and 10) were treated with bevacizumab (10 mg/kg every two weeks), one with lomustine (100 mg/m2 every 6 weeks) and one with temozolomide (150 mg/m2 every 4 weeks). The remaining patients received no further treatment.
At the time of the first vaccination, the median tumor volume was 18.6 cm3. We then used a threshold of 20 cm3 to identify patients with large tumors (volume ≥ 20 cm3) or small tumors (< 20 cm3). Seven patients had residual tumors < 20 cm3 and the remaining patients had tumors ≥ 20 cm3 (mean volume = 6.5 cm3, range: 0–18.2 cm3 vs. mean volume = 314.2 cm3, range: 32.5–732.7, respectively; p = 0.0203). Patient 9 had no residual tumor, according to magnetic resonance imaging (MRI).
Two months after the first vaccination, a clear increase in tumor volume (ranging from 180% to 620%) was observed in patients manifesting disease progression, whereas a slight increase in tumor volume (ranging from to 2.3% to 23%) occurred in most of the remaining patients. For the latter group, because the increase in tumor volume was < 25%, the disease was defined as stable according to the MacDonald criteria.
Nine months after the first vaccination, an MRI performed on patient 3 showed a 187% increase in tumor volume, indicating disease progression. Although the neurological condition of the patient was unchanged, she received two further vaccinations. Without changing the steroid dosage, 5 mo later, the tumor volume had decreased by 58% and remained unchanged for the following 30 mo.
Among all patients, the median OS was 8 mo (range: 5–107 mo). The OS at 6 and 12 mo (OS-6, OS-12) was 87% (95% CI: 69–103%) and 33% (95% CI: 9.5–57%), respectively. The median progression-free survival (PFS) was 4.4 mo (range: 1–22), and the PFS at 6 mo (PFS-6) was 27% (95% CI: 4.3–49%).
PFS and OS were not affected by the following clinical parameters: age > 40 y; age > 60 y; immunotherapy schedule; steroid dosage at the first vaccination and the presence of progression at the first vaccination (5.7 ± 4.1 mg vs. 0.5 ± 0.9 mg; p = 0.0036). Furthermore, patients with a tumor volume < 20 cm3 (PFS: p = 0.01; OS: p = 0.003) and a Karnofsky Performance Score (KPS) > 70 (PFS: p = 0.005; OS: p = 0.4,) survived longer than the rest of the patient cohort (Fig. 1B and C).
DC immunotherapy leads to NK-cell responses in a fraction of patients
The first vaccination led to an increase in the frequency of circulating NK cells in patients 2, 3, 6, 9, 10 and 14 (Fig. 2A), which further augmented after the second vaccination.

Figure 2. Patients with increased frequencies of natural killer (NK) cells showed an increased expression of E4BP4 and interferon γ. (A) The time course of NK-cell frequency evaluated by flow cytometry shows a significant increase in some patients (n = 6, blue line) but not in others (n = 8, red line). (B and C) The time course of E4BP4 and interferon γ (IFNγ) expression levels as evaluated by real-time PCR shows a significant increase in patients with increased NK-cell frequency (n = 3, blue line) but not in others (n = 6, red line) (*p < 0.01, **p < 0.001, ***p < 0.0001 vs. first vaccination). (D and E) Flow cytometry histograms of IFNγ production by CD3+CD8+ T cells and CD3-CD56+ NK cells from patient 9 and patient 11.
The peripheral blood lymphocytes (PBLs) of these patients exhibited increased expression levels of E4BP4 and interferon γ (IFNγ), as measured by real-time PCR (Fig. 2B and C). This increased expression was significant after the first vaccination. However, no changes in the percentages of NK cells and significant reductions in the expression levels of E4BP4 and IFNγ were observed in the other patients.
To define NK cells as the immune effector cells responsible for increased IFNγ expression, we performed intracellular staining on PBL samples. Flow cytometry was used to measure the production of IFNγ from CD8+ T cells and NK cells, although this evaluation could only be performed on 4 patients.
An example of one immune responder (patient 9) and one non-responder (patient 11) is shown in Figure 2D and E. We found that NK cells, but not CD8+ T cells, from patient 9 contributed to the upregulation of IFNγ expression as observed by real-time PCR. In patient 11, neither CD8+ T cells nor NK cells produced IFNγ after vaccination.
The complete immune monitoring of patient 9 and 11 is shown in Figure 3, and the corresponding MRI data are shown in Figure 4.

Figure 3. Time course of the immunological parameters observed for patient 9 (prolonged survival) and patient 11 (short survival). (A–F) Data for patient 9 (A–C) and patient 11 (D–F) are shown. Each time point represents the natural killer (NK) and CD8+ T-cell frequency; Interferon γ (ΙFNγ), E4BP4 and granzyme B expression levels as well as interleukin-12 (IL-12) serum levels are expressed as means ± SD (*p < 0.01, **p < 0.001, ***p < 0.0001).
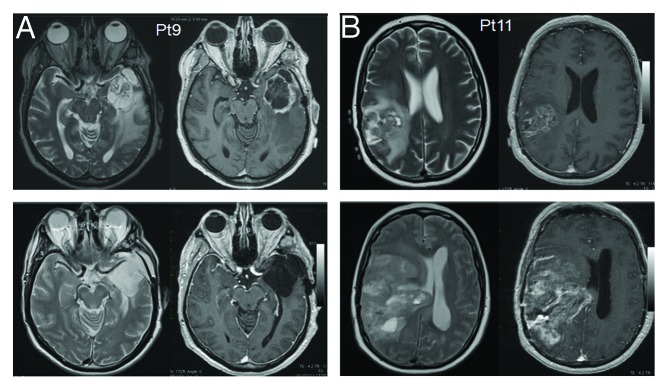
Figure 4. Magnetic resonance imaging of patient 9 (prolonged survival) and patient 11 (short survival). (A and B) MRI findings for patients 11 (disease progression) and 9 (stable disease) after 6 mo of follow-up. Axial T2W and post-contrast T1W images (right panels and left panels for each patient, respectively) are shown before surgery (upper panels) and 6 mo after the subtotal resection of the lesion and vaccination therapy (lower panels).
In patient 9 (prolonged survival), we also observed a rapid increase in CD3-CD56+ NK cells after the first vaccination. This primary expansion was followed by a slight decrease in the percentage of NK cells, perhaps corresponding to a primary NK-cell memory response, as suggested by the parallel increase in IL-12 (Fig. 3A). NK cells underwent a secondary expansion after the fourth vaccination, and, 24 weeks after the final vaccination, a constant percentage of NK cells remained. The increase in NK cells during immunotherapy was accompanied by increased E4BP4 expression, which was evaluated by real-time PCR (Fig. 3B). After the first vaccination, the upregulation of IFNγ was associated with a rise in NK (but not CD8+ T) cells (Fig. 3C). In this patient, there was also a slight increase in CD8+ T cells after the first vaccination and then a subsequent decrease, which was not influenced by further DC administrations. Furthermore, an increase in granzyme B after the fifth vaccination was associated with an increase in NK cells at the same time point (Fig. 3C).
In patient 11 (short survival), we did not observe changes in CD3-CD56+ NK cells, nor in E4BP4, IFNγ and granzyme B expression levels (as assessed by real-time PCR) upon vaccination (Fig. 3D-F). CD8+ T cells were also stable during treatment (Fig. 3F). Two other patients (patient 2 and 3) displayed increases in CD8+ T cells and NK cells. For patient 2, we performed the JAM assay to demonstrate specific cytotoxicity (Table S3; Fig. S2). The immune monitoring results of all of patients are reported in Table S3.
NK-cell frequency and other immunological parameters correlate with extended survival
To further investigate the efficacy of immunotherapy treatment, we correlated PFS and OS with NK-cell frequency and the serum levels of transforming growth factor (TGF)β1 and β2, vascular endothelial growth factor (VEGF) and IL-12. An increased vaccination/baseline (V/B) ratio of NK cells and a decreased V/B ratio of TGFβ2 (but not TGFβ1) and VEGF significantly correlated with patient survival (Fig. 5A-C). Specifically, PFS and OS were significantly longer in patients with a high NK cell V/B ratio and shorter in patients with high TGFβ2 and VEGF V/B ratios. The IL-12 V/B ratio was significantly correlated with PFS, but not OS (p = 0.035 and p = 0.4, respectively; data not shown), and CD8+ T cell responses did not influence the clinical outcome.
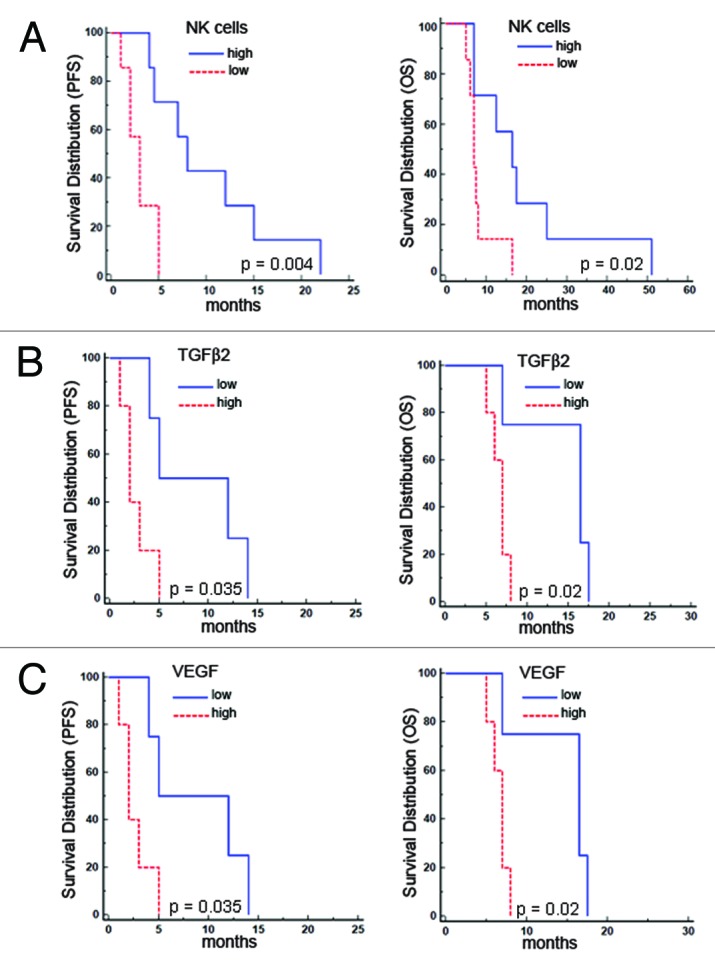
Figure 5. Patient survival correlated positively with the vaccination/baseline (V/B) ratio of natural killer-cell frequency and negatively with the V/B ratio of transforming growth factor β2 and vascular endothelial growth factor. (A–C) Kaplan-Meier analyses show the correlations with progression-free survival (PFS) and overall survival (OS) for the natural killer (NK)-cell V/B ratio (A) [median PFS: 8 mo (high, n = 7) vs. 3 mo (low, n = 7), p = 0.004; median OS: 16.5 mo (high, n = 7) vs. 7 mo (low, n = 7), p = 0.02] and transforming growth factor β2 (TGFβ2) and vascular endothelial growth factor (VEGF) V/B ratio (B and C) [median PFS 8.5 mo (low, n = 4) vs. 2 mo (high, n = 5), p = 0.035; median OS 16.5 mo (low, n = 4) vs. 7 mo (high, n = 5) p = 0.02].
In agreement with previous data, using the Spearman’s rank correlation test, we found statistically significant correlations between the following factors: (1) NK cells vs. TGFβ2 (p = 0.05) or VEGF (p = 0.02) V/B ratio; (2) TGFβ2 vs. VEGF (p = 0.007) or IL-12 (p = 0.01) V/B ratio and (3) VEGF vs. IL-12 (p = 0.04) V/B ratio.
A multivariate analysis of biological, clinical and radiological parameters that were found to influence PFS and OS in univariate analyses demonstrate that the NK cell V/B ratio is an independent factor influencing PFS (p = 0.04, RR 11.59; 95% CI: 1.09–122.3) and that tumor volume is an independent factor influencing OS (p = 0.02, RR 7.2; 95% CI: 1.26–41).
Discussion
As outlined in the introduction, a number of Phase I-II clinical studies based on DC-based vaccination in GB patients have been completed with promising results.5 Our data confirm several findings and reveal novel data, although several aspects warrant discussion and should be emphasized, including the quality of infused DCs, tumor size and the role of NK and CD8+ T cells.
Our protocol for DC preparation included the use of immunomagnetic separation with CliniMacs. As reported in previous works, this method facilitates a standardized preparation of DCs that are compatible with good manufacturing practice (GMP) standards.16,17
The degree of maturation, which is critical for the activation of T cells as mediated by the nuclear factor κB (NFκB),18 was evaluated according to the expression of the CD83 marker19 during the different stages of DC preparation (Table S2). However, DCs were not fully matured until their final state, as previous studies have shown that terminally differentiated DCs are less responsive to cytokine stimuli, such as IL-12.20 IL-12 is important for both the polarization of T-cell responses toward a TH1 profile and the generation of cytotoxic immune responses.21 In our experiments, prostaglandin E2 (PGE2) was added to the maturation cocktail to avoid the ex vivo production of IL-12, which may favor DC exhaustion.22 An ELISA assay performed on the supernatants from mature DCs confirmed the failure of these cells to produce IL-12 ex vivo (data not shown).
In terms of safety, the treatment was mostly well tolerated. In one patient, however, clinical and radiological findings indicated the presence of hydrocephalus. As we could not find evidence of any mechanical obstruction of cerebrospinal fluid circulation, we suspect that some degree of ependymitis was present in association with an extreme response to the treatment.
The tumor volume at the time of vaccination, as measured in T1-weighted images after contrast enhancement, was correlated with survival rates. As expected, patients with larger tumors required more dexamethasone during the first cycle of vaccination, which presumably had a negative impact on DC maturation and activity.23 The negative, dose-dependent influence of bulky GBs has previously been reported during DC immunotherapy.24 Moreover, antitumor immunity may develop more effectively in the presence of small tumors, a theory that has been mathematically modeled in the case of adoptive immunotherapy for GB.25
Patient follow-up data collected during this study provided much of the relevant immunological information. In two of the patients showing a PFS higher than the median value, we observed an increase in CD8+ T and NK cells following DC vaccination. In patients responding to treatment, however, the rise in NK, but not CD8+ T, cells was associated with prolonged survival. In a Phase I clinical trial based on autologous DCs loaded with a vector encoding the carcinoembryonic antigen (CEA), NK-cell responses following DC vaccination correlated more closely with the clinical outcome that T-cell responses. Furthermore, the activity and frequency of NK cells increased in patients with stable or absent disease, whereas anti-CEA T-cell responses were higher in patients undergoing disease progression.26 Studies using a murine model to compare the abilities of DCs and recombinant adenoviruses to elicit antitumor protection report that DCs provide consistent antitumor activity, as they can optimally engage NK cells as an additional effector mechanism.27 Interestingly, the initial results of a Phase I-II study of DC immunotherapy in 10 patients with high-grade gliomas point to an increased frequency of CD56+ NK cells after vaccination, although no correlation between such an increased frequency and survival was observed.11 The interaction between DCs and NK cells is very important in antitumor immunity. In particular, human DCs have been found to stimulate IFNγ secretion by NK cells via the production of IL-12.28,29 Furthermore, IFNγ production by NK cells is known to promote antigen processing and presentation to T cells as well as TH1 cell polarization.30
A fraction of GB cells may express stem cell programs, and these GB stem-like cells play a critical role in tumor perpetuation and resistance to treatment. TGFβ may be one important driver of self-renewal in these cells.31 In vitro studies have indicated that NK cells may target GB stem-like cells, as they express various ligands that activate NK-cell receptors but not MHC class I molecules.32
Overall, our findings as well as those from other studies recently reviewed by Lion et al.33 suggest that CD56+ NK cells play a positive role in GB. This hypothesis is further confirmed by the concomitant upregulation of IFNγ, the major cytokine released by NK cells,34 and E4BP4, a leucine zipper transcription factor that is essential for the development the NK cell lineage,35,36 observed in GB patients responding to our DC-based vaccination.
Furthermore, patients with increased NK-cell responses demonstrated decreased levels of TGFβ2. TGFβ is the major immunosuppressive cytokine produced by GB cells37 and may play a role in limiting the effector functions of NK and CD8+ T cells by downregulating the expression of NKG2D.38
In human retinal cells, TGFβ2 also regulates the expression of the pro-angiogenic factor VEGF.39 In our study, we found a significant correlation between the TGFβ2 and VEGF V/B ratios. Recently, the transcriptional profiling of human GB vessels suggested a key role for TGFβ2 and VEGF-A in vascular “abnormalization.”40 Thus, our observations as well as those from previous studies emphasize the relevance of the coupled regulation of TGFβ2 and VEGF expression in neo-angiogenesis and immune suppression.41,42
Our study also reported a significant, positive influence of NK-cell responses (i.e., high V/B NK cell ratio) on survival, particularly PFS, which is an interesting observation given that OS may be influenced by subsequent treatments, notably the anti-VEGF antibody bevacizumab. The patients who survived longer (patients 3 and 8), however, did show signs of CD8+ T cells responses. This intriguing finding suggests that CD8+ T cells may be involved in DC-mediated anti-glioma responses. The mechanisms that favored CD8+ T cell responses in these two patients remain unclear. Furthermore, recent data suggest that the genetic signature of GB may influence the outcome of DC immunotherapy,43 and systems biology tools may increase our understanding of the interactions between tumor cells and immune system, as recently reported.44 In particular, it is likely that systems vaccinology, which combines transcriptional profiling with flow cytometry, proteomics and transcriptomics, may allow for the identification of appropriate biomarkers that are associated with therapeutic immune responses.45,46
Encouraging data have emerged regarding the possibility that the combination of immunotherapy and chemotherapy might result in optimal antitumor responses, particularly T cell-based responses.47 In GB, the potential efficacy of combining immunotherapy with the anti-VEGF antibody bevacizumab, which has previously been shown to exert significant effects on recurrent GB,48 was highlighted by the observation that VEGF inhibits DC maturation and tumor-infiltration by lymphocytes.49,50 The anti-CTLA4 antibody ipilimumab may also result in increased T-cell responses when used in association with DC immunotherapy, as recent data provided indirect evidence that ipilimumab may permeate the blood brain barrier and have an effect on melanoma brain metastases.51 Furthermore, DC immunotherapy combined with temozolomide-based chemotherapy has provided promising results in the clinical setting. Temozolomide is already a part of the standard treatment for GB,52 and both preclinical observations and preliminary clinical data suggest that the combination of temozolomide with immunotherapy may result in the development of antitumor T cell responses.53,54
Material and Methods
Patients
Fifteen patients with relapsing GB were considered for this study. Patients 1–6 were treated on a compassionate basis. Patients 7–15 were included in a subsequent Phase I study that was authorized by national authorities and the local ethical committee, based on encouraging data obtained from patients 1–6. All of the patients provided informed consent, had a diagnosis of recurrent GB, underwent radiotherapy and chemotherapy, had a life expectancy of at least 3 mo and were not affected by autoimmune and infectious diseases. The clinical features of the patients are summarized in Table 1, and their main genetic features are summarized in Table S1. The median age at the time of vaccination was 46 y (range: 16–64), and the median KPS was 70 (range: 30–90). DC immunotherapy started after the third surgery in 4 patients, after the second surgery in 10 patients and at the time of MRI relapse in 1 patient (patient 6). After the first histological diagnosis of GB (according to WHO criteria), all patients received standard therapy, which consisted of conventional radiotherapy (standard dose 60 Gy) and chemotherapy (temozolomide according to Stupp’s protocol or nitrosoureas), followed by second- or third-line treatments (fotemustine, mitoxantrone, enzastaurine, diphtheria toxin). Within 72 h after the surgery, all patients were subjected to MRI examination with contrast enhancement. The exam showed residual tumors in 14/15 patients. Leukapheresis was performed within 4 weeks of the surgery. During this time, patients received a maintenance dose of glucocorticoids (4 to 12 mg of dexamethasone) and antiepileptic treatments.
Table 1. Patient characteristics.
| Patient | Age/Gender | Tumor size at 1st vaccination | Steroids at 1st vaccination | KPS | Previous Treatment* |
Other treatments before IT |
|---|---|---|---|---|---|---|
| 1 |
51/F |
> 20 cm3 |
12 mg |
30 |
S, R, C |
Fotemustine |
| 2 |
42/M |
> 20 cm3 |
8 mg |
70 |
S, R, C |
Diphtheric toxin |
| 3 |
64/F |
< 20 cm3 |
0 |
50 |
S, R, C** |
Fotemustine + mtx |
| 4 |
46/M |
> 20 cm3 |
2 |
90 |
S, R, C |
TMZ + Enzast |
| 5 |
17/F |
< 20 cm3 |
2 |
80 |
S, R, C*** |
None |
| 6 |
64/F |
< 20 cm3 |
0 |
90 |
S, R, C |
TMZ |
| 7 |
39/F |
< 20 cm3 |
36 gtt |
80 |
S, R, C |
None |
| 8 |
49/F |
> 20 cm3 |
4 mg |
50 |
S, R, C |
Ir + Bev |
| 9 |
56/M |
< 20 cm3 |
0 |
90 |
S, R, C |
None |
| 10 |
26/F |
< 20 cm3 |
0 |
90 |
S, R, C |
None |
| 11 |
56/M |
> 20 cm3 |
8 mg |
60 |
S, R, C |
TMZ mn + Tal |
| 12 |
58/F |
> 20 cm3 |
0 |
60 |
S, R, C |
Gliadel; Ir + Bev. |
| 13 |
56/M |
> 20 cm3 |
6 mg |
60 |
S, R, C |
PHA-848125AC |
| 14 |
54/M |
< 20 cm3 |
0 |
70 |
S, R, C |
TMZ+CCNU |
| 15 | 33/F | < 20 cm3 | 0 | 80 | S, R, C | None |
S, surgery; R, radiotherapy; C, chemotherapy; IT, immunotherapy; mtx, mitoxantron; enzast, enzastaurin; Ir, irinotecan; bev, bevacizumab; TMZ mn, metronomic temozolomide; Tal, thalidomide. *with TMZ, unless otherwise indicated; **with cisplatin plus bis-chloroethylnitrosourea; ***with cisplatin plus TMZ.
Clinical grade generation of DCs from peripheral blood
PBMCs were obtained from the circulating blood of patients (n = 15) without the administration of mobilizing treatments, using an apheresis unit (COBE Spectra System). The isolation of CD14+ monocytes was performed by immunomagnetic labeling of the target cells followed by automated separation using the CliniMACS® Technology (Miltenyi Biotec), according to the manufacturer’s instructions. The viability of immunoselected CD14+ cells was assessed using trypan blue and a Bürker cell counting chamber. Cells were stained with anti-human CD3 and CD14 monoclonal antibodies (BD Biosciences) for 30 min at 4°C, washed and analyzed using a FACSVantage or FACSCalibur flow cytometer (Becton Dickinson). CD14+ cells were cultured in Teflon bags (VueLife Teflon bags, CellGenix) up to a final concentration of 3 to 5 × 10⁶ cells/mL for 5 d at 37°C and 5% CO2. The CellGrow medium supplemented with 50 ng/mL granulocyte macrophage colony-stimulating factor (GM-CSF) and 20 ng/mL IL-4 (clinical grade products by CellGenix) was used for cell culture. On day 5, iDCs were cultured for 20–24 h with autologous tumor lysates (50 μg of protein/106 cells) in the presence of 50 μg/mL keyhole limpet hemocyanin (KLH from Calbiochem), 25 ng/mL GM-CSF and 10 ng/mL IL-4. DCs were matured with 1 μg/mL PGE2 (Pfizer) and 10 ng/mL clinical grade tumor necrosis factor α, 10 ng/mL clinical grade IL-1β and 800 U/mL clinical grade IL-6 (all from CellGenix) for 24 h. The viability of the final product was determined using trypan blue and a Bürker cell counting chamber. Cells with a viability ≥ 75% were used. The phenotype of cells was analyzed by flow cytometry using anti-human CD14, CD83, CD80, CD86 and HLA-DR monoclonal antibodies, following standard staining procedures.
Preparation of tumor-cell lysates
Portions of the tumor mass were dispersed using a disposable scalpel to produce single-cell suspensions. Large particles were removed by three consecutive centrifugations (5 min, 400 × g), and disaggregates tissues were passed through filters with decreasing pore sizes (70, 50 and 30 μm diameter, Filcons Becton Dickinson). Aliquots were taken for cell counting and viability staining using trypan blue exclusion and a Bürker cell counting chamber. The suspension was lysed by sonication using an ultrasonic cleaning unit (Elmasonic, Elma) for 90 min. The aliquots were plated for at least one week in RPMI medium to rule out cellular growth in culture. For a similar aim, the tumor-cell lysates (50 μg proteins) from patients 1–4 were injected subcutaneously into nude mice (3 mice per tumor). Protein content was determined using a MicroBCA assay (Pierce Biotechnology). Aliquots of the lysates were analyzed for sterility and the exclusion of adventitious viral contamination (adenovirus 5 and human herpesvirus I).
Safety tests
Before injection, mature DCs were tested to exclude bacterial, fungal, mycoplasma and adventitious viral contamination (adenovirus 5 and human herpesvirus I). In addition, endotoxin levels were evaluated and never exceed 2.86 IU/mL.
Vaccinations
After informed consent and approval of the Ethical Committee of the Istituto Neurologico Besta was obtained, DCs were prepared as described and cryopreserved in sterile 0.9% sodium chloride solution supplemented with 5% human albumin and 10% dimethylsulfoxide, using a controlled-rate freezing method (1 × 10⁷ DCs/mL/vial). Patients 1, 2, 3, 4 and 6 received three biweekly intradermal injections of 20 × 106 (first vaccination) and 10 × 106 DCs (second and third vaccinations). Patient 3 was treated with two further monthly injections (with 10 × 106 DCs each) 9 mo after the third vaccination. Patient 6 also received one further injection of 10 × 106 DCs at progression, which was 9 mo after the third vaccination. Patient 5, who was 17 years old at the time of recurrence, was treated at the Pediatric Hemato-oncology and Neuro-oncology University Hospital Gasthuisberg and received four weekly injections (with 10 × 106 DCs each) followed by two monthly vaccinations (with 10 × 106 DCs each).
Patients 7–15 were scheduled to receive seven vaccinations. Vaccinations 1–4 were given at 2-week intervals followed by two monthly vaccinations and a final vaccination 2 mo after the sixth vaccination. The first, fifth, sixth and seventh vaccines contained 10 × 106 DCs, while the other courses contained 5 × 10⁶ DCs.
Surface staining of PBMCs
The immune status and responses were assessed before the treatment, after each vaccination and at the end of the treatment. T-cell subsets were monitored by flow cytometry using anti-CD3-VioBlue, anti-CD4-FITC and anti-CD8-APC and anti-CD56-PE monoclonal antibodies (Miltenyi Biotec). The time course of the CD3+CD8+ T-cell and CD3−CD56+ NK-cell analyses, which were performed on whole blood, was monitored in 14 patients (not in patient 5). Briefly, 100 μL of whole blood was incubated with 10 μL of conjugated primary antibodies for 10 min at 4°C. The lysis of erythrocytes and the fixation of stained leukocytes were performed using the Uti-Lyse Erythrocyte Lysing Reagent (Dako) according to the manufacturer’s instructions for the “no wash” staining procedure. Acquisition analyses were performed using a MACSQuant analyzer and MACSQuantify Software (Miltenyi Biotec). An acquisition gate for lymphocytes was defined according to the side scatter vs. forward scatter parameters, and 5,000 events were acquired for each sample.
Intracellular staining of PBLs
PBLs from patients 9, 10, 11, 14 (frozen before and after each vaccination), were thawed and grown in RPMI 1640 containing 10% heat-inactivated FBS, 100 U/mL penicillin, 100 U/mL streptomycin, 100 μg/mL glutamine, 0.1 mM non-essential amino acids, 1 mM sodium pyruvate, 50 μM β-mercaptoethanol and 10 U/mL IL-2 (Roche). After 24 h, cells were stimulated for 6 h with 0.25 μM ionomycin and 10 ng/mL phorbol myristate acetate (PMA) in the presence of 10 U/mL IL-2 (Roche). Cell surface antigens were stained prior to fixation using anti-CD3-VioBlue, anti-CD8-APC and anti-CD56-PE primary antibodies (Miltenyi Biotec). The cells were then fixed and permeabilized using the BD Cytofix/Cytoperm solution (BD Biosciences) and intracellularly stained with an anti-IFNγ-FITC (Miltenyi Biotec) antibody according to the manufacturer’s instructions. The CD8+CD3+ and CD56+CD3− cells were gated and then analyzed by flow cytometry for IFNγ production.
JAM assays
In patient 2, enough tumor cells were available to evaluate tumor-specific effector responses using a JAM assay, which is a simple method that measures apoptosis-associated DNA fragmentation. PBLs were collected from this patient before after DC injection and were stimulated in vitro for 6 d with irradiated autologous tumor cells in the presence of 10 U/mL IL-2 (Roche). Cytotoxic activity was determined by the specific fragmentation of [3H]-labeled DNA in autologous tumor targets at different effector:target (E:T) ratios.
ELISA assays
Pre- and post-vaccination blood samples were collected from patients 7–15 into a serum separator tube containing no anti-coagulant. The serum levels of VEGF-A, TGFβ1, TGFβ2 and IL-12 were evaluated using specific ELISA kits from R&D Systems, according to the manufacturer’s instructions.
RNA extraction and real-time PCR
Total RNA from PBL samples was extracted using Trizol (Life Technologies) and reverse-transcribed using the High Capacity cDNA synthesis kit (Applied Biosystems-Life Technologies). The expression of E4BP4, granzyme B and IFNγ was analyzed by real-time PCR with the TaqMan method using an ABI PRISM 7900 real-time PCR system (Applied Biosystems). RNA from baseline PBL samples (Life Technologies) was used as a calibrator for the calculation of fold expression levels using the ΔΔCt method. The expression levels of target genes were normalized to the expression level of β2 microglobulin.
Magnetic resonance imaging (MRI)
MRI was scheduled within two days before the first vaccination, every 2 mo thereafter or when clinical conditions were worsening. MRI was performed using a 1.5T MR system (Siemens, Avanto) with an 8-channel head coil and the following settings: axial T1-weighted images with spin-echo (TE/TR = 9.1 ms/500 ms; FA = 70°; slice thickness = 5 mm; no gap; matrix = 187×256; FOV = 230×187 mm; number of NEX = 2); axial turbo spin-echo T2- and proton density-weighted images (TE/TR = 39–79 ms/3,500 ms; FA = 180°; slice thickness = 5 mm; no gap; matrix = 256×256; FOV = 240×240 mm; NEX = 1) and coronal FLAIR (TI = 2,500 ms; TE/TR = 121 ms/8,000 ms; FA = 150°; slice thickness = 5 mm; no gap; matrix = 149×320; FOV = 250×194 mm; NEX = 1). After the administration of the contrast medium (Gadovist, 0.1 mmol/kg), axial and 3D T1-weighted images (TE/TR = 4.24 ms/1,160 ms; FA = 15°; voxel size of 0.90×0.90×0.90, gap of 0.45 mm; matrix = 192×256; FOV = 230×172.5 mm; NEX = 1) were acquired.
Tumor volumes were determined on the 3D post-gadolinium T1-weighted images by manually outlining the enhancing portion of the lesion using MRIcro (www.mricro.com). To calculate the total enhancing volume of the tumor, the number of enhancing voxels was multiplied by the voxel size. Disease progression was defined according to the McDonald criteria (RANO criteria55 were not available when this study began).
Statistical analyses
Differences between immunological markers, clinical parameters or treatment responses were assessed using the Wilcoxon-Mann-Whitney test. The Wilcoxon signed rank test was used to test the significance of differences between markers at various time points. All p values were two-sided. The correlations between different immunological parameters were assessed using Spearman’s rank correlations.
The ratio of the third vaccination/baseline values (V/B ratio) of all of the immunological parameters for each patient was calculated, and the median of all of the observations was used as the cut off value to separate patients into the “low” or “high” groups.
PFS was calculated from the last surgery until disease progression and death/last follow-up, if censored. OS was calculated from the last surgery to death/last follow-up, if censored. The Kaplan-Meier analysis was used to estimate PFS and OS. The Log-rank test was used to test the differences in PFS or OS in patients with different clinical, radiological or immunological parameters.
A multivariate analysis and a Cox proportional hazard regression model analysis were performed on the variables showing statistically significant differences in univariate analyses, in order to investigate their independent prognostic role. All statistical analyses were performed using MedCalc version 12.3.
Supplementary Material
Acknowledgments
We thank Drs. Giovanni Broggi, Francesco Di Meco, Paolo Ferroli, Sergio Giombini, Marco Saini and Carlo L. Solero (department of Neurosurgery of Istituto Besta), Dr. Giuseppe Galli (Ospedale Cremona, Unit of Neurosurgery) and Dr. Maurizio Iacoangeli (Ospedali Riuniti Ancona, Unit of Neurosurgery) for their collaboration with the selection of patients involved in this study. We acknowledge the scientific support of Miltenyi Biotec and of Drs. Fulvio Baggi and Cinzia Gellera for setting up the protocol for the isolation of DCs and the help of Simona Pogliani for help with the DC preparations (Istituto Neurologico Besta). Dr. Maura Massimino (Istituto Nazionale Tumori, Milano) and Dr. Stefaan van Gool (Catholic University, Leuven, Belgium) provided critical help for the treatment of patient 5. This work was supported by grants from Il Fondo di Gio (Trieste) and the Ministero della Salute to G.F. The manuscript was edited by American Journal Experts.
Disclosure of Potential Conflicts of Interest
No potential conflicts of interest were disclosed.
Supplementary Material
Supplemental materials may be found here:
http://www.landesbioscience.com/journals/oncoimmunology/article/23401
Footnotes
Previously published online: www.landesbioscience.com/journals/oncoimmunology/article/23401
References
- 1.Stupp R, Mason WP, van den Bent MJ, Weller M, Fisher B, Taphoorn MJ, et al. European Organisation for Research and Treatment of Cancer Brain Tumor and Radiotherapy Groups. National Cancer Institute of Canada Clinical Trials Group Radiotherapy plus concomitant and adjuvant temozolomide for glioblastoma. N Engl J Med. 2005;352:987–96. doi: 10.1056/NEJMoa043330. [DOI] [PubMed] [Google Scholar]
- 2.Swann JB, Smyth MJ. Immune surveillance of tumors. J Clin Invest. 2007;117:1137–46. doi: 10.1172/JCI31405. [DOI] [PMC free article] [PubMed] [Google Scholar]
- 3.Zou W. Immunosuppressive networks in the tumour environment and their therapeutic relevance. Nat Rev Cancer. 2005;5:263–74. doi: 10.1038/nrc1586. [DOI] [PubMed] [Google Scholar]
- 4.Okada H, Kohanbash G, Zhu X, Kastenhuber ER, Hoji A, Ueda R, et al. Immunotherapeutic approaches for glioma. Crit Rev Immunol. 2009;29:1–42. doi: 10.1615/CritRevImmunol.v29.i1.10. [DOI] [PMC free article] [PubMed] [Google Scholar]
- 5.Finocchiaro G, Pellegatta S. Immunotherapy for glioma: getting closer to the clinical arena? Curr Opin Neurol. 2011;24:641–7. doi: 10.1097/WCO.0b013e32834cbb17. [DOI] [PubMed] [Google Scholar]
- 6.Yu JS, Liu G, Ying H, Yong WH, Black KL, Wheeler CJ. Vaccination with tumor lysate-pulsed dendritic cells elicits antigen-specific, cytotoxic T-cells in patients with malignant glioma. Cancer Res. 2004;64:4973–9. doi: 10.1158/0008-5472.CAN-03-3505. [DOI] [PubMed] [Google Scholar]
- 7.Wheeler CJ, Black KL, Liu G, Mazer M, Zhang XX, Pepkowitz S, et al. Vaccination elicits correlated immune and clinical responses in glioblastoma multiforme patients. Cancer Res. 2008;68:5955–64. doi: 10.1158/0008-5472.CAN-07-5973. [DOI] [PubMed] [Google Scholar]
- 8.Yamanaka R. Cell- and peptide-based immunotherapeutic approaches for glioma. Trends Mol Med. 2008;14:228–35. doi: 10.1016/j.molmed.2008.03.003. [DOI] [PubMed] [Google Scholar]
- 9.Sampson JH, Heimberger AB, Archer GE, Aldape KD, Friedman AH, Friedman HS, et al. Immunologic escape after prolonged progression-free survival with epidermal growth factor receptor variant III peptide vaccination in patients with newly diagnosed glioblastoma. J Clin Oncol. 2010;28:4722–9. doi: 10.1200/JCO.2010.28.6963. [DOI] [PMC free article] [PubMed] [Google Scholar]
- 10.Okada H, Kalinski P, Ueda R, Hoji A, Kohanbash G, Donegan TE, et al. Induction of CD8+ T-cell responses against novel glioma-associated antigen peptides and clinical activity by vaccinations with alpha-type 1 polarized dendritic cells and polyinosinic-polycytidylic acid stabilized by lysine and carboxymethylcellulose in patients with recurrent malignant glioma. J Clin Oncol. 2011;29:330–6. doi: 10.1200/JCO.2010.30.7744. [DOI] [PMC free article] [PubMed] [Google Scholar]
- 11.Yamanaka R, Abe T, Yajima N, Tsuchiya N, Homma J, Kobayashi T, et al. Vaccination of recurrent glioma patients with tumour lysate-pulsed dendritic cells elicits immune responses: results of a clinical phase I/II trial. Br J Cancer. 2003;89:1172–9. doi: 10.1038/sj.bjc.6601268. [DOI] [PMC free article] [PubMed] [Google Scholar]
- 12.Caligiuri MA. Human natural killer cells. Blood. 2008;112:461–9. doi: 10.1182/blood-2007-09-077438. [DOI] [PMC free article] [PubMed] [Google Scholar]
- 13.Fernandez NC, Lozier A, Flament C, Ricciardi-Castagnoli P, Bellet D, Suter M, et al. Dendritic cells directly trigger NK cell functions: cross-talk relevant in innate anti-tumor immune responses in vivo. Nat Med. 1999;5:405–11. doi: 10.1038/7403. [DOI] [PubMed] [Google Scholar]
- 14.Degli-Esposti MA, Smyth MJ. Close encounters of different kinds: dendritic cells and NK cells take centre stage. Nat Rev Immunol. 2005;5:112–24. doi: 10.1038/nri1549. [DOI] [PubMed] [Google Scholar]
- 15.Lucas M, Schachterle W, Oberle K, Aichele P, Diefenbach A. Dendritic cells prime natural killer cells by trans-presenting interleukin 15. Immunity. 2007;26:503–17. doi: 10.1016/j.immuni.2007.03.006. [DOI] [PMC free article] [PubMed] [Google Scholar]
- 16.Motta MR, Castellani S, Rizzi S, Curti A, Gubinelli F, Fogli M, et al. Generation of dendritic cells from CD14+ monocytes positively selected by immunomagnetic adsorption for multiple myeloma patients enrolled in a clinical trial of anti-idiotype vaccination. Br J Haematol. 2003;121:240–50. doi: 10.1046/j.1365-2141.2003.04270.x. [DOI] [PubMed] [Google Scholar]
- 17.Babatz J, Röllig C, Oelschlägel U, Zhao S, Ehninger G, Schmitz M, et al. Large-scale immunomagnetic selection of CD14+ monocytes to generate dendritic cells for cancer immunotherapy: a phase I study. J Hematother Stem Cell Res. 2003;12:515–23. doi: 10.1089/152581603322448222. [DOI] [PubMed] [Google Scholar]
- 18.Creusot RJ. NF-κB in DCs: it takes effort to be immature. Nat Med. 2011;17:1554–6. doi: 10.1038/nm.2586. [DOI] [PubMed] [Google Scholar]
- 19.Lechmann M, Berchtold S, Hauber J, Steinkasserer A. CD83 on dendritic cells: more than just a marker for maturation. Trends Immunol. 2002;23:273–5. doi: 10.1016/S1471-4906(02)02214-7. [DOI] [PubMed] [Google Scholar]
- 20.Gilboa E. DC-based cancer vaccines. J Clin Invest. 2007;117:1195–203. doi: 10.1172/JCI31205. [DOI] [PMC free article] [PubMed] [Google Scholar]
- 21.Tuyaerts S, Aerts JL, Corthals J, Neyns B, Heirman C, Breckpot K, et al. Current approaches in dendritic cell generation and future implications for cancer immunotherapy. Cancer Immunol Immunother. 2007;56:1513–37. doi: 10.1007/s00262-007-0334-z. [DOI] [PMC free article] [PubMed] [Google Scholar]
- 22.Boullart AC, Aarntzen EH, Verdijk P, Jacobs JF, Schuurhuis DH, Benitez-Ribas D, et al. Maturation of monocyte-derived dendritic cells with Toll-like receptor 3 and 7/8 ligands combined with prostaglandin E2 results in high interleukin-12 production and cell migration. Cancer Immunol Immunother. 2008;57:1589–97. doi: 10.1007/s00262-008-0489-2. [DOI] [PMC free article] [PubMed] [Google Scholar]
- 23.Matasić R, Dietz AB, Vuk-Pavlović S. Dexamethasone inhibits dendritic cell maturation by redirecting differentiation of a subset of cells. J Leukoc Biol. 1999;66:909–14. doi: 10.1002/jlb.66.6.909. [DOI] [PubMed] [Google Scholar]
- 24.Liau LM, Prins RM, Kiertscher SM, Odesa SK, Kremen TJ, Giovannone AJ, et al. Dendritic cell vaccination in glioblastoma patients induces systemic and intracranial T-cell responses modulated by the local central nervous system tumor microenvironment. Clin Cancer Res. 2005;11:5515–25. doi: 10.1158/1078-0432.CCR-05-0464. [DOI] [PubMed] [Google Scholar]
- 25.Kronik N, Kogan Y, Vainstein V, Agur Z. Improving alloreactive CTL immunotherapy for malignant gliomas using a simulation model of their interactive dynamics. Cancer Immunol Immunother. 2008;57:425–39. doi: 10.1007/s00262-007-0387-z. [DOI] [PMC free article] [PubMed] [Google Scholar]
- 26.Osada T, Clay T, Hobeika A, Lyerly HK, Morse MA. NK cell activation by dendritic cell vaccine: a mechanism of action for clinical activity. Cancer Immunol Immunother. 2006;55:1122–31. doi: 10.1007/s00262-005-0089-3. [DOI] [PMC free article] [PubMed] [Google Scholar]
- 27.Karimi K, Boudreau JE, Fraser K, Liu H, Delanghe J, Gauldie J, et al. Enhanced antitumor immunity elicited by dendritic cell vaccines is a result of their ability to engage both CTL and IFN gamma-producing NK cells. Mol Ther. 2008;16:411–8. doi: 10.1038/sj.mt.6300347. [DOI] [PubMed] [Google Scholar]
- 28.Vitale M, Della Chiesa M, Carlomagno S, Romagnani C, Thiel A, Moretta L, et al. The small subset of CD56brightCD16- natural killer cells is selectively responsible for both cell proliferation and interferon-gamma production upon interaction with dendritic cells. Eur J Immunol. 2004;34:1715–22. doi: 10.1002/eji.200425100. [DOI] [PubMed] [Google Scholar]
- 29.Borg C, Jalil A, Laderach D, Maruyama K, Wakasugi H, Charrier S, et al. NK cell activation by dendritic cells (DCs) requires the formation of a synapse leading to IL-12 polarization in DCs. Blood. 2004;104:3267–75. doi: 10.1182/blood-2004-01-0380. [DOI] [PubMed] [Google Scholar]
- 30.Raulet DH. Interplay of natural killer cells and their receptors with the adaptive immune response. Nat Immunol. 2004;5:996–1002. doi: 10.1038/ni1114. [DOI] [PubMed] [Google Scholar]
- 31.Fine HA. Glioma stem cells: not all created equal. Cancer Cell. 2009;15:247–9. doi: 10.1016/j.ccr.2009.03.010. [DOI] [PMC free article] [PubMed] [Google Scholar]
- 32.Castriconi R, Daga A, Dondero A, Zona G, Poliani PL, Melotti A, et al. NK cells recognize and kill human glioblastoma cells with stem cell-like properties. J Immunol. 2009;182:3530–9. doi: 10.4049/jimmunol.0802845. [DOI] [PubMed] [Google Scholar]
- 33.Lion E, Smits EL, Berneman ZN, Van Tendeloo VF. NK cells: key to success of DC-based cancer vaccines? Oncologist. 2012;17:1256–70. doi: 10.1634/theoncologist.2011-0122. [DOI] [PMC free article] [PubMed] [Google Scholar]
- 34.Tato CM, Martins GA, High FA, DiCioccio CB, Reiner SL, Hunter CA. Cutting Edge: Innate production of IFN-gamma by NK cells is independent of epigenetic modification of the IFN-gamma promoter. J Immunol. 2004;173:1514–7. doi: 10.4049/jimmunol.173.3.1514. [DOI] [PubMed] [Google Scholar]
- 35.Kamizono S, Duncan GS, Seidel MG, Morimoto A, Hamada K, Grosveld G, et al. Nfil3/E4bp4 is required for the development and maturation of NK cells in vivo. J Exp Med. 2009;206:2977–86. doi: 10.1084/jem.20092176. [DOI] [PMC free article] [PubMed] [Google Scholar]
- 36.Gascoyne DM, Long E, Veiga-Fernandes H, de Boer J, Williams O, Seddon B, et al. The basic leucine zipper transcription factor E4BP4 is essential for natural killer cell development. Nat Immunol. 2009;10:1118–24. doi: 10.1038/ni.1787. [DOI] [PubMed] [Google Scholar]
- 37.Hau P, Jachimczak P, Schlaier J, Bogdahn U. TGF-β2 signaling in high-grade gliomas. Curr Pharm Biotechnol. 2011;12:2150–7. doi: 10.2174/138920111798808347. [DOI] [PubMed] [Google Scholar]
- 38.Crane CA, Han SJ, Barry JJ, Ahn BJ, Lanier LL, Parsa AT. TGF-beta downregulates the activating receptor NKG2D on NK cells and CD8+ T cells in glioma patients. Neuro Oncol. 2010;12:7–13. doi: 10.1093/neuonc/nop009. [DOI] [PMC free article] [PubMed] [Google Scholar]
- 39.Bian ZM, Elner SG, Elner VM. Regulation of VEGF mRNA expression and protein secretion by TGF-beta2 in human retinal pigment epithelial cells. Exp Eye Res. 2007;84:812–22. doi: 10.1016/j.exer.2006.12.016. [DOI] [PMC free article] [PubMed] [Google Scholar]
- 40.Dieterich LC, Mellberg S, Langenkamp E, Zhang L, Zieba A, Salomäki H, et al. Transcriptional profiling of human glioblastoma vessels indicates a key role of VEGF-A and TGFβ2 in vascular abnormalization. J Pathol. 2012;228:378–90. doi: 10.1002/path.4072. [DOI] [PubMed] [Google Scholar]
- 41.Walshe TE, Dole VS, Maharaj AS, Patten IS, Wagner DD, D’Amore PA. Inhibition of VEGF or TGF-beta signaling activates endothelium and increases leukocyte rolling. Arterioscler Thromb Vasc Biol. 2009;29:1185–92. doi: 10.1161/ATVBAHA.109.186742. [DOI] [PMC free article] [PubMed] [Google Scholar]
- 42.Yang H, Huang Y, Chen X, Liu J, Lu Y, Bu L, et al. The role of CTGF in the diabetic rat retina and its relationship with VEGF and TGF-β(2), elucidated by treatment with CTGFsiRNA. Acta Ophthalmol. 2010;88:652–9. doi: 10.1111/j.1755-3768.2009.01641.x. [DOI] [PubMed] [Google Scholar]
- 43.Prins RM, Soto H, Konkankit V, Odesa SK, Eskin A, Yong WH, et al. Gene expression profile correlates with T-cell infiltration and relative survival in glioblastoma patients vaccinated with dendritic cell immunotherapy. Clin Cancer Res. 2011;17:1603–15. doi: 10.1158/1078-0432.CCR-10-2563. [DOI] [PMC free article] [PubMed] [Google Scholar]
- 44.Matsushita H, Vesely MD, Koboldt DC, Rickert CG, Uppaluri R, Magrini VJ, et al. Cancer exome analysis reveals a T-cell-dependent mechanism of cancer immunoediting. Nature. 2012;482:400–4. doi: 10.1038/nature10755. [DOI] [PMC free article] [PubMed] [Google Scholar]
- 45.Palucka K, Banchereau J. Cancer immunotherapy via dendritic cells. Nat Rev Cancer. 2012;12:265–77. doi: 10.1038/nrc3258. [DOI] [PMC free article] [PubMed] [Google Scholar]
- 46.Nakaya HI, Pulendran B. Systems vaccinology: its promise and challenge for HIV vaccine development. Curr Opin HIV AIDS. 2012;7:24–31. doi: 10.1097/COH.0b013e32834dc37b. [DOI] [PMC free article] [PubMed] [Google Scholar]
- 47.Galluzzi L, Senovilla L, Zitvogel L, Kroemer G. The secret ally: immunostimulation by anticancer drugs. Nat Rev Drug Discov. 2012;11:215–33. doi: 10.1038/nrd3626. [DOI] [PubMed] [Google Scholar]
- 48.Friedman HS, Prados MD, Wen PY, Mikkelsen T, Schiff D, Abrey LE, et al. Bevacizumab alone and in combination with irinotecan in recurrent glioblastoma. J Clin Oncol. 2009;27:4733–40. doi: 10.1200/JCO.2008.19.8721. [DOI] [PubMed] [Google Scholar]
- 49.Gabrilovich DI, Chen HL, Girgis KR, Cunningham HT, Meny GM, Nadaf S, et al. Production of vascular endothelial growth factor by human tumors inhibits the functional maturation of dendritic cells. Nat Med. 1996;2:1096–103. doi: 10.1038/nm1096-1096. [DOI] [PubMed] [Google Scholar]
- 50.Shrimali RK, Yu Z, Theoret MR, Chinnasamy D, Restifo NP, Rosenberg SA. Antiangiogenic agents can increase lymphocyte infiltration into tumor and enhance the effectiveness of adoptive immunotherapy of cancer. Cancer Res. 2010;70:6171–80. doi: 10.1158/0008-5472.CAN-10-0153. [DOI] [PMC free article] [PubMed] [Google Scholar]
- 51.Margolin K, Ernstoff MS, Hamid O, Lawrence D, McDermott D, Puzanov I, et al. Ipilimumab in patients with melanoma and brain metastases: an open-label, phase 2 trial. Lancet Oncol. 2012;13:459–65. doi: 10.1016/S1470-2045(12)70090-6. [DOI] [PubMed] [Google Scholar]
- 52.Stupp R, Mason WP, van den Bent MJ, Weller M, Fisher B, Taphoorn MJ, et al. European Organisation for Research and Treatment of Cancer Brain Tumor and Radiotherapy Groups. National Cancer Institute of Canada Clinical Trials Group Radiotherapy plus concomitant and adjuvant temozolomide for glioblastoma. N Engl J Med. 2005;352:987–96. doi: 10.1056/NEJMoa043330. [DOI] [PubMed] [Google Scholar]
- 53.Park SD, Kim CH, Kim CK, Park JA, Sohn HJ, Hong YK, et al. Cross-priming by temozolomide enhances antitumor immunity of dendritic cell vaccination in murine brain tumor model. Vaccine. 2007;25:3485–91. doi: 10.1016/j.vaccine.2006.12.060. [DOI] [PubMed] [Google Scholar]
- 54.Sampson JH, Aldape KD, Archer GE, Coan A, Desjardins A, Friedman AH, et al. Greater chemotherapy-induced lymphopenia enhances tumor-specific immune responses that eliminate EGFRvIII-expressing tumor cells in patients with glioblastoma. Neuro Oncol. 2011;13:324–33. doi: 10.1093/neuonc/noq157. [DOI] [PMC free article] [PubMed] [Google Scholar]
- 55.Wen PY, Macdonald DR, Reardon DA, Cloughesy TF, Sorensen AG, Galanis E, et al. Updated response assessment criteria for high-grade gliomas: response assessment in neuro-oncology working group. J Clin Oncol. 2010;28:1963–72. doi: 10.1200/JCO.2009.26.3541. [DOI] [PubMed] [Google Scholar]
Associated Data
This section collects any data citations, data availability statements, or supplementary materials included in this article.