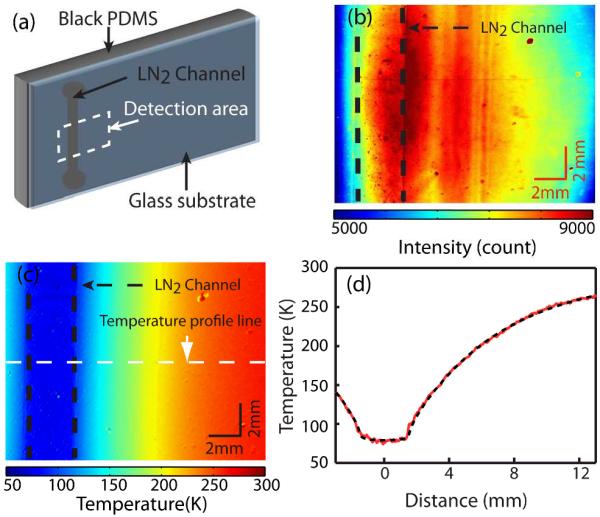
Fig. 4.

(a) Schematics of the cryo-cooling device. The imaging area is indicated by the dashed rectangle. (b) Color contour plot of the intensity 25 image (I650) from the device with liquid nitrogen flow in the channel. (c) Color contour plot of the temperature converted from the intensity ratio image. (d) Temperature line profile (solid) and the simulation result (dashed) at the location indicated in (c).
