

Abstract
Current drug therapy for metastatic renal cell cancer (RCC) results in temporary disease control but not cure, necessitating continued investigation into alternative mechanistic approaches. Drugs that inhibit chromatin-modifying enzymes involved in transcription repression (chromatin-relaxing drugs) could have a role, by inducing apoptosis, and/or through differentiation pathways. At low doses, the cytosine analogue decitabine can be used to deplete DNA methyl-transferase 1 (DNMT1), modify chromatin and alter differentiation without causing apoptosis (cytotoxicity). Non-cytotoxic regimens of decitabine were evaluated for in vitro and in vivo efficacy against RCC cell lines, including a p53 mutated RCC cell line developed from a patient with treatment refractory metastatic RCC. The cell-division permissive mechanism of action, absence of early apoptosis or DNA damage, increase in expression of HNF4α (a key driver associated with the mesenchymal to epithelial transition), decrease in mesenchymal marker expression, increase in epithelial marker expression, and late increase in cyclin dependent kinase inhibitor CDKN1B (p27) protein, was consistent with differentiation-mediated cell cycle exit. In vivo blood counts and animal weights were consistent with minimal toxicity of therapy. The distinctive mechanism of action of a dose and schedule of decitabine designed for non-cytotoxic depletion of DNMT1 suggests a potential role in treating RCC.
INTRODUCTION
Therapy targeted at vascular endothelial growth factor (VEGF) and mammalian target of rapamycin (mTOR) pathways now represents the standard of care in metastatic renal cell cancer (RCC) (reviewed in 1). Typically, resistance develops to treatment after 6–15 months 1. Although the mechanisms by which VEGF and mTOR pathway inhibitors produce temporary disease control are not completely understood, these agents may exercise much of their anti-tumor activity by antagonizing HIF-1α-mediated pro-angiogenic effects 1. Drugs with a different mechanism of action could complement these existing therapies to extend the period of disease control.
Agents that inhibit chromatin-modifying enzymes involved in transcription repression (chromatin-relaxing drugs) could have a role in treating RCC 2–4 (reviewed in 5). A number of downstream pathways have been implicated in mediating the anti-RCC effects of these drugs 2–5. Broadly speaking, the anti-proliferative effect could be mediated by apoptosis pathways, and/or by differentiation pathways. Effects of some classes of chromatin-relaxing drugs, such as histone deacetylase inhibitors (HDACi), that are not restricted to inhibition of chromatin-modifying enzymes, suggests that both apoptotic and differentiation pathways may mediate anti-tumor effects. Although the cytosine analogue decitabine, which depletes DNA methyl-transferase 1 (DNMT1) can also cause both apoptosis and alter differentiation 6, at low doses, decitabine can be used to modify chromatin 7 and alter differentiation without cytotoxicity 8–11. However, decitabine has not been evaluated in vitro and in vivo against RCC at a dose and schedule designed and verified for non-cytotoxic DNMT1 depletion, eventhough the ability of decitabine to activate expression of various methylated or immune-related genes in RCC cells has been evaluated 2–4,12. Furthermore, the possible role of mesenchymal to epithelial differentiation in mediating cell cycle exit in response to decitabine treatment has not been studied. Reasons for evaluating a non-cytotoxic decitabine regimen in RCC include the likelihood of less toxicity to normal stem cells (low concentrations of decitabine increase normal hematopoietic stem cell self-renewal 13–16) which could facilitate increased exposure to therapy (an important consideration with this S-phase specific agent), and differentiation mediated cell cycle exit which could be p53-independent and mechanistically distinct from existing therapy (the p53 pathway is frequently suppressed in malignant cells, including renal cancer cells 17,18).
Therefore, non-cytotoxic regimens of decitabine were evaluated for in vitro and in vivo effects in normal kidney epithelial cells and RCC cell lines, including a TP53 mutated RCC cell line developed from a patient with treatment refractory metastatic RCC. Gene and protein expression was examined in the treated cells to understand the pathway and mechanism for cell cycle exit, and to distinguish between apoptosis and differentiation based mechanisms. Blood counts and animal weights were used to assess toxicity of in vivo therapy. The results and mechanism of action information from these studies provide support for a mechanistically distinct approach to RCC therapy.
MATERIALS AND METHODS
Derivation and culture of the Ren-01 cell line
A 2 mm diameter biopsy from a patient with sunitinib- and bevacizumab-resistant metastatic RCC was implanted subcutaneously into the flank of an athymic nu/nu mouse. Over 4 wk the tumor grew to 10 mm diameter. The tumor was passaged serially into two additional mice. Tumor cells were dissociated in vitro and a cell line (Ren-01) was established. The line could be cryopreserved and thawed, and remained tumorigenic. Ren-01 were cultured in IMDM medium supplemented with 10%FBS and antibiotics (Penicillin/Streptomycin), initially seeding 1 x 10⁵ cells per well in 6 well plates (1 ml of medium per well). Cells were treated with decitabine on day1. Medium was changed every 2 days. Cells were split at 70% confluence using Trypsin/EDTA using standard protocols, followed by reseeding of the appropriate volume of cells. The cells used in these experiments had been passaged 5–7X.
Culture of other renal cancer cell lines
The RCC cell lines SK-RC-29, SK-RC-45, ACHN and RENCA, were cultured in RPMI-1640 with 10% FBS at 37°C in a humidified atmosphere with 5% CO2 in air. SK-RC-29 and SK-RC-45 cell lines were gifts from Dr. N.H. Banker at The New York Hospital-Cornell Medical Center 19. The ACHN cell line was established in our laboratory 20. RENCA were purchased from ATCC (Manassas, VA).
Derivation and culture of normal kidney epithelial cells
Kidney epithelial cells were isolated from surgical specimens obtained from patients undergoing nephrectomy for renal carcinoma. A 10 mm fragment of normal renal tissue was manually dissociated by mincing the fragment with scalpels while submerged in 10 mL medium in a 10 cm dish. Resultant cells were cultured in RPMI-1640 with 10% FBS at 37°C in a humidified atmosphere with 5% CO2 in air. After cell expansion for 1 week, aliquots of primary cells (p1) were frozen in liquid nitrogen for later use. The kidney epithelial cells generated in this manner are non-immortalized, non-tumorigenic in nude mice, and senesce after 20 – 30 passages.
Sequencing of TP53
PCR primers were designed to amplify all coding exons 3–11 and mRNA ORF sequence of TP53 (NM_000546.4). Genomic DNA and first strand cDNA was used as template for PCR amplification. Bidirectional sequencing was performed using ABI 3730xl DNA analyzer (Applied Biosystems, Foster City, CA). Primer sequences in table S1. Seqman software was used to analyze the sequences (DNASTAR, Madison, WI, USA)
In vitro treatment of cells with decitabine
Decitabine stock solution (5 mM) was generated by reconstituting lypholized decitabine in 100% methanol. Stock solution aliquots were stored at −80 °C for up to 3 weeks. Working solution was generated by diluting the stock solution 1:100 in PBS immediately before addition to the cells at a further dilution as per the intended final concentration. Similar amounts of methanol are added to untreated control cells. Cells were treated with decitabine (0.5 μM) on day 1, 4 and 7 of culture.
Immunofluorescence to measure DNMT1 levels and examine nuclear chromatin
Cells on cytospin slides were fixed and permeabilized with 10% formalin and 0.25% triton. Non specific binding sites were blocked with 10% normal goat serum and 6% BSA. Slides were incubated overnight with mouse anti-DNMT1 antibody (Abcam catalog number ab13537) (diluted 1:500 in blocking solution), followed by a 655 nm Quantum Dots™-conjugated goat anti-mouse antibody (Invitrogen catalog number Q11022MP) (diluted 1:500). Finally, cells were stained with 3 μM DAPI for 5 min before dehydration in graded alcohols and xylene.
DNA damage measurement by γH2AX staining
Phosphorylation of the histone H2A family member H2AX at Ser139 (γH2AX) was measured by flow cytometry. Cells were fixed with 2% paraformaldehyde and then permeabilized by adding ice cold 90% methanol solution. Cells were then incubated in blocking solution (0.5% BSA) containing saturating concentration of Alexa 488-conjugated γH2AX antibody (Cell signaling technology catalog number 9719). Percentage of γH2AX positive cells is analyzed by using a Coulter Epics XL-MCL flow cytometer equipped with CXP software (Beckman-Coulter).
Apoptosis detection
Apoptosis was detected by Annexin-V and 7AAD co-staining using the APOAF commercial kit (Sigma, St Louis, Mo). Cells (5x10⁵) were washed and incubated for 30 minutes with FITC-conjugated Annexin-V at room temperature. Cells were then resuspended in 400 mL of binding buffer containing 7AAD and immediately analyzed by flow cytometry.
PKH67 methods
PKH67 staining was performed following the labeling procedure provided by the manufacturer (Sigma, St Louis, Mo). Briefly, 107 cells were detached with 0.25% trypsin, washed once with RPMI 1640/10% FBS, and resuspended at the concentration of 2 x 10⁷/ml in diluent C. The cell suspension was gently mixed with 1 ml of a 20 3M PKH67 solution and incubated for 3 minutes at room temperature. Staining was stopped by addition of an equal volume (2 ml) of RPMI 1640/1% BSA for 1 min. In order to remove the excessive dye, cells were washed three times and then either analyzed by flow cytometry (day 0) or replated in RPMI 1640/10% FBS for further analysis at indicated times (days 1, 2, and 3).
Real time quantitative PCR (QRT-PCR)
mRNA levels were assayed by QRT-PCR using standard methods. GAPDH was amplified as control. Primer sequences in table S1. Real-time detection of the emission intensity of SYBR Green bound to double-stranded DNA was detected using the iCycler instrument (Bio-Rad). Data is reported as ‘relative expression value’ which was determined by raising 2 to the power of the negative value of delta-delta CT for each sample.
1D SDS-PAGE and Western Blotting
Approximately 50 μg of protein extracts, together with molecular weight markers, were subjected to 1D SDS-PAGE on 4–12% gradient gels (Invitrogen). After electrophoresis per manufacturer’s manual (Invitrogen), proteins were transferred to PVDF membranes (Millipore) at 35 constant voltage for 1 hour using Invitrogen’s semidry blotting apparatus. Western analyses of PVDF membranes utilized established protocols and antibodies for p15 (Cell Signaling, #4822), p21 (Cell Signaling, #2946), p27 (Cell Signaling, #3686), p57 (Cell Signaling #2557), p-p53 (Cell Signaling #92865), p53 (Sigma-Aldrich #P6874), DNMT1 (Abcam #Ab54759) and anti-β-Actin peroxidase (Sigma-Aldrich, #A3854).
Murine xenograft and in vivo therapy with decitabine
All experiments were approved by the Cleveland Clinic IACUC and followed approved procedures. Nude mice were inoculated sub-cutaneously (right and left flanks) with 1 x 10⁶ Ren-01 cells in 200 μL sterile vehicle. Nine days after inoculation (day 9), mice were initiated on treatment (4 mice each per treatment group) with decitabine 0.2 mg/kg administered sub-cutaneously (s.c.) 3 days per week, sunitinib (a multi-kinase [including VEGF pathway] inhibitor that is standard of care for metastatic RCC) 40mg/kg administered by oral gavage daily 5 days per week, the combination of decitabine and sunitinib, or mock treated with PBS administered s.c. Size of the xenograft was recorded twice a week using an electronic caliper, and volume estimated using the following equation: volume (mm3) = long (mm) x wide2 (mm) / 2. Mice developing tumors over 2,000 mm3 in size or showing signs of distress or necropsy in any area of the xenograft were euthanized for humanitarian reasons, using CO2 inhalation and followed by cervical dislocation. Tumor was harvested from the euthanized rodents for further analysis. The experiment was terminated when the mice from any experimental group were completely euthanized. Similar procedures were followed for experiments using RENCA, with the following differences: the inoculum consisted of 3 x 10⁶ RENCA cells. Decitabine treatment was initiated three days after the inoculation with tumor cells. Sunitinib was not a treatment.
Correlation of KI67 gene expression with GI50
Quality controlled raw data (Affymetrix CEL files or SOFT files) from previously published experiments (GEO Datasets GSE5846 21) were downloaded from Gene Expression Omnibus (GEO) datasets (www.ncbi.nlm.nih.gov/geo). KI67 22 gene expression data in eight renal cancer cell lines (786-0, A498, ACHN, CAKI-1, RXF 393, SN12C, TK-10 and UO-31) was correlated with GI50 data from the Developmental Therapeutics Program of the NCI [http://dtp.nci.nih.gov/index.html]. SAS statistical analysis software was used to generate scatter plots, Spearman and Pearson correlation coefficients.
Cytospin and Giemsa-staining
For morphology evaluation, the renal cancer cell lines were treated with 0.5μM DAC at day 1 and day 4 and harvested at day 7. Slides were spun down onto slides using a Shandon CytoSpin III Cytocentrifuge (Thermo Scientific) at 500 rpm for 5 minutes. After air drying, cells were fixed with 100% methanol for 1 minute then Giemsa-stained: Giemsa staining stock solution was diluted with PBS (pH6.5) at a ratio of 1:10, and the diluted Giemsa solution was added to cells for 30 minutes at room temperature. After rinsing and mounting of cover-slips, cell morphology was evaluated using an Olympus light microscope and CCD camera.
PCR and Pyrosequencing Assay for LINE-1 Methylation
Genomic DNA was isolated from RENCA tumor explants using the Wizard Genomic DNA Purification kit (#A1125, Promega) according to the manufacturer’s protocol. Bisulfite conversion of the genomic DNA was performed using the EZ DNA Methylation kit (#D5001, Zymo Research) according to the manufacturer’s protocols. Murine LINE-1 CpG methylation status was determined by pyrosequencing on the Qiagen PyroMark Q24 using PyroMark Gold Q24 reagents (Qiagen, Valencia, CA, USA) according to the manufacturer’s protocol. Sequence and methylation status analysis were performed using the PyroMark Q24 version 1.0.10 software in the CpG (methylation) analysis mode. Mouse LINE-1 Forward primer: TGGGATTTTAAGATTTTTGGTGAG, Reverse primer: CTTCCCTATTTACCACAATCTCAA (amplicon size 86 bp), annealing temperature: 60 °C. Sequencing primer: TTTTTGGTGAGTGGAATATA 23. The amount of C divided by the sum of the amounts of C and T at each CpG site was calculatedas percentage (ie, multiplied by 100).
Statistical analysis
Student’s t test was used to compare mean cell counts and relative expression values. Statistical comparisons involving more than two groups were carried out by one-way ANOVA with Dunnett multiple comparisons as post-hoc test. Differences were considered statistically significant when p < 0.05.
RESULTS
Decitabine (DAC) 0.5 μM depletes DNMT1 in Ren-01 cells without causing measurable DNA damage, apoptosis or senescence
Decitabine is a cytosine analogue, therefore, as per the class effect of nucleoside analogues, it can induce DNA damage and cytotoxicity. However, the sugar back-bone of decitabine is unmodified, and decitabine is rapidly cleaved and degraded by hydrolysis 24. Hence, decitabine is substantially less efficient at impeding DNA replication machinery and terminating DNA strand elongation than an equi-molar concentration of cytosine arabinoside (AraC), a cytosine analogue with prominent cytotoxic effects 8,9. Here, to support a non-cytotoxic DNMT1 depletion (and hence epigenetic) based mechanism of action when low concentrations of decitabine are used, we evaluated DNMT1 depletion, DNA damage, apoptosis and senescence induction in RCC cells treated with decitabine. Equimolar concentrations of the DNA damaging cytosine analogue cytarabine (AraC) was used as a control in these experiments, since decitabine and AraC are transported into cells and metabolized identically to generate nucleotide analogues that can incorporate into DNA.
DNMT1 was quantified in Ren-01 cells 48 hours after treatment with decitabine 0.5 μM. This concentration of decitabine produced a substantial decrease in DNMT1 levels (figure 1A). Twenty four hours after equimolar decitabine or AraC treatment, cells were harvested for flow cytometric measurement of phospho-H2AX levels as an index of DNA damage/repair. AraC produced a large increase in phospho-H2AX levels (figure 1B). In contrast, equimolar decitabine did not significantly increase phospho-H2AX levels (figure 1B). Apoptosis is associated with cell surface staining with Annexin. AraC treatment increased Annexin-V staining of Ren-01 cells (measured by flow-cytometry 24 hours after drug treatment) (figure 1C). In contrast, decitabine treated cells did not demonstrate an increase in Annexin-V staining (figure 1C). Another mechanism for cell cycle exit is senescence. Senescence is associated with distinctive patterns of chromatin clumping 25. Decitabine treatment of normal human fibroblasts induced chromatin changes associated with senescence (figure 1D). These chromatin changes were not seen in Ren-01 cells treated with decitabine (figure 1D).
Figure 1. Decitabine (DAC) 0.5 μM depletes DNMT1 in Ren-01 cells without causing significant DNA damage or apoptosis. A) DNMT1 depletion in Ren-01 cells treated with decitabine 0.5 μM.

Ren-01 cells (low passage number RCC cells) at <40% confluence were treated with decitabine 0.5 μM. DNMT1 was quantified 48 hours later by immuno-fluorescence (green dots). DAPI was used to stain nuclei (blue stain). B) This concentration did not produce measurable DNA damage in Ren-01 cells. 24h after DAC or AraC exposure DNA damage was measured by flow-cytometric assessment for phosphorylation of histone H2AX. Equimolar levels of AraC used as positive control. Grey histogram = isotype control. C) Decitabine 0.5 μM did not produce early apoptosis in Ren-01 cells. 24h after addition of DAC or AraC 0.5 μM, apoptosis was measured by flow-cytometric assessment for Annexin/7AAD staining of exposed phosphatidyl-serine. D) Decitabine produced chromatin changes associated with senescence in normal fibroblasts but not in Ren-01 cells. Normal human fibroblasts, but not Ren-01 cells, treated with decitabine undergo clumping changes in chromatin associated with senescence 25.
Decitabine, at concentrations that depleted DNMT1 without causing measurable DNA damage or apoptosis, decreased proliferation of RCC cells accompanied by gene and protein expression changes of epithelial and terminal differentiation
Gene expression and pathomorphological observations suggest that RCC cells may have an abnormal mesenchymal differentiation level 26–28. One potential mechanism of action by which chromatin-relaxing drugs may terminate proliferation of renal cancer cells is through restoration of more normal differentiation patterns, which would be expected to be accompanied by a decrease in mesenchymal markers and an increase in epithelial markers.
Early passage normal kidney epithelial cells, the freshly derived RCC cell line Ren-01 (a p53 mutated [figure S1] cell line derived from a patient with treatment refractory RCC), and the established RCC cell lines SK-RC-29, SK-RC-45 and ACHN, were treated with the concentration of decitabine that depleted DNMT1 without causing measurable apoptosis on day 1 and 4, or were mock treated with PBS. Normal kidney epithelial cells treated with decitabine continued to proliferate similar to vehicle treated control (figure 2A). In contrast, decitabine treatment decreased the rate of proliferation in the renal cancer cell lines (figure 2A).
Figure 2. Non-cytotoxic concentrations of decitabine decreased proliferation of RCC cells accompanied by gene and protein expression changes of epithelial and terminal differentiation. A) Normal kidney epithelial cells treated with decitabine continued to proliferate similar to vehicle treated control, in contrast, decitabine treatment decreased the rate of proliferation in Ren-01 and the other RCC cell lines.

Cells were treated in vitro with decitabine 0.5 μM on day 1, 4 or mock-treated with PBS. Cell counts by automated cell counter. Data points = mean cell count ± standard error. B) Decitabine treatment produced gene expression changes of epithelial differentiation in the RCC cell lines but not in normal kidney epithelial cells. mRNA expression measured by QRT-PCR 24 hours after decitabine treatment unless otherwise specified. HNF4α (hepatocyte nuclear factor 4α) = driver of kidney mesenchymal to epithelial transition. Fibronectin and Snail = mesenchymal markers. CK7 (cytokeratin 7), E-Cadherin and KSP-Cadherin (kidney specific cadherin) = epithelial markers. Blue bars = untreated control. Red bars = decitabine treated cells. Data points = mean expression value ± standard error. * = p<0.05. ** = p<0.01 (t-test).
In the normal kidney epithelial cells, decitabine treatment did not produce a significant change in the gene expression of hepatocyte nuclear factor 4α (HNF4α), a key DNA binding transcription factor associated with mesenchymal to epithelial transition 29, or in expression of the kidney epithelial markers cytokeratin 7 (CK7), epithelial cadherin (E-cadherin) and kidney-specific cadherin (Ksp-cadherin) (figure 2B). Expression of the mesenchymal marker fibronectin was increased, with a small increase in expression of the mesenchymal marker Snail (figure 2B). In contrast, in the RCC cell lines, decitabine treatment increased expression of the mesenchymal to epithelial differentiation driver HNF4α, increased expression of the epithelial markers CK7, E-cadherin (in 3 of 4 cell lines) and KSP-cadherin, and decreased expression of the mesenchymal markers Snail in 2 of 4 cell lines (figure 2B). The decrease in fibronectin levels was not statistically significant (figure 2B). Cells harvested on day 7 were stained with Giemsa to facilitate morphological examination. Normal kidney epithelial cells treated with decitabine resembled vehicle treated cells. However, RCC cell lines (SK-RC-29, SK-RC-45, ANHC, Ren-O1) treated with decitabine demonstrated increased size, decreased nuclear-cytoplasmic ratio and increased eosinophilic-staining of the cytoplasm compared to vehicle treated cells (figure 3).
Figure 3. Morphology of normal kidney epithelial cells and RCC cell lines treated with vehicle or decitabine.
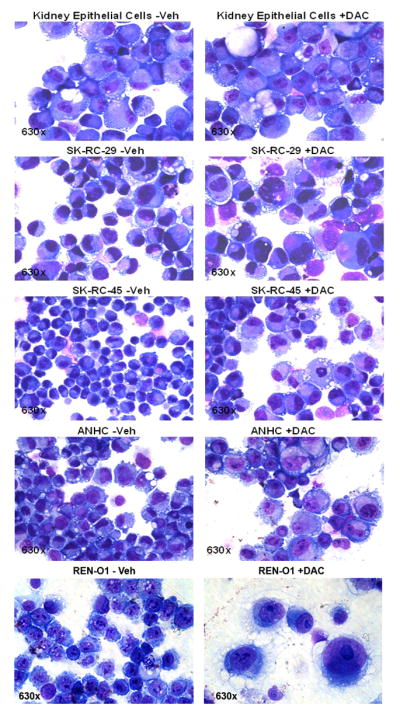
Vehicle or decitabine 0.5 μM was added on day 1 and day 4, cells were harvested and stained with Giemsa on day 7.
The gene expression changes suggest that the decrease in proliferation in the RCC cell lines could be mediated by epithelial differentiation associated cell cycle exit. Key components of the apoptosis and differentiation pathways that mediate cell cycle exit have been described. Apoptosis induced by anti-metabolite chemotherapy is associated with p53 serine-15 phosphorylation and upregulation of p53, cyclin dependent kinase inhibitor 1A (CDKN1A, p21) and CDKN2A (p16) 30–38. Differentiation mediated cell cycle exit is associated with upregulation of CDKN1C (p57) and CDKN1B (p27) 39–42. Protein levels of these key mediators of apoptotic and differentiation cell cycle exit was examined in Ren-01 cells at various time points (48 to 120 hours) after treatment with decitabine or AraC 0.5 μM.
With regards to apoptosis-associated events, AraC but not decitabine produced a significant increase in serine-15 phosphorylation of p53 and levels of total p53 (figure 4). Both decitabine and AraC increased p21/CDKN1A levels, with a larger increase produced by AraC (figure 4). p16/CDKN2A protein was not detected in Ren-01 cells despite using two separate antibody clones for detection (figure 4).
Figure 4. In Ren-01 cells, decitabine (DAC), but not AraC, depleted DNMT1 and increased p27/CDKN1B protein levels at late time-points.
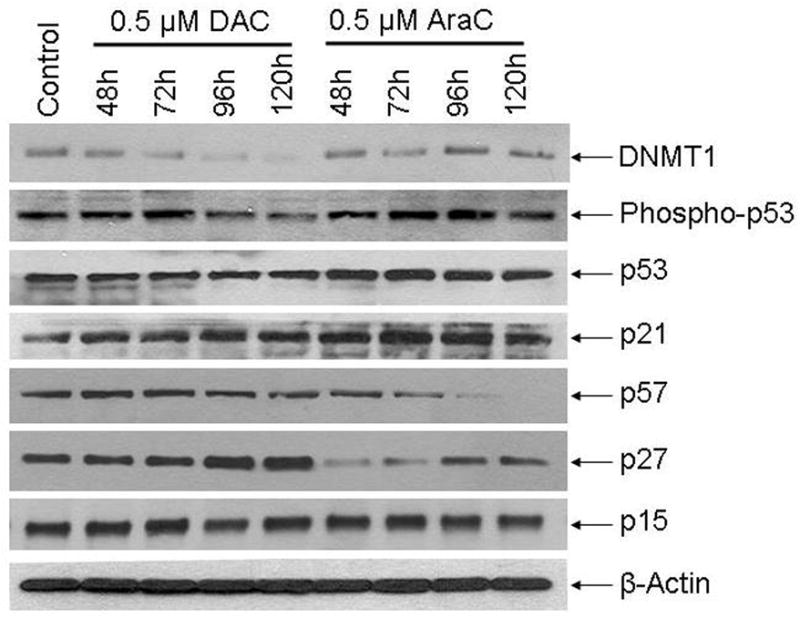
Protein levels measured by Western blot at the indicated time-points. DAC or AraC 0.5 μM was added to the cells at 0 h. Results with murine RCC cells (RENCA) in figure S2.
With regards to differentiation-associated events, only decitabine but not AraC increased levels of p27/CDKN1B, with the increase most prominent at late time points (figure 4). AraC decreased p57/CDKN1C levels (figure 4). p57/CDKN1C levels were unaffected by decitabine treatment (figure 4). Neither AraC nor decitabine affected p15/CDKN2B levels (figure 4). Decitabine but not AraC decreased levels of DNMT1 (figure 4).
Levels of DNMT1 and the above apoptosis and differentiation proteins were also examined in murine RCC cells (RENCA) treated with decitabine or AraC. As per Ren-01, the most prominent observation was DNMT1 depletion and p27/CDKN1B upregulation at late time-points in decitabine but not AraC treated cells (figure S2A, B).
Decitabine treated Ren-01 cells undergo temporary cell cycle arrest then resume cell division, unlike AraC treated cells which do not divide after treatment
The late upregulation of p27/CDKN1B suggests that cell cycle exit after decitabine treatment may be a late effect, with Ren-01 cells undergoing one or more cell divisions after decitabine treatment before eventual differentiation mediated cell cycle exit, unlike the immediate cell cycle exit associated with apoptosis-based therapy.
Ren-01 cell membranes were stained with the fluorescent marker PHK67 prior to decitabine or AraC 0.5 μM treatment. This cell surface stain is diluted on the cell surface corresponding to number of cell divisions. Compared to PBS treated control, decitabine produced a temporary cell cycle arrest followed by a resumption in cell division (figure 5). In contrast, AraC induced cell cycle arrest from which the Ren-01 cells did not recover (figure 5).
Figure 5. Decitabine treated Ren-01 cells undergo temporary cell cycle arrest then resume cell division, unlike AraC treated cells which do not divide after treatment.

Cell membranes were stained with PHK67 prior to decitabine or AraC treatment. Left shift in signal corresponds to cell division with a consequent decrease in stain intensity on individual daughter cells. Decitabine and AraC treatment one time addition of 0.5 μM.
Sensitivity of renal cancer cell lines to decitabine inversely correlates with the proliferative index
Since decitabine is S-phase specific, sensitivity to decitabine may depend on the proliferative index of RCC cells. In eight RCC cell lines (786-0, A498, ACHN, CAKI-1, RXF 393, SN12C, TK-10 and UO-31), the decitabine GI50 (the concentration of decitabine that produced 50% growth inhibition, GI50 data from the Developmental Therapeutics Program of the NCI [http://dtp.nci.nih.gov/index.html], gene expression data from GEO Datasets GSE5846 21) inversely correlated with the expression of KI67 (a proliferation marker expressed only in cycling cells; KI67 expression is widely used in clinical pathology as an index of proliferation in tumor tissue 22) (figure S3).
A non-cytotoxic dose and schedule of decitabine was well tolerated and decreased tumor volume in xenografted mice
The in vitro observations suggest that a decitabine dose intended for non-cytotoxic DNMT1 depletion could be efficacious therapy. The sensitivity of decitabine to the proliferative index suggests the importance of maximizing time of exposure (to increase the fraction of cancer cells that undergo cell division in the presence of decitabine). The lower dose of decitabine used for non-cytotoxic DNMT1 depletion may allow relatively frequent administration to increase time of exposure (3X/week). Although low dose decitabine can be non-cytotoxic, temporary cell cycle arrest (cytostasis) is likely still produced. Daily administration could prolong cytostasis and thereby cause or exacerbate cytopenia. Non-daily, but relatively frequent 1–3X/week administration is a stratagem to maximize cumulative exposure while minimizing consequences of cytostasis such as cytopenia. Similarly, sub-cutaneous administration may produce lower peak levels but extend the duration of exposure compared to intra-peritoneal administration of decitabine. These principles were tested using a xenograft model of human RCC.
Nude mice were inoculated sub-cutaneously (right and left flanks) with 1 x 10⁶ Ren-01 cells. Nine days after inoculation, mice were initiated on treatment with decitabine 0.2 mg/kg administered s.c. 3X/week, sunitinib (a multi-kinase [including VEGF pathway] inhibitor that is standard of care for metastatic RCC) 40mg/kg administered by oral gavage daily 5X/week, the combination of decitabine and sunitinib, or mock treated with PBS administered s.c. (4 mice each per treatment group).
This regimen of decitabine did not induce measurable DNA damage in the bone marrow of decitabine treated mice (measured by flow cytometric assessment of phospho-H2AX levels) (figure 6A). Murine weights in decitabine and sunitinib treated mice were similar, and decreased but not to significant extent compared with PBS treated mice. The largest decrease in murine weights was seen in mice treated with the combination of decitabine and sunitinib (figure 6B). No substantial differences in white blood cell, platelet or hemoglobin levels were noted between the different treatment groups, although there was a trend towards higher platelet counts in mice receiving decitabine (figure 6B) (increases in platelet counts are noted with low dose decitabine clinical therapy 10). The greatest decrease in tumor volume was produced by treatment with decitabine (figure 6C). On day 25 (after 2 weeks of treatment), the tumor volume in decitabine, sunitinib and combination treated mice was significantly decreased compared with PBS treated control mice (p values 0.003, 0.028, 0.048 respectively). Tumor explants were fixed and embedded in paraffin and evaluated histologically by hematoxylin and eosin staining. Decitabine treatment was associated with more extensive necrosis than treatment with sunitinib or the combination (figure 6C).
Figure 6. A non-cytotoxic metronomic regimen of decitabine (DAC) (0.2 mg/kg s.c. 3X/week) produced tumor regression in vivo.

Nude mice were inoculated sub-cutaneously (right and left flanks) with 1 x 10⁶ Ren-01 cells. Nine days after inoculation (day 9), mice were initiated on treatment (4 mice per treatment group) with DAC 0.2 mg/kg administered s.c. 3X/week, sunitinib 40mg/kg administered by oral gavage daily 5X/week, the combination of DAC and sunitinib, or mock treated with PBS administered s.c. A) DNMT1 depletion in Ren-01 explants without measurable bone marrow DNA damage. DNMT1 levels measured by immunofluorescence (green dots) analysis of tumor explant. DAPI (blue stain) of nuclei. DNA damage measured by phospho-H2AX staining of bone marrow aspirate cells in decitabine treated mice. B) This regimen of DAC was well tolerated with no significant weight loss and stable blood counts. Blood counts by Hemavet. C) DAC decreased tumor volume and increased tumor necrosis. Tumor necrosis estimated in blinded fashion from hematoxylin and eosin stained of paraffin embedded tumor explants. White arrows = areas of necrosis. Yellow arrows = areas of intact tumor tissue.
The decitabine regimen produced similar results when a different RCC cell line was used: nude mice were inoculated sub-cutaneously with 3 x 10⁶ RENCA cells. Decitabine 0.2 mg/kg administered s.c. 3X/week or PBS mock treatment was initiated on day 3. In vehicle treated mice, there was an exponential increase in tumor volume requiring early sacrifice of the mice (figure S2C). In decitabine treated mice, there was a substantially slower early increase in tumor volume followed by no further tumor growth (figure S2C). In a parallel experiment, RENCA tumor was explanted on day 21 from two vehicle and two decitabine treated mice, for evaluation of tumor DNMT1 by Western blot and DNA methylation by LINE-1 pyrosequencing. Compared to explants from vehicle treated mice, DNMT1 and DNA methylation levels were substantially decreased in explants from decitabine treated mice (figure S2D).
DISCUSSION
Both Wilms’ and non-Wilms’ tumor renal cancer cells have gene expression profiles with features of mesenchymal differentiation, instead of normal epithelial differentiation 26–28. This suggests an RCC model in which the self-renewal that drives expansion of the malignant clone derives from abnormal persistence, or acquisition of, an immature mesenchymal program (reviewed in 43). A corollary of this model is abnormal repression of the epithelial differentiation program. Repression of the epithelial differentiation program could be mediated epigenetically, even if genetic events are the upstream triggers for abnormal differentiation. Supporting a role for aberrant epigenetic repression in RCC oncogenesis, mutations in chromatin modifying enzymes that create epigenetic activation marks are a feature of RCC 44. The observations here, in which non-cytotoxic DNMT1 depleting concentrations of decitabine increased epithelial marker expression, decreased mesenchymal marker expression, and increased expression of p27/CDKN1B protein, the CDKN family member with a well documented role in mediating cell cycle exit with differentiation 39–42, are consistent with this model of RCC oncogenesis.
This non-cytotoxic epigenetic approach to therapy could complement existing therapy in a number of ways. Non-cytotoxic DNMT1 depletion with decitabine increases normal hematopoietic stem cell self-renewal and is well tolerated, even in subjects with co-morbidities 10,13–16,45. The mechanism of action is likely to be distinct from current VEGF and mTOR-targeted therapies. Rapamycin induced cell cycle exit was intact in p27 −/− cells 41. This suggests that mTOR targeted therapy and non-cytotoxic DNMT1 depletion could be anti-proliferative via different pathways. Moreover, the absence of early apoptosis, and the protein expression changes noted with decitabine treatment of the p53 mutated RCC cell line, suggests that differentiation mediated cell cycle exit may be independent of p53/apoptosis pathways that are frequently mutated or attenuated in malignant cells.
Decitabine was originally developed as a DNA-damaging cytotoxic agent 46. Therefore, in traditional phase 1 studies, doses were escalated to maximum tolerated levels. In fourteen RCC patients treated with pulse-cycled cytotoxic decitabine (75 mg/m2 administered intravenously over 1 hour every 7 hours for three doses, with cycles repeated every 5 weeks), there was no anti-tumor activity 47. Rationalizing the pharmacodynamic objective of therapy from cytotoxicity to non-cytotoxic DNMT1 depletion enables lowering of the dose to approximately 7.5 mg/m2 10, since DNMT1 depletion can be achieved with relatively low concentrations of decitabine. The resulting decrease in toxicity can enable more frequent administration to increase the time of exposure, a critical consideration with S-phase specific therapy (since increasing time of exposure will facilitate incorporation of drug into a greater fraction of the tumor cell population). S-phase dependence of decitabine could be a likely explanation for the decrease in efficacy observed with concurrent sunitinib (sunitinib may have had cytostatic effects on the RCC cells).
Decitabine has been investigated as a possible adjunct to immunotherapy, to reactivate expression of genes that could favor immune recognition and destruction of tumor 4,12. In a clinical trial examining the combination of decitabine and interleukin-2 to treat RCC and melanoma 12, the dose of decitabine was reduced to levels that are non-cytotoxic when administered one to three times per week 10. However, daily administration of this dose five days per week in weeks 1 and 2 of the twelve week cycles in this trial contributed to significant leucopenia. Although low dose decitabine can be non-cytotoxic, temporary cell cycle arrest (cytostasis) is likely still produced. Therefore, daily decitabine administration could prolong cytostasis and cause or exacerbate cytopenia. The non-daily, but relatively frequent 3X/week administration used in the xenograft model here was a stratagem to maximize cumulative exposure while minimizing consequences of cytostasis such as cytopenia. This type of decitabine dose and schedule has been used to treat non-malignant disease 10. A major side-effect was an increase in platelet counts during therapy, indicating minimal cytostatic/cytotoxic effects 10. As demonstrated here, extended cytostasis is not required for differentiation therapy of RCC. Indeed, the late increase in p27 expression (peaking at day 5 after decitabine treatment), the late reduction in cell proliferation and tumor xenograft size, and the observation that decitabine treated RCC cells can resume cell division (by day 2–3), suggest that differentiation mediated RCC cell cycle exit may occur after 1–2 cell divisions. The present in vitro and in vivo results suggest non-cytotoxic regimens similar to those used in non-malignant disease merit clinical study in RCC, however, responses may be more gradual than with conventional cytostatic/cytotoxic therapy.
The observations here provide in vitro and in vivo support for rationalizing dose and schedule of decitabine for non-cytotoxic epigenetic-differentiation therapy of RCC. The differentiation-based mechanism of action spares normal stem cells, appears to not depend on p53/apoptosis pathways, and facilitates greater exposure to therapy. This treatment, with a distinctive mechanism of action, could complement existing treatment options, and warrants further pre-clinical and clinical investigation.
Supplementary Material
Acknowledgments
Rebecca Haney for animal care assistance. Dr N.H. Banker at the The New York Hospital-Cornell Medical Center for the RCC cell lines SK-RC-29 and SK-RC-45. OA and KPN are supported by Scott Hamilton CARES. YS is supported by NIH (1R01CA138858, U54HL090513) and Dept. of Defense (PR081404).
Reference List
- 1.Rini BI, Atkins MB. Resistance to targeted therapy in renal-cell carcinoma. Lancet Oncol. 2009;10:992–1000. doi: 10.1016/S1470-2045(09)70240-2. [DOI] [PubMed] [Google Scholar]
- 2.Hagiwara H, Sato H, Ohde Y, Takano Y, Seki T, Ariga T, Hokaiwado N, Asamoto M, Shirai T, Nagashima Y, Yano T. 5-Aza-2′-deoxycytidine suppresses human renal carcinoma cell growth in a xenograft model via up-regulation of the connexin 32 gene. Br J Pharmacol. 2008;153:1373–1381. doi: 10.1038/bjp.2008.17. [DOI] [PMC free article] [PubMed] [Google Scholar]
- 3.Alleman WG, Tabios RL, Chandramouli GV, Aprelikova ON, Torres-Cabala C, Mendoza A, Rogers C, Sopko NA, Linehan WM, Vasselli JR. The in vitro and in vivo effects of re-expressing methylated von Hippel-Lindau tumor suppressor gene in clear cell renal carcinoma with 5-aza-2′-deoxycytidine. Clin Cancer Res. 2004;10:7011–7021. doi: 10.1158/1078-0432.CCR-04-0516. [DOI] [PubMed] [Google Scholar]
- 4.Coral S, Sigalotti L, Altomonte M, Engelsberg A, Colizzi F, Cattarossi I, Maraskovsky E, Jager E, Seliger B, Maio M. 5-aza-2′-deoxycytidine-induced expression of functional cancer testis antigens in human renal cell carcinoma: immunotherapeutic implications. Clin Cancer Res. 2002;8:2690–2695. [PubMed] [Google Scholar]
- 5.Pili R. Recent investigations of histone deacetylase inhibitors in renal cell carcinoma. Clin Adv Hematol Oncol. 2009;7:252–254. [PubMed] [Google Scholar]
- 6.Tuma RS. Epigenetic therapies move into new territory, but how exactly do they work? J Natl Cancer Inst. 2009;101:1300–1301. doi: 10.1093/jnci/djp342. [DOI] [PubMed] [Google Scholar]
- 7.Haaf T. The effects of 5-azacytidine and 5-azadeoxycytidine on chromosome structure and function: implications for methylation-associated cellular processes. Pharmacol Ther. 1995;65:19–46. doi: 10.1016/0163-7258(94)00053-6. [DOI] [PubMed] [Google Scholar]
- 8.Covey JM, D’Incalci M, Tilchen EJ, Zaharko DS, Kohn KW. Differences in DNA damage produced by incorporation of 5-aza-2′-deoxycytidine or 5,6-dihydro-5-azacytidine into DNA of mammalian cells. Cancer Res. 1986;46:5511–5517. [PubMed] [Google Scholar]
- 9.Schermelleh L, Haemmer A, Spada F, Rosing N, Meilinger D, Rothbauer U, Cardoso MC, Leonhardt H. Dynamics of Dnmt1 interaction with the replication machinery and its role in postreplicative maintenance of DNA methylation. Nucleic Acids Res. 2007;35:4301–4312. doi: 10.1093/nar/gkm432. [DOI] [PMC free article] [PubMed] [Google Scholar]
- 10.Saunthararajah Y, Hillery CA, Lavelle D, Molokie R, Dorn L, Bressler L, Gavazova S, Chen YH, Hoffman R, Desimone J. Effects of 5-aza-2′-deoxycytidine on fetal hemoglobin levels, red cell adhesion, and hematopoietic differentiation in patients with sickle cell disease. Blood. 2003;102:3865–3870. doi: 10.1182/blood-2003-05-1738. [DOI] [PubMed] [Google Scholar]
- 11.Halaban R, Krauthammer M, Pelizzola M, Cheng E, Kovacs D, Sznol M, Ariyan S, Narayan D, Bacchiocchi A, Molinaro A, Kluger Y, Deng M, Tran N, Zhang W, Picardo M, Enghild JJ. Integrative analysis of epigenetic modulation in melanoma cell response to decitabine: clinical implications. PLoS ONE. 2009;4:e4563. doi: 10.1371/journal.pone.0004563. [DOI] [PMC free article] [PubMed] [Google Scholar]
- 12.Gollob JA, Sciambi CJ, Peterson BL, Richmond T, Thoreson M, Moran K, Dressman HK, Jelinek J, Issa JP. Phase I trial of sequential low-dose 5-aza-2′-deoxycytidine plus high-dose intravenous bolus interleukin-2 in patients with melanoma or renal cell carcinoma. Clin Cancer Res. 2006;12:4619–4627. doi: 10.1158/1078-0432.CCR-06-0883. [DOI] [PubMed] [Google Scholar]
- 13.Milhem M, Mahmud N, Lavelle D, Araki H, Desimone J, Saunthararajah Y, Hoffman R. Modification of hematopoietic stem cell fate by 5aza 2′ deoxycytidine and trichostatin A. Blood. 2004;103:4102–4110. doi: 10.1182/blood-2003-07-2431. [DOI] [PubMed] [Google Scholar]
- 14.Chung YS, Kim HJ, Kim TM, Hong SH, Kwon KR, An S, Park JH, Lee S, Oh IH. Undifferentiated hematopoietic cells are characterized by a genome-wide undermethylation dip around the transcription start site and a hierarchical epigenetic plasticity. Blood. 2009;114:4968–4978. doi: 10.1182/blood-2009-01-197780. [DOI] [PubMed] [Google Scholar]
- 15.Suzuki M, Harashima A, Okochi A, Yamamoto M, Nakamura S, Motoda R, Yamasaki F, Orita K. 5-Azacytidine supports the long-term repopulating activity of cord blood CD34(+) cells. Am J Hematol. 2004;77:313–315. doi: 10.1002/ajh.20178. [DOI] [PubMed] [Google Scholar]
- 16.Hu Z, Negrotto S, Gu X, Mahfouz R, Ng KP, Ebrahem Q, Copelan E, Singh H, Maciejewski JP, Saunthararajah Y. Decitabine Maintains Hematopoietic Precursor Self-Renewal by Preventing Repression of Stem Cell Genes by a Differentiation-Inducing Stimulus. Mol Cancer Ther. 2010 doi: 10.1158/1535-7163.MCT-10-0191. [DOI] [PMC free article] [PubMed] [Google Scholar]
- 17.Gurova KV, Hill JE, Razorenova OV, Chumakov PM, Gudkov AV. p53 pathway in renal cell carcinoma is repressed by a dominant mechanism. Cancer Res. 2004;64:1951–1958. doi: 10.1158/0008-5472.can-03-1541. [DOI] [PubMed] [Google Scholar]
- 18.Roberts AM, Watson IR, Evans AJ, Foster DA, Irwin MS, Ohh M. Suppression of hypoxia-inducible factor 2alpha restores p53 activity via Hdm2 and reverses chemoresistance of renal carcinoma cells. Cancer Res. 2009;69:9056–9064. doi: 10.1158/0008-5472.CAN-09-1770. [DOI] [PMC free article] [PubMed] [Google Scholar]
- 19.Ebert T, Bander NH, Finstad CL, Ramsawak RD, Old LJ. Establishment and characterization of human renal cancer and normal kidney cell lines. Cancer Res. 1990;50:5531–5536. [PubMed] [Google Scholar]
- 20.Bauer JA, Morrison BH, Grane RW, Jacobs BS, Borden EC, Lindner DJ. IFN-alpha2b and thalidomide synergistically inhibit tumor-induced angiogenesis. J Interferon Cytokine Res. 2003;23:3–10. doi: 10.1089/10799900360520397. [DOI] [PubMed] [Google Scholar]
- 21.Lee JK, Havaleshko DM, Cho H, Weinstein JN, Kaldjian EP, Karpovich J, Grimshaw A, Theodorescu D. A strategy for predicting the chemosensitivity of human cancers and its application to drug discovery. Proc Natl Acad Sci USA. 2007;104:13086–13091. doi: 10.1073/pnas.0610292104. [DOI] [PMC free article] [PubMed] [Google Scholar]
- 22.Gerdes J, Schwab U, Lemke H, Stein H. Production of a mouse monoclonal antibody reactive with a human nuclear antigen associated with cell proliferation. Int J Cancer. 1983;31:13–20. doi: 10.1002/ijc.2910310104. [DOI] [PubMed] [Google Scholar]
- 23.Maegawa S, Hinkal G, Kim HS, Shen L, Zhang L, Zhang J, Zhang N, Liang S, Donehower LA, Issa JP. Widespread and tissue specific age-related DNA methylation changes in mice. Genome Res. 2010;20:332–340. doi: 10.1101/gr.096826.109. [DOI] [PMC free article] [PubMed] [Google Scholar]
- 24.Rogstad DK, Herring JL, Theruvathu JA, Burdzy A, Perry CC, Neidigh JW, Sowers LC. Chemical decomposition of 5-aza-2′-deoxycytidine (Decitabine): kinetic analyses and identification of products by NMR, HPLC, and mass spectrometry. Chem Res Toxicol. 2009;22:1194–1204. doi: 10.1021/tx900131u. [DOI] [PMC free article] [PubMed] [Google Scholar]
- 25.Narita M, Nunez S, Heard E, Narita M, Lin AW, Hearn SA, Spector DL, Hannon GJ, Lowe SW. Rb-mediated heterochromatin formation and silencing of E2F target genes during cellular senescence. Cell. 2003;113:703–716. doi: 10.1016/s0092-8674(03)00401-x. [DOI] [PubMed] [Google Scholar]
- 26.Tavares TS, Nanus D, Yang XJ, Gudas LJ. Gene microarray analysis of human renal cell carcinoma: the effects of HDAC inhibition and retinoid treatment. Cancer Biol Ther. 2008;7:1607–1618. doi: 10.4161/cbt.7.10.6584. [DOI] [PMC free article] [PubMed] [Google Scholar]
- 27.Hosono S, Luo X, Hyink DP, Schnapp LM, Wilson PD, Burrow CR, Reddy JC, Atweh GF, Licht JD. WT1 expression induces features of renal epithelial differentiation in mesenchymal fibroblasts. Oncogene. 1999;18:417–427. doi: 10.1038/sj.onc.1202311. [DOI] [PubMed] [Google Scholar]
- 28.Li CM, Guo M, Borczuk A, Powell CA, Wei M, Thaker HM, Friedman R, Klein U, Tycko B. Gene expression in Wilms’ tumor mimics the earliest committed stage in the metanephric mesenchymal-epithelial transition. Am J Pathol. 2002;160:2181–2190. doi: 10.1016/S0002-9440(10)61166-2. [DOI] [PMC free article] [PubMed] [Google Scholar]
- 29.Parviz F, Matullo C, Garrison WD, Savatski L, Adamson JW, Ning G, Kaestner KH, Rossi JM, Zaret KS, Duncan SA. Hepatocyte nuclear factor 4alpha controls the development of a hepatic epithelium and liver morphogenesis. Nat Genet. 2003;34:292–296. doi: 10.1038/ng1175. [DOI] [PubMed] [Google Scholar]
- 30.Wattel E, Preudhomme C, Hecquet B, Vanrumbeke M, Quesnel B, Dervite I, Morel P, Fenaux P. p53 mutations are associated with resistance to chemotherapy and short survival in hematologic malignancies. Blood. 1994;84:3148–3157. [PubMed] [Google Scholar]
- 31.Stirewalt DL, Kopecky KJ, Meshinchi S, Appelbaum FR, Slovak ML, Willman CL, Radich JP. FLT3, RAS, and TP53 mutations in elderly patients with acute myeloid leukemia. Blood. 2001;97:3589–3595. doi: 10.1182/blood.v97.11.3589. [DOI] [PubMed] [Google Scholar]
- 32.Andersen MK, Christiansen DH, Kirchhoff M, Pedersen-Bjergaard J. Duplication or amplification of chromosome band 11q23, including the unrearranged MLL gene, is a recurrent abnormality in therapy-related MDS and AML, and is closely related to mutation of the TP53 gene and to previous therapy with alkylating agents. Genes Chromosomes Cancer. 2001;31:33–41. doi: 10.1002/gcc.1115. [DOI] [PubMed] [Google Scholar]
- 33.Schoch C, Kern W, Kohlmann A, Hiddemann W, Schnittger S, Haferlach T. Acute myeloid leukemia with a complex aberrant karyotype is a distinct biological entity characterized by genomic imbalances and a specific gene expression profile. Genes Chromosomes Cancer. 2005;43:227–238. doi: 10.1002/gcc.20193. [DOI] [PubMed] [Google Scholar]
- 34.Akashi K, He X, Chen J, Iwasaki H, Niu C, Steenhard B, Zhang J, Haug J, Li L. Transcriptional accessibility for genes of multiple tissues and hematopoietic lineages is hierarchically controlled during early hematopoiesis. Blood. 2003;101:383–389. doi: 10.1182/blood-2002-06-1780. [DOI] [PubMed] [Google Scholar]
- 35.Suarez L, Vidriales MB, Garcia-Larana J, Sanz G, Moreno MJ, Lopez A, Barrena S, Martinez R, Tormo M, Palomera L, Lavilla E, Lopez-Berges MC, de Santiago M, de Equiza ME, Miguel JF, Orfao A. CD34+ cells from acute myeloid leukemia, myelodysplastic syndromes, and normal bone marrow display different apoptosis and drug resistance-associated phenotypes. Clin Cancer Res. 2004;10:7599–7606. doi: 10.1158/1078-0432.CCR-04-0598. [DOI] [PubMed] [Google Scholar]
- 36.Vazquez A, Bond EE, Levine AJ, Bond GL. The genetics of the p53 pathway, apoptosis and cancer therapy. Nat Rev Drug Discov. 2008;7:979–987. doi: 10.1038/nrd2656. [DOI] [PubMed] [Google Scholar]
- 37.Kim WY, Sharpless NE. The regulation of INK4/ARF in cancer and aging. Cell. 2006;127:265–275. doi: 10.1016/j.cell.2006.10.003. [DOI] [PubMed] [Google Scholar]
- 38.Gartel AL, Tyner AL. Transcriptional regulation of the p21((WAF1/CIP1)) gene. Exp Cell Res. 1999;246:280–289. doi: 10.1006/excr.1998.4319. [DOI] [PubMed] [Google Scholar]
- 39.Kiyokawa H, Kineman RD, Manova-Todorova KO, Soares VC, Hoffman ES, Ono M, Khanam D, Hayday AC, Frohman LA, Koff A. Enhanced growth of mice lacking the cyclin-dependent kinase inhibitor function of p27(Kip1) Cell. 1996;85:721–732. doi: 10.1016/s0092-8674(00)81238-6. [DOI] [PubMed] [Google Scholar]
- 40.Fero ML, Rivkin M, Tasch M, Porter P, Carow CE, Firpo E, Polyak K, Tsai LH, Broudy V, Perlmutter RM, Kaushansky K, Roberts JM. A syndrome of multiorgan hyperplasia with features of gigantism, tumorigenesis, and female sterility in p27(Kip1)-deficient mice. Cell. 1996;85:733–744. doi: 10.1016/s0092-8674(00)81239-8. [DOI] [PubMed] [Google Scholar]
- 41.Nakayama K, Ishida N, Shirane M, Inomata A, Inoue T, Shishido N, Horii I, Loh DY, Nakayama K. Mice lacking p27(Kip1) display increased body size, multiple organ hyperplasia, retinal dysplasia, and pituitary tumors. Cell. 1996;85:707–720. doi: 10.1016/s0092-8674(00)81237-4. [DOI] [PubMed] [Google Scholar]
- 42.Cheng T, Rodrigues N, Dombkowski D, Stier S, Scadden DT. Stem cell repopulation efficiency but not pool size is governed by p27(kip1) Nat Med. 2000;6:1235–1240. doi: 10.1038/81335. [DOI] [PubMed] [Google Scholar]
- 43.Hay ED. An overview of epithelio-mesenchymal transformation. Acta Anat(Basel) 1995;154:8–20. doi: 10.1159/000147748. [DOI] [PubMed] [Google Scholar]
- 44.Dalgliesh GL, Furge K, Greenman C, Chen L, Bignell G, Butler A, Davies H, Edkins S, Hardy C, Latimer C, Teague J, Andrews J, Barthorpe S, Beare D, Buck G, Campbell PJ, Forbes S, Jia M, Jones D, Knott H, Kok CY, Lau KW, Leroy C, Lin ML, McBride DJ, Maddison M, Maguire S, McLay K, Menzies A, Mironenko T, Mulderrig L, Mudie L, O’Meara S, Pleasance E, Rajasingham A, Shepherd R, Smith R, Stebbings L, Stephens P, Tang G, Tarpey PS, Turrell K, Dykema KJ, Khoo SK, Petillo D, Wondergem B, Anema J, Kahnoski RJ, Teh BT, Stratton MR, Futreal PA. Systematic sequencing of renal carcinoma reveals inactivation of histone modifying genes. Nature. 2010;463:360–363. doi: 10.1038/nature08672. [DOI] [PMC free article] [PubMed] [Google Scholar]
- 45.Saunthararajah Y, Molokie R, Saraf S, Sidhwani S, Gowhari M, Vara S, Lavelle D, DeSimone J. Clinical effectiveness of decitabine in severe sickle cell disease. Br J Haematol. 2008;141:126–129. doi: 10.1111/j.1365-2141.2008.07027.x. [DOI] [PubMed] [Google Scholar]
- 46.Sorm F, Vesely J. Effect of 5-aza-2′-deoxycytidine against leukemic and hemopoietic tissues in AKR mice. Neoplasma. 1968;15:339–343. [PubMed] [Google Scholar]
- 47.Abele R, Clavel M, Dodion P, Bruntsch U, Gundersen S, Smyth J, Renard J, van Glabbeke M, Pinedo HM. The EORTC Early Clinical Trials Cooperative Group experience with 5-aza-2′-deoxycytidine (NSC 127716) in patients with colo-rectal, head and neck, renal carcinomas and malignant melanomas. Eur J Cancer Clin Oncol. 1987;23:1921–1924. doi: 10.1016/0277-5379(87)90060-5. [DOI] [PubMed] [Google Scholar]
Associated Data
This section collects any data citations, data availability statements, or supplementary materials included in this article.