

Abstract
Biomarkers of Alzheimer's disease (AD) are increasingly important. All modern AD therapeutic trials employ AD biomarkers in some capacity. In addition, AD biomarkers are an essential component of recently updated diagnostic criteria for AD from the National Institute on Aging – Alzheimer's Association. Biomarkers serve as proxies for specific pathophysiological features of disease. The 5 most well established AD biomarkers include both brain imaging and cerebrospinal fluid (CSF) measures – CSF Abeta and tau, amyloid positron emission tomography (PET), fluorodeoxyglucose (FDG) PET, and structural magnetic resonance imaging (MRI). This article reviews evidence supporting the position that MRI is a biomarker of neurodegenerative atrophy. Topics covered include methods of extracting quantitative and semi quantitative information from structural MRI; imaging-autopsy correlation; and evidence supporting diagnostic and prognostic value of MRI measures. Finally, the place of MRI in a hypothetical model of temporal ordering of AD biomarkers is reviewed.
How are measures of neurodegenerative atrophy extracted from structural MRI images?
The topographic pattern of neurodegenerative atrophy in Alzheimer's disease (AD) captured by anatomic magnetic resonance imaging (MRI) mirrors that of neurofibrillary pathology (Braak and Braak, 1991; Whitwell et al., 2008a; Whitwell et al., 2007). Atrophy begins in and is ultimately most severe in the medial temporal lobe, particularly the entorhinal cortex and hippocampus, which is why these structures have been targeted in many MRI studies for diagnostic purposes. Atrophy later spreads to the inferior temporal lobe and paralimbic cortical areas. The transition from mild cognitive impairment (MCI) to full dementia is felt to be due to spread of degenerative atrophy to multi- modal association neocortices. Below is a brief survey of methods to extract and/or visualize this information from 3D MRI scans of cross-sectional and longitudinal studies (modified from (Vemuri, P and Jack, 2010)).
Cross-sectional Methods
1) Visual Assessment of scans
Visual assessment of the degree of atrophy in the medial temporal lobe is often used to assess disease severity and to add confidence in a clinical diagnosis of AD (Scheltens et al., 1992). Figure 1 shows the medial temporal lobe in cognitively normal elderly (CN), amnestic mild cognitive impairment (aMCI) and AD. While simple visual assessment is easily implemented and widely available, atrophy is a continuous process and this method does not lend itself to accurate or reproducible assessment of fine incremental grades of atrophy.
Figure 1.
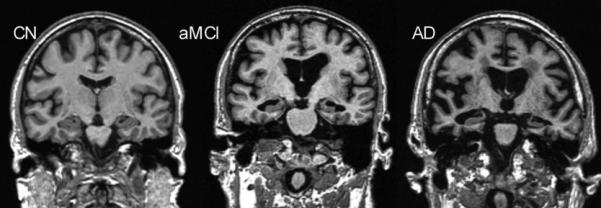
Progressive atrophy (especially medial temporal lobes) in elderly cognitively normal (CN), amnestic mild cognitive impairment (aMCI), and Alzheimer's disease (AD) subjects.
2) Quantitative ROI-based techniques
Manual tracing and quantifying the volume of medial temporal lobe structures e.g., the hippocampus or entorhinal cortex has been traditionally employed and provides an accurate quantitative measure of atrophy but is time consuming (Fox et al., 1996; Jack et al., 1992).
3) Automated and semi-automated techniques
Methods have been developed to automatically parcellate gray matter density (Tzourio-Mazoyer et al., 2002) or the thickness of cortical surfaces (Dale et al., 1999; Fischl et al., 2004) into regions of interest. This is computationally intensive but is reproducible and does not require manual intervention.
An advantage of measuring something like the hippocampus is that the measurements describe a known anatomic structure that (in the case of the hippocampus) is closely related to the pathological expression of the disease and is also functionally related to one of the cardinal early clinical symptoms – memory impairment. The disadvantage of using a single structure or region of interest (ROI) to consolidate 3D information is that it is topographically limited and does not make use of all the available information in a 3D MRI.
4) Quantitative Voxel Based
These methods assess atrophy over the entire three dimensional MRI scan.
5) Voxel-based analytic techniques
Methods such as voxel based morphometry (VBM) (Ashburner and Friston, 2000) are a popular and useful way to test for group-wise differences in the topography of atrophy. However, the statistical testing portion of VBM is not designed to provide diagnostic information at the single subject level.
6) Automated individual subject diagnosis
Several investigators have developed multivariate analysis and machine learning based algorithms which use the entire 3D MRI data to form a disease model against which individual subjects may be compared. A new incoming scan is scored based on the degree and the pattern of atrophy in comparison to the scans of a large database of well characterized subjects (Alexander and Moeller, 1994; Csernansky et al., 2000; Davatzikos et al., 2009; Fan et al., 2005; Kloppel et al., 2008; Stonnington et al., 2008; Vemuri, P. et al., 2008a). Such measures capture the severity of neuronal pathology, i.e., Braak staging, better than hippocampal volumes (Vemuri, P. et al., 2008b).
Longitudinal Methods
While change over time can be determined by simply measuring a volume independently on each scan in a series and performing arithmetic subtraction of the volumes, more sophisticated techniques have been developed to extract tissue loss information from serial MRI scans. In these techniques all MRI scans within a subject's time series are registered to each other and brain loss between scans is quantified as a measure of neurodegenerative disease progression.
1) Global atrophy quantification
One of the earliest methods developed to quantify the global change in brain volume between two scans was the boundary shift integral (BSI) (Fox and Freeborough, 1997; Freeborough and Fox, 1997). BSI determines the total volume through which the surface of the brain has moved between scans acquired at two time points, i.e., as the brain volume decreases and the volume of the ventricles increases.
2) Tensor based Morphometry (TBM)
Unlike BSI which only analyzes spatial shift in the brain surfaces, TBM provides three dimensional patterns of voxel-level brain degeneration (Chetelat et al., 2005; Thompson and Apostolova, 2007).
Evidence validating MRI as a neurodegenerative biomarker in AD
Evidence validating MRI as a neurodegenerative AD biomarker is reviewed below. Studies are classified on several criteria, including the method of measurement, numbers of subjects, and source of subjects. The ideal source is an epidemiological or population-based cohort. The next best option is a community based sample. The least desirable but most common source of data are referral samples, which have the highest risk of biases. Evidence validating MRI as an AD biomarker takes the form of several different types of studies: cross sectional clinical-MRI correlations; prediction of future clinical change; correlating change-over-time on serial MRI with concurrent change on clinical indices; and MRI-autopsy correlation.
1) Cross sectional clinical-MRI correlations
Many studies have been published describing the accuracy, sensitivity, specificity, or area under receiver operating characteristic curve (AUROC) with which clinically diagnosed AD subjects can be separated from cognitively normal elderly control subjects. This is the simplest type of data to acquire and hence this is the most frequent type of study found in the literature. This is the weakest category of validation data, since the gold standard against which the MRI is compared is a clinical diagnosis, which can be wrong. A clinical diagnosis is also available in the absence of any biomarker data. Accuracy ranges from 85% to 100%. Different methods have been employed as described above. The literature is too vast to describe each publication, but Table 1 contains some representative examples of studies demonstrating cross sectional separation of clinically diagnosed AD vs. controls. Results vary depending on measurement method, source of subjects, and statistical endpoints.
Table 1.
Cross Sectional Separation of Clinically Diagnosed AD vs. Controls
| Study | Subjects | Source of subjects | Measurement Method | Results |
|---|---|---|---|---|
| (Desikan et al., 2009) | CN 94, AD 65 | Referral sample | Ctx thickness, ERC + Hipp+ SupMarg Gyrus | AUROC 1.0 |
| (Gerardin et al., 2009) | CN 25, AD 23 | Referral sample ADNI | Hippocampal shape metric | Sensitivity 96%, specificity 92% |
| (Hinrichs et al., 2009) | CN 94, AD 89 | Referral sample ADNI | Multi voxel classifier | AUROC 0.88 |
| (Jack et al., 1992) | CN 22, AD 20 | Community sample | Manual Hippocampal volume adjusted for head size and age | Sensitivity 95%, specificity 95%, accuracy 89%, AUROC 0.92 |
| (Killiany et al., 2000) | CN 24, AD 16 | Referral sample | ERC, banks of sup temp sulcus, ant cingulate | Accuracy 100% |
| (Kohannim et al., 2010) | CN 213, AD 158 | Referral sample ADNI | Multi voxel classifier | AUROC 0.89 |
| (McEvoy et al., 2009) | CN 139, AD 84 | Referral sample ADNI | Ct thickness; medial and lateral temporal, isthmus cingulated orbitofrontal | Sensitivity 83%, specificity 93% |
| (Walhovd et al., 2010) | CN 42, AD 38 | Referral sample ADNI | Ct thickness | Accuracy 85% |
Key: AD, Alzheimer's disease; ADNI, Alzheimer's Disease Neuroimaging Initiative; AUROC, area under receiver operating characteristic curve; CN, cognitively normal.
A related class of studies is those that demonstrate cross sectional separation of clinically diagnosed controls vs. subjects with mild cognitive impairment. Mild cognitive impairment may have been defined using the formal diagnostic criteria for MCI outlined by Petersen et al (Petersen, R. C., 2004) or may have been defined using other criteria. Table 2 contains some representative examples of studies demonstrating cross sectional separation of clinically diagnosed controls vs. subjects with mild cognitive impairment using quantitative MRI measures. Results vary depending on measurement method, source of subjects, and statistical endpoints.
Table 2.
Cross Sectional Separation of Clinically Diagnosed Mild Cognitive Impairment vs. Controls
| Study | Subjects | Source of subjects | Measurement Method | Results |
|---|---|---|---|---|
| (Desikan et al., 2009) | CN 94, MCI 57 | Referral sample | Ctx thickness of ERC + Hipp+ SupMarg Gyrus | AUROC 0.95; sensitivity 90%, specificity 91% |
| (Gerardin et al., 2009) | CN 25, MCI 23 | Referral sample ADNI | Hippocampal shape metric | Sensitivity 83%, specificity 84% |
| (Kohannim et al., 2010) | CN 213, MCI 264 | Referral sample ADNI | Multi voxel classifier | AUROC 0.84 |
| (Xu et al., 2000) | CN 30, MCI 30 | Community sample | Hippocampal W score | Sensitivity 63%, specificity 80% |
Key: ADNI, Alzheimer's Disease Neuroimaging Initiative; AUROC, area under receiver operating characteristic curve.
2) Autopsy-MRI correlation
MRI-autopsy studies have convincingly validated that quantitative measurements of brain volume loss correlate with pathological indices of neurodegenerative severity. Hippocampal volumes measured from ante mortem MRI scans correlate with Braak neurofibrillary tangle pathologic staging in both demented and non-demented subjects (Gosche et al., 2002; Jack et al., 2002). Ante mortem hippocampal volume as well as rates of brain and hippocampal atrophy from MRI correlate with hippocampal neurofibrillary tangle density (Csernansky et al., 2004; Silbert et al., 2003) at autopsy. Excellent correlation is found between hippocampal volume measures obtained on either ante mortem MRI (Zarow et al., 2005) or post mortem MRI (Bobinski et al., 2000) and hippocampal neuron cell counts in autopsy specimens. On the basis of these imaging-to-pathology correlation studies, quantitative measures from structural MRI, such as hippocampal volume, are inferred to represent an approximate surrogate of the stage/severity of neuronal pathology – neuron loss, neuron shrinkage, and synapse loss – that occurs in AD. Voxel-wise studies of grey matter loss demonstrate that the topographic distribution of grey matter loss closely mirrors Braak and Braak spatial distribution of neurofibrillary pathology in subjects who have had ante mortem MRI and have come to autopsy (Figure 2). Fully automated multi voxel analysis methods demonstrate close correlation between quantitative ante mortem MRI and Braak staging, as depicted in Figure 3 with STructural Abnormality iNDex (STAND) scores.
Figure 2.
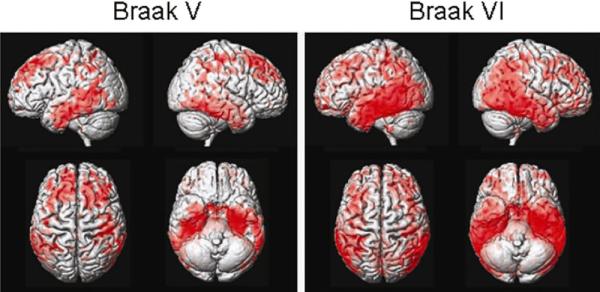
Topography of grey matter loss vs. Braak stage.
Figure 3.
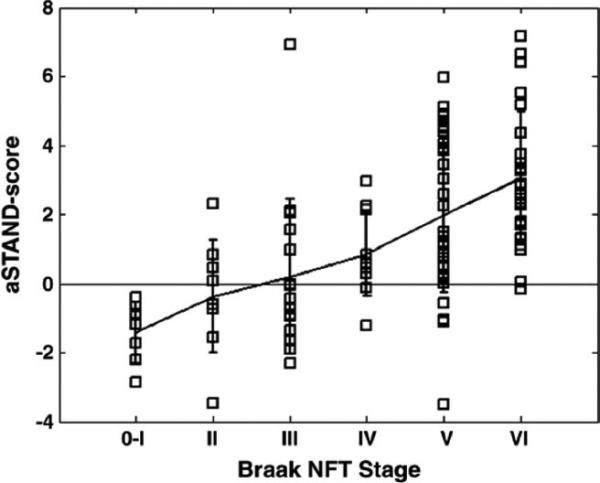
MRI STructural Abnormality iNDex (STAND) score vs. Braak stage.
We point out that while MRI measures of atrophy do scale with pathological indices of neurodegeneration, brain atrophy is not specific for AD. It occurs in other conditions that may be associated with cognitive impairment, such as cerebrovascular disease, hippocampal sclerosis, frontal temporal lobar degeneration, and head trauma (Jack et al., 2002; Jagust et al., 2008; Zarow et al., 2005).
3) Modeling of the longitudinal trajectory of AD with biomarkers – where does structural MRI fit?
Because different AD biomarkers provide information about different AD-related pathological processes, it stands to reason that comprehensive in vivo assessment of the disease requires information from different classes of biomarkers. Based on the assumptions that MRI provides an index of neurodegenerative pathologic burden (above) and PIB PET a measure of amyloid plaque burden, a model of AD has been proposed in which the rate of amyloid deposition and the rate of neurodegeneration later in life are dissociated. The presence of brain amyloidosis is necessary but not sufficient to produce cognitive decline; the neurodegenerative component of AD pathology is the immediate substrate of cognitive impairment, and the rate of cognitive decline is driven by the rate of neurodegeneration. In this proposed model, amyloid deposition is dynamic early in the disease process (presymptomatically) while neurodegeneration is dynamic in the mid to late stage. This Amyloid and Neurodegeneration model (Jack et al., 2009) is reproduced in Figure 4. In the model, the lifetime course of the disease is divided into clinically defined pre-symptomatic, early symptomatic (MCI), and dementia phases. Neurodegeneration, detected by atrophy on volumetric MRI, is indicated by a dashed line. Cognitive function is indicated by a dot-dash line. Amyloid deposition, detected by PIB, is indicated by a solid line later in the course of AD (i.e., that portion of the disease for which PiB data is now available). The time course of Aβ42 deposition early in life is represented as two possible theoretical trajectories (dotted lines), reflecting uncertainty about the time course of early PIB signal.
Figure 4.
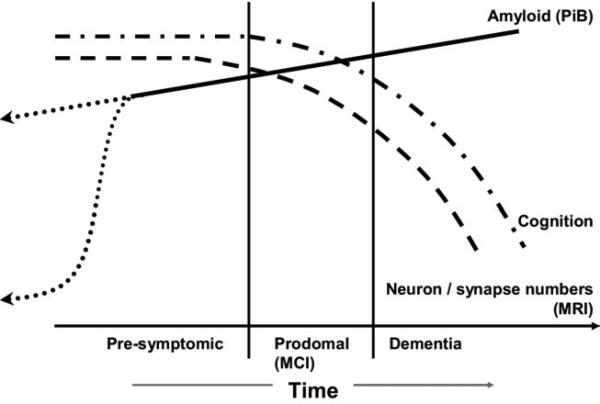
Amyloid and neurodegeneration model. Abbreviations: PIB, Pittsburgh Compound B; MCI, mild cognitive impairment; MRI, magnetic resonance imaging. Modified from Jack et al., 2009.
An expanded version of this disease biomarker model (Jack et al., 2010a) incorporates the five most well validated AD biomarkers into a comprehensive sequence of pathological events as subjects progress from cognitively normal in middle age to dementia in older age. There are presently five well-accepted biomarkers of AD. Both CSF Aβ42 and amyloid PET imaging are biomarkers of Aβ plaque deposition. CSF tau is an indicator of tau pathology and associated neuronal injury. FDG PET measures AD mediated neuronal dysfunction, while structural MRI measures AD-mediated neurodegeneration. This model rests on the assumption that these five AD biomarkers become abnormal in a sequential manner, but their time courses also overlap. The hypothesis is that amyloid PET imaging and CSF Aβ42 become abnormal first, perhaps as much as 20 years before the first clinical symptoms appear. CSF tau and FDG PET become abnormal later and structural MRI is the last of the five major biomarkers to become abnormal. CSF tau, FDG PET and structural MRI correlate with clinical symptom severity while CSF Aβ42 and amyloid PET imaging may not. The hypothesis is that together these five biomarkers of AD are able to stage the complete trajectory of AD, which may span as much as 20-30 years or more in affected individuals. Figure 5 illustrates this expanded model (Jack et al., 2010a).
Figure 5.
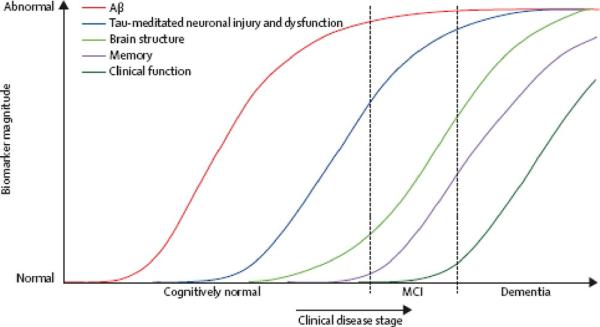
Expanded model with 5 biomarkers. Aβ, amyloid-beta; MCI, mild cognitive impairment. Modified from Jack et al., 2010a.
4) Use of MRI in Therapeutic trials
MRI is used in several different ways in therapeutic trials. Therapeutic modification of the natural rate of atrophy has been used as an outcome measure in a number of AD and MCI trials. As a measure of the severity or stage of neurodegeneration, MRI has been used as a covariate in analyses, much the same way disease severity on clinical scales like the Mini Mental State Examination (MMSE) or AD Assessment Scale—Cognitive (ADAS—cog) is used. In theory MRI can also be used to stratify trial subjects at baseline on the basis of disease severity. Although the discussion above has focused on structural MRI as a measure of the severity of AD-related neurodegeneration, MRI also is commonly used for inclusion/exclusion purposes in therapeutic trials. For example, hemispheric cerebral infarction, tumor, normal pressure hydrocephalus (NPH), prior surgery, major head trauma and cerebral hemorrhage are common exclusionary findings on screening MRI. Micro hemorrhages that exceed a prespecified number are also a common exclusionary finding in anti-amyloid trials. The major barrier to the use of volumetric MRI as an outcome measure in clinical trials has been lack of standardization of MRI methods, particularly methods for extracting quantitative information from scans. This lack of standardization leads to different results (see Tables 1-4), which in turn undermines the credibility of the method in the minds of regulators. Although initiatives such as the Alzheimer's Disease Neuroimaging Initiative (ADNI) have focused on standardizing imaging methods, to date universally accepted standards for MRI image quantification have not emerged.
Table 4.
Sample Sizes per Arm Needed to Power Treatment Study in AD/MCI
| Citation | Subjects | Source of subjects | Measurement Method | Sample size required to detect treatment effects |
|---|---|---|---|---|
| (Fox et al., 2000) | 18 AD | Referral sample | Classic BSI | Assuming 12-mo trial, 20% effect size, 90% power, 10% drop out, 10% unusable scans; 207 per arm |
| (Holland et al., 2009) | 129 AD; 299 MCI | Referral sample ADNI | Ctx thickness ERC ROI | Assuming 24-mo trial, 25% effect size, 80% power, scans every 6 mo; 45 per arm for AD; 135 per arm MCI |
| (Hua, Xue et al., 2010) | 50 AD; 122 MCI | Referral sample ADNI | TBM temporal lobe | Assuming 12-mo trial, 25% effect size, 80% power; 43 AD per arm; 82 MCI per arm |
| (Jack et al., 2003) | 192 AD | Referral sample, terminated multi site therapeutic trial | Hippocampus | Assuming 12-mo trial, 50% effect size, 90% power at 0.05; 21 per arm for AD |
| (Leung et al., 2010) | 81 AD | Referral sample ADNI | KN-BSI | Assuming 12-mo trial, 25% effect size, 80% power; 81 AD per arm |
| (Schott et al., 2006) | 46 AD | Referral sample | BSI | Assuming 12-mo trial, 20% effect size, 90% power, 2-sided significance at 0.05, 4 ideally spaced scans; 138 AD per arm |
| (Schuff et al., 2009) | 96 AD; 226 MCI | Referral sample ADNI | Hippocampal volume (SNT), model includes 3 scans, Markov chain, APOE | Assuming 12-mo trial, 25% effect size, 90% power; 186 AD per arm; 341 MCI per arm |
| (Vemuri, P. et al., 2010) | 71 AD; 149 MCI | Referral sample ADNI | Ventricular -BSI | Assuming 12-mo trial, 25% effect size, 80% power, 2-sided 2 sample t-test at 0.05; 100 AD per arm; 186 MCI per arm |
| (Wolz et al., 2010) | 126 AD; 279 MCI | Referral sample ADNI | Simultaneous 4D graph segmentation | Assuming 12-mo trial, 25% effect size, 80% power, 2-sided 2 sample t-test at 0.05; 67 AD per arm; 206 MCI per arm |
Key: AD, Alzheimer's disease; ADNI, Alzheimer's Disease Neuroimaging Initiative; APOE, apolipoprotein E; BSI, boundary shift integral; MCI, mild cognitive impairment; ROI, region of interest; TBM, tensor-baseed morphometry.
At the present time, AD biomarkers have not yet been validated as surrogate endpoints for regulatory purposes. However the impact of interventions on these biomarkers has been evaluated in a few trials and was found to be potentially useful in capturing the pharmacodynamic effects of an agent. The efficacy of Donepezil, an acetylcholinesterase inhibitor, was evaluated using serial anatomic MRI (Hashimoto et al., 2005; Jack et al., 2008; Krishnan et al., 2003) and was found to possibly be neuro-protective based on some evidence of decreased rates of atrophy in the treatment vs. placebo arms. In a different study, antibody responders immunized to Aβ had more rapid volume loss than placebo patients during a Phase IIa immunotherapy trial that was prematurely terminated due to meningoencephalitis in a small subset of patients (Fox et al., 2005).
5) Predicting the risk of progression in MCI and CN
About 12%-15% of MCI subjects annually progress to AD (Fischer et al., 2007; Petersen, R C, 2007); however, clinical criteria alone can not identify with certainty which subjects will progress more rapidly than others. For this reason, predictive information from imaging has been sought to supplement clinical prognostic indicators. Studies demonstrating the ability of MRI to predict future progression have taken several forms. Studies using time-to-event methods are appropriate when follow up times vary among subjects in the cohort which is most commonly the case. Such studies typically employ Cox proportional hazards models in which cut offs stratify a baseline MRI measurement into risk groups and the results are reported as hazard ratios (HR) (Jack et al., 1999). This type of analysis relates an imaging measurement to the time to progression from a diagnosis of MCI to AD, not to the life time risk of developing AD. A related method of analysis employs a rate of change at baseline as the predictor rather than a brain volume measurement at one point in time (Jack et al., 2005). If all subjects in the study have the same follow up time, then simply comparing baseline MRI between progressors and non-progressors is appropriate. Unfortunately, several papers have simply compared baseline MRI measures between progressors and non progressors when follow up times were not the same across subjects in the cohort. Inferences about imaging as a predictor may be invalid in this situation because subjects classified as progressors may simply be those who have longer follow up times than subjects classified as non-progressors. Table 3 illustrates examples of studies evaluating the ability of baseline MRI measures to predict time to progression from MCI to AD. Results vary depending on measurement method, source of subjects, and statistical endpoints.
Table 3.
Predicting Progression from Mild Cognitive Impairment to AD
| Study | Subjects | Source of subjects | Measurement Method | Results |
|---|---|---|---|---|
| (Bakkour et al., 2009) | 49 CDR 0.5 | Referral sample | Cortical thickness in temporal and parietal ROIs | Predict MCI progression to AD, 83% sensitivity and 65% specificity |
| (Brys et al., 2009) | 24 MCI | Referral sample | Medial temporal lobe grey matter concentration | Accuracy, predict MCI progression to AD: 74% |
| (Convit et al., 2000) | 46 Normal or MCI | Referral sample | Hippocampal volume | Declining subjects had 11.3% of reduction in HC compared to non-decliners |
| (DeCarli et al., 2007) | 190 MCI | ADCS Vit E donepezil trial | Visual assessment of hippocampal atrophy | Atrophy score > 2.0 increased likelihood of progression, HR 2.30 |
| (Desikan et al., 2009) | 129 MCI | Referral sample ADNI | Hippocampal volume | Predict MCI progression to AD, adjusted HR 0.73 (0.51-1.04) |
| (Desikan et al., 2008) | 47 MCI | Referral sample | Temporal –parietal regions of interest | Combination of entorhinal cortex (HR = 0.60) and the inferior parietal lobule (HR = 0.62) was best predictor of time to progression to AD |
| (Devanand et al., 2007) | 139 MCI | Referral sample | Hippocampal volume | Predict MCI progression to AD, HR: 2.84 (1.47 – 5.49) |
| (Eckerstrom et al., 2008) | 42 MCI | Referral sample | Hippocampal volume | Hippocampal volumes smaller in converters to AD vs. non-converters |
| (Fleisher et al., 2008) | 129 aMCI | ADCS Vit E donepezil trial | Ventricular volumes and hippocampal volumes | Ventricular volumes and hippocampal volumes predicted progression to AD |
| (Galluzzi et al., 2010) | 90 MCI | Referral sample | Medial temporal atrophy | Predict MCI progression to AD, AUC: 0.73 |
| (Galton et al., 2005) | 31 CDR 0.5 | Referral sample | Hippocampal volume | Converters had a greater atrophy compared to non-converters. |
| (Henneman et al., 2009) | 39 MCI | Referral sample | Hippocampal volume adjusted for age, sex, baseline MMSE | Predict MCI progression to AD, HR: 10.4 (3.1-34.8) |
| (Herukka et al., 2008) | 21 MCI | Referral sample | Hippocampal volume | Predict MCI progression to AD, right HC: 15.8 (1.4-174.2) |
| (Jack et al., 2010b) | 218 MCI | ADNI plus Mayo community sample | Hippocampal volume | Predict MCI progression to AD, HR: 2.6 (1.8-3.8) 25% vs. 75% |
| (Jack et al., 2008) | 131 MCI | ADCS Vit E donepezil trial | Volumes of hippocampus, entorhincal cortex, brain, ventricle | Rates of change in all volumes were greater in converters than nonconverters |
| (Jack et al., 2005) | 72 MCI | Community sample | Hippocampal volume | Predict MCI progression to AD, HC volume OR: 1.51 (1.1-2.0) |
| (Jack et al., 2000) | 43 MCI | Community sample | Hippocampal volume | Rates of hippocampal atrophy were greater in converters than nonconverters |
| (Jack et al., 1999) | 80 MCI | Community sample | Hippocampal W score | Relative risk 0.69 – for each 1 unit increase in W score (less atrophy) risk of progression to AD decreased by 31% |
| (Kantarci et al., 2005) | 21 MCI | Referral sample | Hippocampal volume | Predict MCI progression to AD OR: 2.5 (1.0-6.2) |
| (Killiany et al., 2002) | 94 CDR 0.5 | Referral sample | Hippocampal volume | Predict MCI progression to AD OR: 1.5 (1.0-2.31) |
| (Landau et al., 2010) | 85 MCI | Referral sample | Hippocampal volume | Predict MCI progression to AD OR: 2.49 (1.02-5.96) |
| (Leung et al., 2010) | 335 MCI | ADNI | Hippocampal volume | Rates higher in converters compared with stable and reverter groups |
| (Risacher et al., 2009) | 227 MCI | ADNI | Hippocampal volume | Effect size for separating MCI stable vs. converter Cohen's d= 0.60 |
| (Stoub et al., 2010) | 29 aMCI | Referral sample | Entorhinal cortex and hippocampus | Atrophy rate of entorhinal cortex and hippocampus in controls less than MCI converters |
| (Tapiola et al., 2008) | 60 MCI | Referral sample | Hippocampal volume | Predict MCI progression to AD OR: Total HC 0.815 (0.69-0.97) |
| (Vemuri, P. et al., 2009) | 192 MCI | Referral sample ADNI | STAND score | HR for time to conversion from MCI to AD 25th vs. 75th percentile 2.6 |
| (Visser et al., 1999) | 13 MCI | Community sample | Hippocampal volume | Predict MCI progression to AD OR 0.21 (0.05-0.99) |
| (Visser et al., 2002) | 30 MCI | Community sample | Hippocampal volume | Hippocampal volume predicts MCI progression to AD |
| (Wang et al., 2009) | 58 aMCI | Referral sample | Hippocampal volume | Predict MCI progression to AD Left HC HR 0.38 (0.10-0.88) |
Key: AD, Alzheimer's disease; ADNI, Alzheimer's Disease Neuroimaging Initiative; aMCI, amnestic mild cognitive impairment; AUC, area under the curve; CDR, Clinical Dementia Rating; HR, hazard ratio; MCI, mild cognitive impairment; MMSE, Mini Mental State Examination; OR, odds ratio; ROI, regions of interest; STAND, STructural Abnormality iNDex.
6) Measuring longitudinal disease progression with serial MRI scans
The idea of using change-over-time measures of brain volume on serial MRI was introduced by Fox and Freeborough (Freeborough and Fox, 1997). This approach has appeal as a means of measuring disease progression that is independent of clinical assessment. It has found utility in assessments of individual subjects; in longitudinal observational studies; and as an outcome measurement in therapeutic trials. The potential of change-over-time measures as outcomes in therapeutic trials is particularly appealing because longitudinal MRI measures have considerably better precision and therefore can be powered with much smaller sample sizes than traditional clinical assessment tools. A number of different methodological approaches have been employed ranging from simple manual tracing to sophisticated TBM methods. Several investigators have shown that the lower variance in the serial MRI measurements compared to clinical measures of cognition and function could potentially permit performing clinical trials with smaller sample sizes than would be possible using traditional clinical instruments (Fox et al., 2000; Hua, X. et al., 2008; Jack et al., 2003; Schott et al., 2006; Vemuri, P. et al., 2010). Table 4 illustrates examples of sample sizes needed to power AD or MCI trials. Results vary depending on measurement method, assumptions about the trial design, and statistical methods.
ACKNOWLEDGEMENTS
The Alexander Family Alzheimer's Disease Research Professorship of the Mayo Foundation, USA, and the Robert H. and Clarice Smith Alzheimer's Disease Research Program of the Mayo Foundation, USA. This study was supported by the NIH/National Institute on Aging (R01 AG011378).
REFERENCES
- Alexander GE, Moeller JR. Application of the scaled subprofile model to functional imaging in neuropsychiatric disorders: A principal component approach to modeling regional patterns of brain function in disease. Human Brain Mapping. 1994;2:79–94. [Google Scholar]
- Ashburner J, Friston KJ. Voxel-based morphometry--the methods. Neuroimage. 2000;11(6 Pt 1):805–21. doi: 10.1006/nimg.2000.0582. [DOI] [PubMed] [Google Scholar]
- Bakkour A, Morris JC, Dickerson BC. The cortical signature of prodromal AD: regional thinning predicts mild AD dementia. Neurology. 2009;72(12):1048–55. doi: 10.1212/01.wnl.0000340981.97664.2f. [DOI] [PMC free article] [PubMed] [Google Scholar]
- Bobinski M, de Leon MJ, Wegiel J, Desanti S, Convit A, Saint Louis LA, Rusinek H, Wisniewski HM. The histological validation of post mortem magnetic resonance imaging-determined hippocampal volume in Alzheimer's disease. Neuroscience. 2000;95(3):721–5. doi: 10.1016/s0306-4522(99)00476-5. [DOI] [PubMed] [Google Scholar]
- Braak H, Braak E. Neuropathological stageing of Alzheimer-related changes. Acta Neuropathol. 1991;82(4):239–59. doi: 10.1007/BF00308809. [DOI] [PubMed] [Google Scholar]
- Brys M, Glodzik L, Mosconi L, Switalski R, De Santi S, Pirraglia E, Rich K, Kim BC, Mehta P, Zinkowski R, Pratico D, Wallin A, Zetterberg H, Tsui WH, Rusinek H, Blennow K, de Leon MJ. Magnetic resonance imaging improves cerebrospinal fluid biomarkers in the early detection of Alzheimer's disease. J Alzheimers Dis. 2009;16(2):351–62. doi: 10.3233/JAD-2009-0968. [DOI] [PMC free article] [PubMed] [Google Scholar]
- Chetelat G, Landeau B, Eustache F, Mezenge F, Viader F, de la Sayette V, Desgranges B, Baron JC. Using voxel-based morphometry to map the structural changes associated with rapid conversion in MCI: a longitudinal MRI study. Neuroimage. 2005;27(4):934–46. doi: 10.1016/j.neuroimage.2005.05.015. [DOI] [PubMed] [Google Scholar]
- Convit A, de Asis J, de Leon MJ, Tarshish CY, De Santi S, Rusinek H. Atrophy of the medial occipitotemporal, inferior, and middle temporal gyri in non-demented elderly predict decline to Alzheimer's disease. Neurobiol Aging. 2000;21(1):19–26. doi: 10.1016/s0197-4580(99)00107-4. [DOI] [PubMed] [Google Scholar]
- Csernansky JG, Hamstra J, Wang L, McKeel D, Price JL, Gado M, Morris JC. Correlations between antemortem hippocampal volume and postmortem neuropathology in AD subjects. Alzheimer Dis Assoc Disord. 2004;18(4):190–5. [PubMed] [Google Scholar]
- Csernansky JG, Wang L, Joshi S, Miller JP, Gado M, Kido D, McKeel D, Morris JC, Miller MI. Early DAT is distinguished from aging by high-dimensional mapping of the hippocampus. Dementia of the Alzheimer type. Neurology. 2000;55(11):1636–43. doi: 10.1212/wnl.55.11.1636. [DOI] [PubMed] [Google Scholar]
- Dale AM, Fischl B, Sereno MI. Cortical surface-based analysis. I. Segmentation and surface reconstruction. Neuroimage. 1999;9(2):179–94. doi: 10.1006/nimg.1998.0395. [DOI] [PubMed] [Google Scholar]
- Davatzikos C, Xu F, An Y, Fan Y, Resnick SM. Longitudinal progression of Alzheimer's-like patterns of atrophy in normal older adults: the SPARE-AD index. Brain. 2009;132(Pt 8):2026–35. doi: 10.1093/brain/awp091. [DOI] [PMC free article] [PubMed] [Google Scholar]
- DeCarli C, Frisoni GB, Clark CM, Harvey D, Grundman M, Petersen RC, Thal LJ, Jin S, Jack CR, Jr., Scheltens P. Qualitative estimates of medial temporal atrophy as a predictor of progression from mild cognitive impairment to dementia. Arch Neurol. 2007;64(1):108–15. doi: 10.1001/archneur.64.1.108. [DOI] [PubMed] [Google Scholar]
- Desikan RS, Cabral HJ, Hess CP, Dillon WP, Glastonbury CM, Weiner MW, Schmansky NJ, Greve DN, Salat DH, Buckner RL, Fischl B. Automated MRI measures identify individuals with mild cognitive impairment and Alzheimer's disease. Brain. 2009;132(Pt 8):2048–57. doi: 10.1093/brain/awp123. [DOI] [PMC free article] [PubMed] [Google Scholar]
- Desikan RS, Fischl B, Cabral HJ, Kemper TL, Guttmann CR, Blacker D, Hyman BT, Albert MS, Killiany RJ. MRI measures of temporoparietal regions show differential rates of atrophy during prodromal AD. Neurology. 2008;71(11):819–25. doi: 10.1212/01.wnl.0000320055.57329.34. [DOI] [PMC free article] [PubMed] [Google Scholar]
- Devanand DP, Pradhaban G, Liu X, Khandji A, De Santi S, Segal S, Rusinek H, Pelton GH, Honig LS, Mayeux R, Stern Y, Tabert MH, de Leon MJ. Hippocampal and entorhinal atrophy in mild cognitive impairment: prediction of Alzheimer disease. Neurology. 2007;68(11):828–36. doi: 10.1212/01.wnl.0000256697.20968.d7. [DOI] [PubMed] [Google Scholar]
- Eckerstrom C, Olsson E, Borga M, Ekholm S, Ribbelin S, Rolstad S, Starck G, Edman A, Wallin A, Malmgren H. Small baseline volume of left hippocampus is associated with subsequent conversion of MCI into dementia: the Goteborg MCI study. J Neurol Sci. 2008;272(1-2):48–59. doi: 10.1016/j.jns.2008.04.024. [DOI] [PubMed] [Google Scholar]
- Fan Y, Shen D, Davatzikos C. Classification of structural images via high-dimensional image warping, robust feature extraction, and SVM. Med Image Comput Comput Assist Interv Int Conf Med Image Comput Comput Assist Interv. 2005;8(Pt 1):1–8. doi: 10.1007/11566465_1. [DOI] [PubMed] [Google Scholar]
- Fellgiebel A, Dellani PR, Greverus D, Scheurich A, Stoeter P, Muller MJ. Predicting conversion to dementia in mild cognitive impairment by volumetric and diffusivity measurements of the hippocampus. Psychiatry Res. 2006;146(3):283–7. doi: 10.1016/j.pscychresns.2006.01.006. [DOI] [PubMed] [Google Scholar]
- Fischer P, Jungwirth S, Zehetmayer S, Weissgram S, Hoenigschnabl S, Gelpi E, Krampla W, Tragl KH. Conversion from subtypes of mild cognitive impairment to Alzheimer dementia. Neurology. 2007;68(4):288–91. doi: 10.1212/01.wnl.0000252358.03285.9d. [DOI] [PubMed] [Google Scholar]
- Fischl B, van der Kouwe A, Destrieux C, Halgren E, Segonne F, Salat DH, Busa E, Seidman LJ, Goldstein J, Kennedy D, Caviness V, Makris N, Rosen B, Dale AM. Automatically parcellating the human cerebral cortex. Cereb Cortex. 2004;14(1):11–22. doi: 10.1093/cercor/bhg087. [DOI] [PubMed] [Google Scholar]
- Fleisher AS, Sun S, Taylor C, Ward CP, Gamst AC, Petersen RC, Jack CR, Jr., Aisen PS, Thal LJ. Volumetric MRI vs clinical predictors of Alzheimer disease in mild cognitive impairment. Neurology. 2008;70(3):191–9. doi: 10.1212/01.wnl.0000287091.57376.65. [DOI] [PubMed] [Google Scholar]
- Fox NC, Black RS, Gilman S, Rossor MN, Griffith SG, Jenkins L, Koller M. Effects of Abeta immunization (AN1792) on MRI measures of cerebral volume in Alzheimer disease. Neurology. 2005;64(9):1563–72. doi: 10.1212/01.WNL.0000159743.08996.99. [DOI] [PubMed] [Google Scholar]
- Fox NC, Cousens S, Scahill R, Harvey RJ, Rossor MN. Using serial registered brain magnetic resonance imaging to measure disease progression in Alzheimer disease: power calculations and estimates of sample size to detect treatment effects. Arch Neurol. 2000;57(3):339–44. doi: 10.1001/archneur.57.3.339. [DOI] [PubMed] [Google Scholar]
- Fox NC, Freeborough PA. Brain atrophy progression measured from registered serial MRI: validation and application to Alzheimer's disease. J Magn Reson Imaging. 1997;7(6):1069–75. doi: 10.1002/jmri.1880070620. [DOI] [PubMed] [Google Scholar]
- Fox NC, Freeborough PA, Rossor MN. Visualisation and quantification of rates of atrophy in Alzheimer's disease. Lancet. 1996;348(9020):94–7. doi: 10.1016/s0140-6736(96)05228-2. [DOI] [PubMed] [Google Scholar]
- Freeborough PA, Fox NC. The boundary shift integral: an accurate and robust measure of cerebral volume changes from registered repeat MRI. IEEE Trans Med Imaging. 1997;16(5):623–9. doi: 10.1109/42.640753. [DOI] [PubMed] [Google Scholar]
- Galluzzi S, Geroldi C, Ghidoni R, Paghera B, Amicucci G, Bonetti M, Zanetti O, Cotelli M, Gennarelli M, Frisoni GB. The new Alzheimer's criteria in a naturalistic series of patients with mild cognitive impairment. J Neurol. 2010;257(12):2004–14. doi: 10.1007/s00415-010-5650-0. [DOI] [PubMed] [Google Scholar]
- Galton CJ, Erzinclioglu S, Sahakian BJ, Antoun N, Hodges JR. A comparison of the Addenbrooke's Cognitive Examination (ACE), conventional neuropsychological assessment, and simple MRI-based medial temporal lobe evaluation in the early diagnosis of Alzheimer's disease. Cogn Behav Neurol. 2005;18(3):144–50. doi: 10.1097/01.wnn.0000182831.47073.e9. [DOI] [PubMed] [Google Scholar]
- Gerardin E, Chetelat G, Chupin M, Cuingnet R, Desgranges B, Kim HS, Niethammer M, Dubois B, Lehericy S, Garnero L, Eustache F, Colliot O. Multidimensional classification of hippocampal shape features discriminates Alzheimer's disease and mild cognitive impairment from normal aging. Neuroimage. 2009;47(4):1476–86. doi: 10.1016/j.neuroimage.2009.05.036. [DOI] [PMC free article] [PubMed] [Google Scholar]
- Gosche KM, Mortimer JA, Smith CD, Markesbery WR, Snowdon DA. Hippocampal volume as an index of Alzheimer neuropathology: findings from the Nun Study. Neurology. 2002;58(10):1476–82. doi: 10.1212/wnl.58.10.1476. [DOI] [PubMed] [Google Scholar]
- Hashimoto M, Kazui H, Matsumoto K, Nakano Y, Yasuda M, Mori E. Does donepezil treatment slow the progression of hippocampal atrophy in patients with Alzheimer's disease? Am J Psychiatry. 2005;162(4):676–82. doi: 10.1176/appi.ajp.162.4.676. [DOI] [PubMed] [Google Scholar]
- Henneman WJ, Sluimer JD, Barnes J, van der Flier WM, Sluimer IC, Fox NC, Scheltens P, Vrenken H, Barkhof F. Hippocampal atrophy rates in Alzheimer disease: added value over whole brain volume measures. Neurology. 2009;72(11):999–1007. doi: 10.1212/01.wnl.0000344568.09360.31. [DOI] [PMC free article] [PubMed] [Google Scholar]
- Herukka SK, Pennanen C, Soininen H, Pirttila T. CSF Abeta42, tau and phosphorylated tau correlate with medial temporal lobe atrophy. J Alzheimers Dis. 2008;14(1):51–7. doi: 10.3233/jad-2008-14105. [DOI] [PubMed] [Google Scholar]
- Hinrichs C, Singh V, Mukherjee L, Xu G, Chung MK, Johnson SC. Spatially augmented LPboosting for AD classification with evaluations on the ADNI dataset. Neuroimage. 2009;48(1):138–49. doi: 10.1016/j.neuroimage.2009.05.056. [DOI] [PMC free article] [PubMed] [Google Scholar]
- Holland D, Brewer JB, Hagler DJ, Fenema-Notestine C, Dale AM, Weiner M, Thal L, Petersen R, Jack CR, Jr., Jagust W, Trojanowki J, Toga AW, Beckett L, Green RC, Gamst A, Potter WZ, Montine T, Anders D, Bernstein M, Felmlee J, Fox N, Thompson P, Schuff N, Alexander G, Bandy D, Koeppe RA, Foster N, Reiman EM, Chen K, Shaw L, Lee VM, Korecka M, Crawford K, Neu S, Harvey D, Kornak J, Kachaturian Z, Frank R, Snyder PJ, Molchan S, Kaye J, Vorobik R, Quinn J, Schneider L, Pawluczyk S, Spann B, Fleisher AS, Vanderswag H, Heidebrink JL, Lord JL, Johnson K, Doody RS, Villanueva-Meyer J, Chowdhury M, Stern Y, Honig LS, Bell KL, Morris JC, Mintun MA, Schneider S, Marson D, Griffith R, Badger B, Grossman H, Tang C, Stern J, Detoledo-Morrell L, Shah RC, Bach J, Duara R, Isaacson R, Strauman S, Albert MS, Pedroso J, Toroney J, Rusinek H, de Leon MJ, De Santi SM, Doraiswamy PM, Petrella JR, Aiello M, Clark CM, Pham C, Nunez J, Smith CD, Given CA, 2nd, Hardy P, Dekosky ST, Oakley M, Simpson DM, Ismail MS, Porsteinsson A, McCallum C, Cramer SC, Mulnard RA, McAdams-Ortiz C, Diaz-Arrastia R, Martin-Cook K, Devous M, Levey AI, Lah JJ, Cellar JS, Burns JM, Anderson HS, Laubinger MM, Bartzokis G, Silverman DH, Lu PH, Fletcher R, Parfitt F, Johnson H, Farlow M, Herring S, Hake AM, van Dyck CH, Macavoy MG, Bifano LA, Chertkow H, Bergman H, Hosein C, Black S, Graham S, Caldwell C, Feldman H, Assaly M, Hsiung GY, Kertesz A, Rogers J, Trost D, Bernick C, Gitelman D, Johnson N, Mesulam M, Sadowsky C, Villena T, Mesner S, Aisen PS, Johnson KB, Behan KE, Sperling RA, Rentz DM, Johnson KA, Rosen A, Tinklenberg J, Ashford W, Sabbagh M, Connor D, Obradov S, Killiany R, Norbash A, Obisesan TO, Jayam-Trouth A, Wang P, Auchus AP, Huang J, Friedland RP, Decarli C, Fletcher E, Carmichael O, Kittur S, Mirje S, Johnson SC, Borrie M, Lee TY, Asthana S, Carlsson CM, Potkin SG, Highum D, Preda A, Nguyen D, Tariot PN, Hendin BA, Scharre DW, Kataki M, Beversdorf DQ, Zimmerman EA, Celmins D, Brown AD, Gandy S, Marenberg ME, Rovner BW, Pearlson G, Blank K, Anderson K, Saykin AJ, Santulli RB, Pare N, Williamson JD, Sink KM, Potter H, Ashok Raj B, Giordano A, Ott BR, Wu CK, Cohen R, Wilks KL, Safirstein BE. Subregional neuroanatomical change as a biomarker for Alzheimer's disease. Proc Natl Acad Sci U S A. 2009;106(49):20954–9. doi: 10.1073/pnas.0906053106. [DOI] [PMC free article] [PubMed] [Google Scholar]
- Hua X, Hibar DP, Lee S, Toga AW, Jack CR, Jr., Weiner MW, Thompson PM. Sex and age differences in brain atrophic rates: an ADNI study with N=1368 MRI scans. Neurobiology of Aging, Special Issue on ADNI. 2010;31(8):1463–80. doi: 10.1016/j.neurobiolaging.2010.04.033. [DOI] [PMC free article] [PubMed] [Google Scholar]
- Hua X, Leow AD, Lee S, Klunder AD, Toga AW, Lepore N, Chou YY, Brun C, Chiang MC, Barysheva M, Jack CR, Jr., Bernstein MA, Britson PJ, Ward CP, Whitwell JL, Borowski B, Fleisher AS, Fox NC, Boyes RG, Barnes J, Harvey D, Kornak J, Schuff N, Boreta L, Alexander GE, Weiner MW, Thompson PM, Alzheimer's Disease Neuroimaging I 3D characterization of brain atrophy in Alzheimer's disease and mild cognitive impairment using tensor-based morphometry. Neuroimage. 2008;41(1):19–34. doi: 10.1016/j.neuroimage.2008.02.010. [DOI] [PMC free article] [PubMed] [Google Scholar]
- Jack CR, Jr., Dickson DW, Parisi JE, Xu YC, Cha RH, O'Brien PC, Edland SD, Smith GE, Boeve BF, Tangalos EG, Kokmen E, Petersen RC. Antemortem MRI findings correlate with hippocampal neuropathology in typical aging and dementia. Neurology. 2002;58(5):750–7. doi: 10.1212/wnl.58.5.750. [DOI] [PMC free article] [PubMed] [Google Scholar]
- Jack CR, Jr., Knopman DS, Jagust WJ, Shaw LM, Aisen PS, Weiner MW, Petersen RC, Trojanowski JQ. Hypothetical model of dynamic biomarkers of the Alzheimer's pathological cascade. Lancet Neurol. 2010a;9(1):119–28. doi: 10.1016/S1474-4422(09)70299-6. [DOI] [PMC free article] [PubMed] [Google Scholar]
- Jack CR, Jr., Lowe VJ, Weigand SD, Wiste HJ, Senjem ML, Knopman DS, Shiung MM, Gunter JL, Boeve BF, Kemp BJ, Weiner M, Petersen RC. Serial PIB and MRI in normal, mild cognitive impairment and Alzheimer's disease: implications for sequence of pathological events in Alzheimer's disease. Brain. 2009;132(Pt 5):1355–65. doi: 10.1093/brain/awp062. [DOI] [PMC free article] [PubMed] [Google Scholar]
- Jack CR, Jr., Petersen RC, Grundman M, Jin S, Gamst A, Ward CP, Sencakova D, Doody RS, Thal LJ. Longitudinal MRI findings from the vitamin E and donepezil treatment study for MCI. Neurobiol Aging. 2008;29(9):1285–95. doi: 10.1016/j.neurobiolaging.2007.03.004. [DOI] [PMC free article] [PubMed] [Google Scholar]
- Jack CR, Jr., Petersen RC, O'Brien PC, Tangalos EG. MR-based hippocampal volumetry in the diagnosis of Alzheimer's disease. Neurology. 1992;42(1):183–8. doi: 10.1212/wnl.42.1.183. [DOI] [PubMed] [Google Scholar]
- Jack CR, Jr., Petersen RC, Xu Y, O'Brien PC, Smith GE, Ivnik RJ, Boeve BF, Tangalos EG, Kokmen E. Rates of hippocampal atrophy correlate with change in clinical status in aging and AD. Neurology. 2000;55(4):484–89. doi: 10.1212/wnl.55.4.484. [DOI] [PMC free article] [PubMed] [Google Scholar]
- Jack CR, Jr., Petersen RC, Xu YC, O'Brien PC, Smith GE, Ivnik RJ, Boeve BF, Waring SC, Tangalos EG, Kokmen E. Prediction of AD with MRI-based hippocampal volume in mild cognitive impairment. Neurology. 1999;52(7):1397–403. doi: 10.1212/wnl.52.7.1397. [DOI] [PMC free article] [PubMed] [Google Scholar]
- Jack CR, Jr., Shiung MM, Weigand SD, O'Brien PC, Gunter JL, Boeve BF, Knopman DS, Smith GE, Ivnik RJ, Tangalos EG, Petersen RC. Brain atrophy rates predict subsequent clinical conversion in normal elderly and amnestic MCI. Neurology. 2005;65(8):1227–31. doi: 10.1212/01.wnl.0000180958.22678.91. [DOI] [PMC free article] [PubMed] [Google Scholar]
- Jack CR, Jr., Slomkowski M, Gracon S, Hoover TM, Felmlee JP, Stewart K, Xu Y, Shiung M, O'Brien PC, Cha R, Knopman D, Petersen RC. MRI as a biomarker of disease progression in a therapeutic trial of milameline for AD. Neurology. 2003;60(2):253–60. doi: 10.1212/01.wnl.0000042480.86872.03. [DOI] [PMC free article] [PubMed] [Google Scholar]
- Jack CR, Jr., Wiste HJ, Vemuri P, Weigand SD, Senjem ML, Zeng G, Bernstein MA, Gunter JL, Pankratz VS, Aisen PS, Weiner MW, Petersen RC, Shaw LM, Trojanowski JQ, Knopman DS. Brain beta-amyloid measure and magnetic resonance imaging atophy both predict time-to-progression from mild cognitive impairment to Alzheimer's disease. Brain. 2010b;133(11):3336–48. doi: 10.1093/brain/awq277. [DOI] [PMC free article] [PubMed] [Google Scholar]
- Jagust WJ, Zheng L, Harvey DJ, Mack WJ, Vinters HV, Weiner MW, Ellis WG, Zarow C, Mungas D, Reed BR, Kramer JH, Schuff N, DeCarli C, Chui HC. Neuropathological basis of magnetic resonance images in aging and dementia. Ann Neurol. 2008;63(1):72–80. doi: 10.1002/ana.21296. [DOI] [PMC free article] [PubMed] [Google Scholar]
- Kantarci K, Petersen RC, Boeve BF, Knopman DS, Weigand SD, O'Brien PC, Shiung MM, Smith GE, Ivnik RJ, Tangalos EG, Jack CR., Jr. DWI predicts future progression to Alzheimer disease in amnestic mild cognitive impairment. Neurology. 2005;64(5):902–4. doi: 10.1212/01.WNL.0000153076.46126.E9. [DOI] [PMC free article] [PubMed] [Google Scholar]
- Killiany RJ, Gomez-Isla T, Moss M, Kikinis R, Sandor T, Jolesz F, Tanzi R, Jones K, Hyman BT, Albert MS. Use of structural magnetic resonance imaging to predict who will get Alzheimer's disease. Ann Neurol. 2000;47(4):430–9. [PubMed] [Google Scholar]
- Killiany RJ, Hyman BT, Gomez-Isla T, Moss MB, Kikinis R, Jolesz F, Tanzi R, Jones K, Albert MS. MRI measures of entorhinal cortex vs hippocampus in preclinical AD. Neurology. 2002;58(8):1188–96. doi: 10.1212/wnl.58.8.1188. [DOI] [PubMed] [Google Scholar]
- Kloppel S, Stonnington CM, Chu C, Draganski B, Scahill RI, Rohrer JD, Fox NC, Jack CR, Jr., Ashburner J, Frackowiak RS. Automatic classification of MR scans in Alzheimer's disease. Brain. 2008;131(Pt 3):681–9. doi: 10.1093/brain/awm319. [DOI] [PMC free article] [PubMed] [Google Scholar]
- Kohannim O, Hua X, Hibar DP, Lee S, Chou Y-Y, Toga AW, Jack CR, Jr., Weiner MW, Thompson PM. Boosting power for clinical trials using classifiers based on multiple biomarkers. Neurobiology of Aging, Special Issue on ADNI. 2010;31(8):1429–42. doi: 10.1016/j.neurobiolaging.2010.04.022. [DOI] [PMC free article] [PubMed] [Google Scholar]
- Krishnan KR, Charles HC, Doraiswamy PM, Mintzer J, Weisler R, Yu X, Perdomo C, Ieni JR, Rogers S. Randomized, placebo-controlled trial of the effects of donepezil on neuronal markers and hippocampal volumes in Alzheimer's disease. Am J Psychiatry. 2003;160(11):2003–11. doi: 10.1176/appi.ajp.160.11.2003. [DOI] [PubMed] [Google Scholar]
- Landau SM, Harvey D, Madison CM, Reiman EM, Foster NL, Aisen PS, Petersen RC, Shaw LM, Trojanowski JQ, Jack CR, Jr., Weiner MW, Jagust WJ. Comparing predictors of conversion and decline in mild cognitive impairment. Neurology. 2010;75(3):230–8. doi: 10.1212/WNL.0b013e3181e8e8b8. [DOI] [PMC free article] [PubMed] [Google Scholar]
- Leung KK, Clarkson MJ, Bartlett JW, Clegg S, Jack CR, Jr., Weiner MW, Fox NC, Ourselin S. Robust atrophy rate measurement in Alzheimer's disease using multi-site serial MRI: Tissue-specific intensity normalization and parameter selection. Neuroimage. 2010;50(2):516–23. doi: 10.1016/j.neuroimage.2009.12.059. [DOI] [PMC free article] [PubMed] [Google Scholar]
- McEvoy LK, Fennema-Notestine C, Roddey JC, Hagler DJ, Jr., Holland D, Karow DS, Pung CJ, Brewer JB, Dale AM. Alzheimer disease: quantitative structural neuroimaging for detection and prediction of clinical and structural changes in mild cognitive impairment. Radiology. 2009;251(1):195–205. doi: 10.1148/radiol.2511080924. [DOI] [PMC free article] [PubMed] [Google Scholar]
- Petersen RC. Mild cognitive impairment as a diagnostic entity. J Intern Med. 2004;256(3):183–94. doi: 10.1111/j.1365-2796.2004.01388.x. [DOI] [PubMed] [Google Scholar]
- Petersen RC. Mild cognitive impairment. Continuum Lifelong Learning Neurol. 2007;13(2):15–38. [Google Scholar]
- Risacher SL, Saykin AJ, West JD, Shen L, Firpi HA, McDonald BC. Baseline MRI predictors of conversion from MCI to probable AD in the ADNI cohort. Curr Alzheimer Res. 2009;6(4):347–61. doi: 10.2174/156720509788929273. [DOI] [PMC free article] [PubMed] [Google Scholar]
- Scheltens P, Leys D, Barkhof F, Huglo D, Weinstein HC, Vermersch P, Kuiper M, Steinling M, Wolters EC, Valk J. Atrophy of medial temporal lobes on MRI in “probable” Alzheimer's disease and normal ageing: diagnostic value and neuropsychological correlates. J Neurol Neurosurg Psychiatry. 1992;55(10):967–72. doi: 10.1136/jnnp.55.10.967. [DOI] [PMC free article] [PubMed] [Google Scholar]
- Schott JM, Frost C, Whitwell JL, Macmanus DG, Boyes RG, Rossor MN, Fox NC. Combining short interval MRI in Alzheimer's disease: Implications for therapeutic trials. J Neurol. 2006;253(9):1147–53. doi: 10.1007/s00415-006-0173-4. [DOI] [PubMed] [Google Scholar]
- Schuff N, Woerner N, Boreta L, Kornfield T, Shaw LM, Trojanowski JQ, Thompson PM, Jack CR, Jr., Weiner MW. MRI of hippocampal volume loss in early Alzheimer's disease in relation to ApoE genotype and biomarkers. Brain. 2009;132(Pt 4):1067–77. doi: 10.1093/brain/awp007. [DOI] [PMC free article] [PubMed] [Google Scholar]
- Silbert LC, Quinn JF, Moore MM, Corbridge E, Ball MJ, Murdoch G, Sexton G, Kaye JA. Changes in premorbid brain volume predict Alzheimer's disease pathology. Neurology. 2003;61(4):487–92. doi: 10.1212/01.wnl.0000079053.77227.14. [DOI] [PubMed] [Google Scholar]
- Stonnington CM, Tan G, Kloppel S, Chu C, Draganski B, Jack CR, Jr., Chen K, Ashburner J, Frackowiak RS. Interpreting scan data acquired from multiple scanners: a study with Alzheimer's disease. Neuroimage. 2008;39(3):1180–5. doi: 10.1016/j.neuroimage.2007.09.066. [DOI] [PMC free article] [PubMed] [Google Scholar]
- Stoub TR, Rogalski EJ, Leurgans S, Bennett DA, deToledo-Morrell L. Rate of entorhinal and hippocampal atrophy in incipient and mild AD: relation to memory function. Neurobiol Aging. 2010;31(7):1089–98. doi: 10.1016/j.neurobiolaging.2008.08.003. [DOI] [PMC free article] [PubMed] [Google Scholar]
- Tapiola T, Pennanen C, Tapiola M, Tervo S, Kivipelto M, Hanninen T, Pihlajamaki M, Laakso MP, Hallikainen M, Hamalainen A, Vanhanen M, Helkala EL, Vanninen R, Nissinen A, Rossi R, Frisoni GB, Soininen H. MRI of hippocampus and entorhinal cortex in mild cognitive impairment: a follow-up study. Neurobiol Aging. 2008;29(1):31–8. doi: 10.1016/j.neurobiolaging.2006.09.007. [DOI] [PubMed] [Google Scholar]
- Thompson PM, Apostolova LG. Computational anatomical methods as applied to ageing and dementia. Br J Radiol. 80 Spec No. 2007;2:S78–91. doi: 10.1259/BJR/20005470. [DOI] [PubMed] [Google Scholar]
- Tzourio-Mazoyer N, Landeau B, Papathanassiou D, Crivello F, Etard O, Delcroix N, Mazoyer B, Joliot M. Automated anatomical labeling of activations in SPM using a macroscopic anatomical parcellation of the MNI MRI single-subject brain. Neuroimage. 2002;15(1):273–89. doi: 10.1006/nimg.2001.0978. [DOI] [PubMed] [Google Scholar]
- Vemuri P, Gunter JL, Senjem ML, Whitwell JL, Kantarci K, Knopman DS, Boeve BF, Petersen RC, Jack CR., Jr. Alzheimer's disease diagnosis in individual subjects using structural MR images: validation studies. Neuroimage. 2008a;39(3):1186–97. doi: 10.1016/j.neuroimage.2007.09.073. [DOI] [PMC free article] [PubMed] [Google Scholar]
- Vemuri P, Jack CR., Jr. Role of structural MRI in Alzheimer's disease. Alzheimers Res Ther. 2010;2(4):23. doi: 10.1186/alzrt47. [DOI] [PMC free article] [PubMed] [Google Scholar]
- Vemuri P, Whitwell JL, Kantarci K, Josephs KA, Parisi JE, Shiung MS, Knopman DS, Boeve BF, Petersen RC, Dickson DW, Jack CR., Jr. Antemortem MRI based STructural Abnormality iNDex (STAND)-scores correlate with postmortem Braak neurofibrillary tangle stage. Neuroimage. 2008b;42(2):559–67. doi: 10.1016/j.neuroimage.2008.05.012. [DOI] [PMC free article] [PubMed] [Google Scholar]
- Vemuri P, Wiste HJ, Weigand SD, Knopman DS, Trojanowski JQ, Shaw LM, Bernstein MA, Aisen PS, Weiner M, Petersen RC, Jack CR., Jr Serial MRI and CSF Biomarkers in Normal Aging, MCI and AD. Neurology. 2010;75(2):143–51. doi: 10.1212/WNL.0b013e3181e7ca82. Initiative AsDN. [DOI] [PMC free article] [PubMed] [Google Scholar]
- Vemuri P, Wiste HJ, Weigand SD, Shaw LM, Trojanowski JQ, Weiner MW, Knopman DS, Petersen RC, Jack CR., Jr. MRI and CSF biomarkers in normal, MCI, and AD subjects: Predicting future clinical change. Neurology. 2009;73(4):294–301. doi: 10.1212/WNL.0b013e3181af79fb. [DOI] [PMC free article] [PubMed] [Google Scholar]
- Visser PJ, Krabbendam L, Verhey FR, Hofman PA, Verhoeven WM, Tuinier S, Wester A, Den Berg YW, Goessens LF, Werf YD, Jolles J. Brain correlates of memory dysfunction in alcoholic Korsakoff's syndrome. J Neurol Neurosurg Psychiatry. 1999;67(6):774–8. doi: 10.1136/jnnp.67.6.774. [DOI] [PMC free article] [PubMed] [Google Scholar]
- Visser PJ, Verhey FR, Hofman PA, Scheltens P, Jolles J. Medial temporal lobe atrophy predicts Alzheimer's disease in patients with minor cognitive impairment. J Neurol Neurosurg Psychiatry. 2002;72(4):491–7. doi: 10.1136/jnnp.72.4.491. [DOI] [PMC free article] [PubMed] [Google Scholar]
- Walhovd KB, Fjell AM, Brewer J, McEvoy LK, Fennema-Notestine C, Hagler DJ, Jr., Jennings RG, Karow D, Dale AM. Combining MR imaging, positron-emission tomography, and CSF biomarkers in the diagnosis and prognosis of Alzheimer disease. AJNR Am J Neuroradiol. 2010;31(2):347–54. doi: 10.3174/ajnr.A1809. [DOI] [PMC free article] [PubMed] [Google Scholar]
- Wang PN, Liu HC, Lirng JF, Lin KN, Wu ZA. Accelerated hippocampal atrophy rates in stable and progressive amnestic mild cognitive impairment. Psychiatry Res. 2009;171(3):221–31. doi: 10.1016/j.pscychresns.2008.05.002. [DOI] [PubMed] [Google Scholar]
- Whitwell JL, Josephs KA, Murray ME, Kantarci K, Przybelski SA, Weigand SD, Vemuri P, Senjem ML, Parisi JE, Knopman DS, Boeve BF, Petersen RC, Dickson DW, Jack CR., Jr. MRI correlates of neurofibrillary tangle pathology at autopsy: a voxel-based morphometry study. Neurology. 2008a;71(10):743–9. doi: 10.1212/01.wnl.0000324924.91351.7d. [DOI] [PMC free article] [PubMed] [Google Scholar]
- Whitwell JL, Przybelski SA, Weigand SD, Knopman DS, Boeve BF, Petersen RC, Jack CR., Jr. 3D maps from multiple MRI illustrate changing atrophy patterns as subjects progress from mild cognitive impairment to Alzheimer's disease. Brain. 2007;130(Pt 7):1777–86. doi: 10.1093/brain/awm112. [DOI] [PMC free article] [PubMed] [Google Scholar]
- Whitwell JL, Shiung MM, Przybelski SA, Weigand SD, Knopman DS, Boeve BF, Petersen RC, Jack CR., Jr. MRI patterns of atrophy associated with progression to AD in amnestic mild cognitive impairment. Neurology. 2008b;70(7):512–20. doi: 10.1212/01.wnl.0000280575.77437.a2. [DOI] [PMC free article] [PubMed] [Google Scholar]
- Wolz R, Heckemann RA, Aljabar P, Hajnal JV, Hammers A, Lotjonen J, Rueckert D. Measurement of hippocampal atrophy using 4D graph-cut segmentation: application to ADNI. Neuroimage. 2010;52(1):109–18. doi: 10.1016/j.neuroimage.2010.04.006. [DOI] [PubMed] [Google Scholar]
- Xu Y, Jack CR, Jr., O'Brien PC, Kokmen E, Smith GE, Ivnik RJ, Boeve BF, Tangalos RG, Petersen RC. Usefulness of MRI measures of entorhinal cortex versus hippocampus in AD. Neurology. 2000;54(9):1760–7. doi: 10.1212/wnl.54.9.1760. [DOI] [PubMed] [Google Scholar]
- Zarow C, Vinters HV, Ellis WG, Weiner MW, Mungas D, White L, Chui HC. Correlates of hippocampal neuron number in Alzheimer's disease and ischemic vascular dementia. Ann Neurol. 2005;57(6):896–903. doi: 10.1002/ana.20503. [DOI] [PMC free article] [PubMed] [Google Scholar]