

Abstract
While the toxic effects of lead have been recognized for millennia, it has remained a significant public health concern due to its continued use and toxicological potential. Of particular interest is the increased susceptibility of young children to the toxic effects of lead. Although the exact mechanism(s) for lead toxicity is currently not well understood, research has established that it can be a potent NMDA antagonist. Previous research has established that exposure to NMDA antagonists during the brain growth spurt period (first 2 weeks of life in mice) can produce apoptotic neurodegeneration throughout the brain. Based on this information, the ability of lead exposure (2 injections of 350 mg/kg lead 4 h apart) to produce apoptosis in the neonatal mouse brain was assessed histologically 8–24 h after treatment using activated caspase-3 immunohistochemistry, De Olmos silver technique, Nissl staining, and electron microscopy. Lead exposure produced significant neurodegeneration in the caudate/putamen, hippocampus, subiculum, and superficial and deep cortical layers of the frontal cortical regions. Further ultrastructural examination revealed cellular profiles consistent with apoptotic cell death. Statistical results showed that lead exposure significantly increased apoptotic neurodegeneration above that seen in normal controls in animals treated at postnatal day 7, but not on day 14. The results of this study may provide a basis for further elucidation of mechanisms through which the immature nervous system may be particularly susceptible to lead exposure.
Keywords: lead, NMDA antagonist, apoptosis, neurodevelopment, neurotoxicity
1. Introduction
Man’s use of lead dates back to antiquity, becoming universal in all advanced civilizations and creating an enormous environmental burden. The toxic effects of lead have been recognized for centuries, and although multiple organ systems are affected, the effects on the brain are the most devastating (Lewis, 1985; White, et al. 2007). While classic toxidromes of lead toxicity in adults have been described throughout history, the neurotoxic effects in children were not described until the early 1900s. (Chisholm, 2001; Markowitz and Rosner, 2000). From the initial descriptions of lead poisoning in young children, it was observed that different clinical effects occur in adults compared to children, with the most dramatic neurobehavioral sequelae if exposure occurs when the brain is developing, even at low doses (Bellinger, 2004; Chiodo et al., 2004; Winneke et al. 1996) In spite of the accumulating evidence of toxicity, use of lead remains widespread, and the burgeoning environmental burden is a significant public health concern. From 1991–1994, the CDC estimated that 890,000 (4.4%) children aged 1–5 years had elevated blood lead levels (>10 μg/dl), and it has since been recognized that children’s physical and mental development can be affected at levels less than the 10 μg/dL, the level currently defined by the CDC as the threshold for requiring public health action (Binns et al., 2007; Chisholm 2001).
The effects of lead in the CNS are variable and can range from mild cognitive deficits to overt encephalopathy. In vivo animal models have historically focused on indirect evidence for neuronal cell death (i.e. biochemical markers or brain weight) after lead exposure (Bouldin and Krigman, 1975; Guilarte et al., 1995; Press 1977; Winder et al. 1983). Although in vivo evidence of apoptosis in rat hippocampal cells has been described, degeneration of specific neurons observed in multiple brain regions, and the manner in which they undergo degeneration, has only recently been identified (Liu et al., 2010). In vitro evidence of an apoptosis in PC 12 cells has been identified by an increase in BAX and activation of caspase-3 (Xu et al., 2006), but the exact mechanism of neurotoxicity remains largely unknown. Several mechanisms of lead neurotoxicity have been proposed: 1) vasculopathy resulting in breakdown of the blood brain barrier, intracranial hemorrhage and/or cerebral edema (Lorenzo et al. 1978; Struzynska et al., 1997); 2) modification of synaptogenesis (McCauley et al., 1982); 3) disruptions of energy metabolism, calcium homeostasis, and cell signaling (Busselberg 1995; Goldstein 1993; Simons 1993) and 4) alterations in neurotransmitter systems, particularly the glutamatergic system and its effects at N-methly-D-aspartate (NMDA) glutamate receptors (Carpenter et al. 1994; Guilarte et al., 1997; Guilarte and McGlothan, 2003; Guilarte and Miceli, 1992; Schulte et al., 1995).
NMDA receptors play a vital role in the developing brain for regulation of cellular morphology, differentiation, migration, and synaptogenic circuitry (Komuro and Rakic, 1993). Blockade of NMDA receptors by the NMDA antagonists MK-801 (Hansen et al. 2004; Ikonomidou et al. 1999; Lyall et al 2009), phencyclidine (PCP) (Anastasio et al., 2009; Yuede et al. 2010), ketamine (Soriano et al. 2010), and ethanol (Dikranian et al., 2005; Olney et al., 2002; Wozniak et al., 2004; Young et al., 2005, 2008) triggers widespread apoptotic neurodegeneration in the neonatal rodent brain. This form of brain damage caused by ethanol (Fredriksson and Archer, 2004; Wozniak et al., 2004), ketamine (Fredriksson And Archer, 2004: Fredriksson et al., 2007), and PCP (Yuede et al., 2010) has been shown to cause long-term behavioral deficits in rodents. Recent research also has shown that ethanol (Farber et al., 2010) and ketamine causes apoptotic neurodegeneration in the developing primate brain (Slikker et al., 2007; Zuo et al., 2009). The window of vulnerability for this drug-induced developmental neuroapoptosis occurs during approximately the first two weeks of rodent life with peak sensitivity thought to occur occurring around postnatal day 7 (Ikonomidou et al., 1999). In humans, the corresponding period begins in the 3rd trimester of pregnancy and extends well into the first several years of life (Dobbing and Sands, 1979; Rice and Barone, 2000). This period of vulnerability overlaps substantially with the period when children are most susceptible to the neurotoxic effects of lead, suggesting that lead could be producing neurodegeneration by disrupting neurotransmission via NMDA receptors distinguishing its clinical effects from that of adult brains.
There are both electrophysiological and biochemical evidence that lead is a potent and selective antagonist at the NMDA receptor (Audesirk, 1993; Guilarte et al., 1994). These inhibitory effects were shown to be age-dependent with immature brain tissue being more sensitive than mature tissue secondary to direct age-specific effects at the NMDA receptor as well as alterations in NMDA receptor complex subunit composition induced by exposure to lead (Guilarte and McGlothan, 2003; Zhang et al., 2002). Based on this information we hypothesized that exposure to lead could produce apoptotic neurodegeneration in the neonatal mouse CNS in a regional and temporal pattern similar to that seen with other NMDA antagonists.
2. Methods
2.1 Experimental Design
All animal care procedures were conducted in accordance with guidelines developed by the National Academy of Science and approved by the Washington University School of Medicine Animal Studies Committee. Seven-day-old (P7) and 14-day-old (P14) C57 BL/6 mice were used in all experiments (Harlan, Indianapolis). To control for litter variability, a litter matching approach was used in which control and experimental pups were randomly assigned to groups, with experimental and control animals chosen from each litter. From prior studies it is known that peak sensitivity to drug-induced developmental neuroapoptosis occurs at post-natal day 7, but some neuronal groups remain sensitive until at least day 14 (Ikonomidou et al., 1999). Therefore, we administered lead acetate or saline to infant mice at P7 and P14 and evaluated the brains at various intervals 8 to 24 h later using histological methods that allow for detection and quantification of apoptotic neurons. Lead acetate was adminstered by intraperitoneal (i.p.) injection to the infant mice at a dose of 350 mg/kg at time zero and another dose at 4 h for a total of 700 mg/kg. Pups were excluded from the study if they appeared malnourished or if at the beginning of the experiment their stomach was not full of milk (as visualized through the relatively transparent abdominal wall).
At the specified time interval after the lead injection, the animals were deeply anesthetized with sodium pentobarbitol and perfused with 4% paraformaldehyde in Tris buffer (pH = 7.4) via the left cardiac ventricle and ascending aorta. The brains were then removed, post-fixed in perfusate, sectioned using a vibratome, and prepared for De Olmos silver staining, activated caspase-3 immunohistochemistry, or Nissl staining. For electron microscopy (EM), the animals were perfused with 1.5% glutaraldehyde and 1% paraformaldehyde in pyrophosphate buffer (pH = 7.4). The brains were sectioned and processed as described below. In addition to histological studies, separate groups of P7 animals were used to monitor lead blood levels following administration of lead by the above-described dosing regimen.
2.2 De Olmos cupric silver staining
De Olmos cupric silver staining procedure (DeOlmos and Ingram, 1971) is an excellent method for marking dying and degenerating neurons, although it does not distinguish between apoptotic and non-apoptotic cell death (Olney et al., 2002). Silver is taken up and retained by dying neurons, even after they have deteriorated into multiple small fragments. We used this stain for screening purposes to assess the pattern of cell death induced by lead compared to the pattern that occurs spontaneously as a natural phenomenon in control animals. A total of eight coronal sections sampled from the olfactory bulb to the lower brain stem were used for this purpose. For this study, P7 mice (n = 4) treated with lead or saline were deeply anesthetized and perfused 24 h following the first dose of lead. This late time interval was used because it allows enough time for all neurons that die as a result of treatment to become impregnated with silver. It is ideal for detecting the pattern of cell death but not for counting dying neurons because at 24 h many of the dead neurons have disintegrated into small fragments that cannot be identified and counted as an intact cell body. Immediately following perfusion, the brain was post-fixed in perfusate solution for 2 days. The tissue was then transected, embedded in agar, and cut on a vibratome to 70 micron-thick sections. The free-floating sections were then thoroughly washed in triple-distilled water and stained by the method of De Olmos and Ingram with modification by Corso (1997). The sections were then mounted on gel coated glass slides, dehydrated in graded alcohols, and cleared in xylene for evaluation by light microscopy.
2.3 Nissl staining
Nissl staining is a quick and easy screen for neurodegeneration and the morphology of the dying neurons can be suggestive of apoptosis. Brain sections adjacent to those selected for silver staining were mounted on gel-coated slides until thoroughly dry. After drying, the slides were rinsed in distilled water for 10 minutes and then placed in cresyl fast violet for 5–15 minutes. The slides were then rinsed under running tap water for 5 minutes, dehydrated in graded alcohols, and cleared in xylene.
2.4 Activated caspase-3 immunohistochemistry
Activated caspase-3 immunohistochemistry (AC3) is a well-accepted method for detecting neurons that are in early stages of apoptotic cell death in the rodent and primate brain (Farber et al., 2010; Olney et al., 2002; Young et al., 2005; Slikker et al., 2007). AC3 immunohistochemistry has shown to be selective for apoptosis in that in animal models in which both excitotoxic and apoptotic cell death occur, it only stains the neurons undergoing apoptosis (Olney et al., 2002). Neurons in early stages of apoptosis have abundant AC3 distributed throughout their cell body and dendritic tree and they have not yet begun to decompose. Therefore, the entire neuron, including its dendritic arbor, is easily visualized by this method, making it an ideal choice for identifying and marking dying neurons. Pilot studies showed that the time interval for visualizing the majority of dying neurons by the AC3 method is 4–8 h posttreatment with lead. Therefore, at 8 h after the first dose of lead or saline (n = 8), the animals were anesthetized and perfused transcardially. The brains were removed, post-fixed for 24 h, and cut into serial sagittal vibratome sections (70μm). The sections were washed in 0.01M PBS, quenched for 10 min in a solution of methanol containing 3% hydrogen peroxide, then incubated for 1 h in blocking solution (2% BSA/0.2% milk/0.1 % triton X-100 in PBS), followed by incubation overnight in rabbit anti-active caspase-3 antiserum (D175, Cell Signaling Technology, Beverly, Massachusetts) diluted 1:1000 in blocking solution. Following incubation with D175 primary antibody, the sections were incubated for 1 h in secondary antibody (goat anti-rabbit 1:200 in blocking solution), then reacted in the dark with ABC reagents (standard Vectastain ABC Elite Kit, Vector Labs, Burlingame, CA), followed by incubation for 15–20 min in VIP peroxidase substrate (Vector Labs, Burlingame, CA). The sections were then mounted on gel-coated glass slides, dehydrated in graded alcohols, and cleared in xylene for evaluation by light microscopy. AC3-positive cell counts were conducted in five brain regions (cortex, caudate/putamen, thalamus, hippocampus, and cerebellum).
2.5 Plastic sections for electron microscopy (EM)
We also examined the dying neurons by EM to confirm that they have ultrastructural and pathomorphological changes characteristic of neurons undergoing apoptosis (Dikranian et al., 2001). For EM analysis, a total of four animals were treated on P7 with the two doses of lead. At 8 h post-treatment, the animals were anesthetized and the brains perfusion-fixed as described above. Following post-fixation for 2 days in the perfusate solution, the brains were sliced into 100 micron-thick slabs, osmicated overnight (1% osmium tetroxide), dehydrated in graded ethanols, cleared in toluene, and embedded flat in araldite. Thin sections (1μm), were cut at selected rostro-caudal levels of the brain using a diamond knife on an MT-2B Sorval ultratome, suspended over a formvar coated slot grid (1 × 2mm opening), stained with uranyl acetate and lead citrate. Areas showing AC3-positive cells were scanned using a JEOL 100CX transmission electron microscope for neurons showing various stages of neurodegeneration to evaluate whether ultrastructural changes were consistent with those seen in apoptotic cell death.
2.6 Quantitative Cell Counts
In separate experiments conducted on P7 and P14, experimental and litter-matched control pups were randomly chosen from at least 4 litters and were treated with lead acetate or saline for histological evaluation of developmental neuroapoptosis by quantifying AC3-positive neurons. At 8 h post-treatment, the animals were anesthetized and perfused. The brains were cut into serial sagittal vibratome sections (70 μm). Every 6th sagittal section was chosen for evaluation using unbiased, systematic random sampling according to stereological principles (Gunderson et al. 1988; West et al., 1991). This permitted unilateral sampling of 6 to 10 sections from each brain depending on the area of interest and age. Each section was imaged and quantitatively evaluated using a computerized Stereo Investigator system (MicroBrightField, Inc, Colchester, VT) operated by Windows XP Pro installed on a Dell PC connected to a a Nikon Labophot-2 microscope with a Prior Optiscan motorized stage (ES103 XYZ system, Prior Scientific Inc, Rockland, MA). The Stereo Investigator software was used to trace the boundaries of the brain regions of interest (cerebral cortex, hippocampus, caudate-putamen, thalamus, and cerebellum), to measure, mark, and count neurons, and to calculate the area of each region.
To be included in the cell count, profiles needed to demonstrate a distinct soma with visible dendritic processes, or if no processes were evident, only those with a soma diameter ≥8 mm (at 20X) were counted. The preliminary population estimator function of Stereo Investigator was used to mark and count each profile to ensure that no profile would be missed or counted twice. To obtain an estimate of the total number of AC3-positive profiles in the brain region of interest, regional counts from each section were summed and then divided by the total area counted. The density of AC3-positive neurons in each brain region for a given treatment condition was calculated using the following formula: . The counts were performed by an experienced histopathologist (C.C.) blind to the treatment condition.
2.7 Lead Levels
For determination of lead levels, animals were treated with the same dosing regimen as the histological studies (n = 12 lead; n = 8 saline). Levels were obtained in separate groups of P7 animals due to the damage previously identified. After receiving the last dose of lead or saline, animals were decapitated 8 h after receiving the first dose (the same time-point as histology studies) and the trunk blood was immediately collected in a Microtainer® serum separator tube (Becton Dickinson and Company, Franklin Lakes, NJ). The samples were then diluted with a bismuth internal standard of 15 ppb (5 ml diluent/200 ml sample). Lead levels were then obtained by inductively coupled plasma mass spectrometry using an Agilent 7500 CE analyzer. (Agilent Technologies, Inc., Santa Clara, CA).
2.8 Imaging
Photomicrographs of the various histological techniques were obtained using a Kodak DCS 460 digital camera attached to a Nikon Eclipse E800M microscope or a Panasonic GP-KR222 digital camera attached to a Nikon Optiphot microscope as digital montages processed with Surveyor 3.0 software (Objective Imaging, London, UK).
2.9 Statistical Analysis
Statistical analyses were conducted using Prism 4 (GraphPad Software Inc., San Diego, CA) installed on a Mac OS X operating system. Analysis of variance (ANOVA) models were used to analyze the data. All data are shown as Mean ± S.E.M, with a probability value for significance of p < 0.05. A priori planned comparisons were conducted where appropriate, with Bonferroni correction for multiple comparisons (probability value for significance of p < 0.01).
3. Results
3.1 Silver and Nissl staining
De Olmos cupric silver staining identified a large number of neurons that were degenerating 24 h after exposure to lead in the P7 animals (Figures 1a,b). Although it does not distinguish between apoptotic and non-apoptotic cell death, the neurons were in an advanced stage of degeneration, shrunken and often subdivided into several small fragments, making it difficult to identify the neuron type (e.g. pyramidal neuron). While the observed degeneration was widespread, specific brain regions and specific populations of neurons were affected. The largest amount of damage occurred in superficial and deep cortical layers, subiculum, caudate nucleus, and certain thalamic nuclei. Less severe damage was seen in the hippocampus. Nissl staining on adjacent sections taken from the same animals revealed that cells in the same regions identified as undergoing degeneration with the De Olmos technique had dense chroamatin spheres (Figure 1c), consistent with apoptotic bodies, which are a hallmark characteristic of late-stage apoptosis, suggesting that the degenerating neurons were dying by an apoptotic mechanism.
Figure 1.
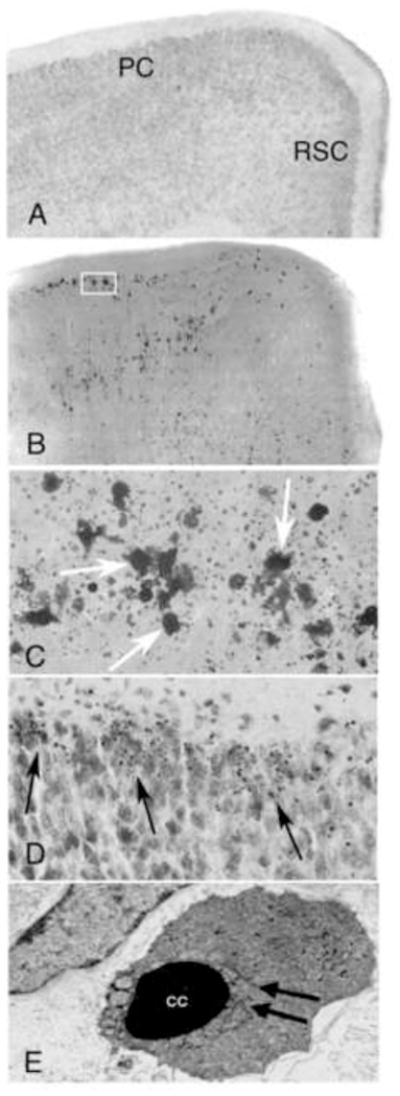
Coronal hemi-sections from the brain of a 7-day-old mouse treated with saline (A) and an animal treated with lead acetate 24 hours previously (B) stained by the De Olmos silver method. Degenerating neurons (dark areas) are abundantly present throughout, particularly in the parietal and retrosplenial cortices (PC and RSC, respectively). The box indicates the region illustrated in the next panel (C) at a higher magnification. Neurons (arrows) are in an advanced stage of degeneration. Their amorphous shape and sourrounding debris makes it difficult to determine their neuronal type. Image (D) demonstrates a Nissl stained section of parietal cortex in a lead treated animal at 24 hours. Abundant dense chromatin spheres (i.e. apoptotic bodies) are present (arrows). Image (E) is an electron micrograph of a degenerating neuron taken from a section of the parietal cortex. Neuron is condensed and has clumped chromatin (CC) with fragmentation of the nuclear membrane (arrows), verifying that the degenerative process is apoptotic.
3.2 Activated caspase-3 immunohistochemistry
In transverse hemi-sections, the dense activation of caspase-3 was noted to occur in the same population of neurons identified as undergoing degeneration with the De Olmos silver staining technique (Figure 2). Sagittal sections in animals treated with the same dosing and timing regimens demonstrated similar caspase-3 damage in the areas noted in the transverse sections as well as periventricuar/aquaductal areas of the lateral and third ventricles (Figure 3). Increased staining was also noted in the cerebellum, particularly involving the internal granule cell layers (Figures 3 and 4c,f). Separate 2 X 4 mixed model ANOVAs (between treatment groups X within brain regions) were conducted for each age group. If a main effect of lead treatment was found, a priori planned comparisons were conducted between groups for each brain region, with Bonferroni corrections for multiple comparisons.
Figure 2.
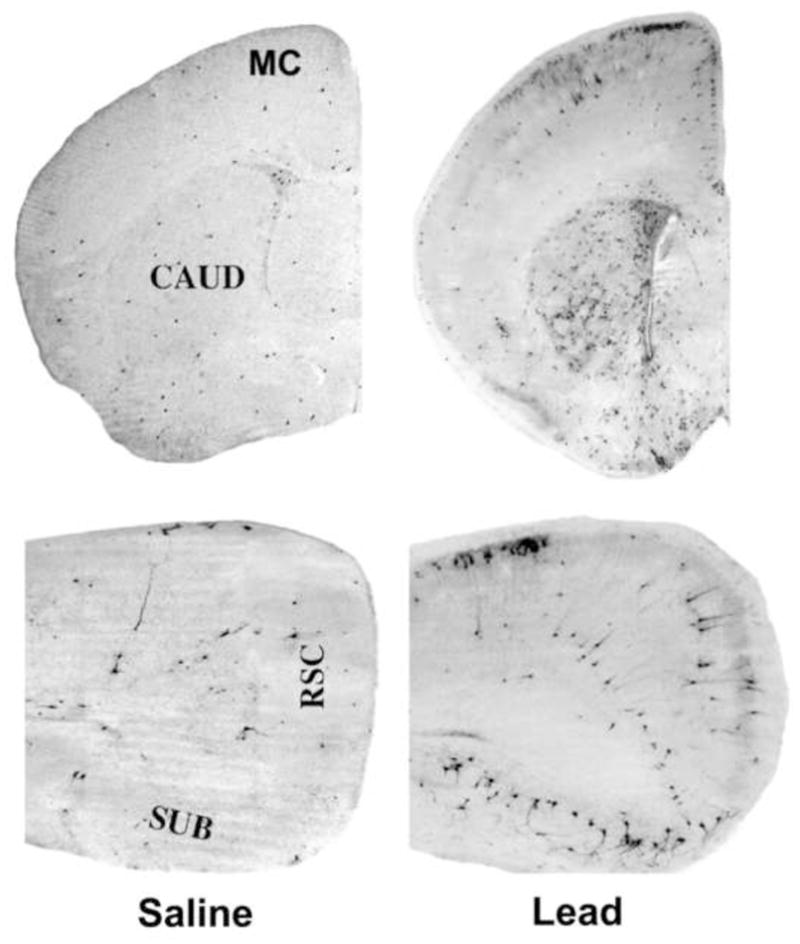
Coronal hemi-sections of 7-day-old mice treated with saline or lead acetate. Sections were stained immunohistochemically with antibodies to activated caspase-3. The saline control brain (left) shows a pattern of caspase-3 activation that occurs normally in the 7-day-old mouse brain and is attributable to physiological cell death. Neurons displaying activated caspase-3 are prevalent in several brain regions of the lead-exposed animal. Notable areas of involvement include the anterior motor cortex (MC), caudate nucleus (CAUD), subiculum (SUB), and retrosplenial cortex (RSC).
Figure 3.
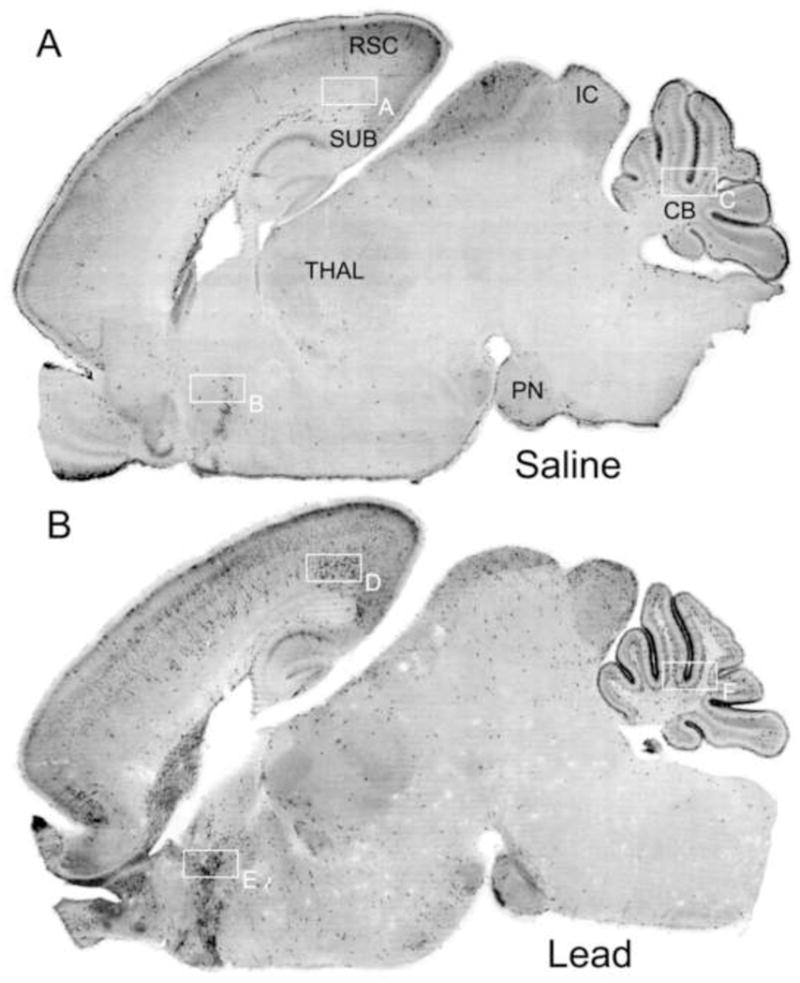
Sagittal sections of 7-day-old mice treated with saline or lead acetate immunostained with antibodies to activated caspase-3. Image (A) is a saline control brain showing a pattern of caspase-3 activation that occurs normally in the 7-day-old mouse brain and is attributable to physiological cell death. Image (B) is the brain from a lead-treated animal. Numerous neurons displaying activated caspase-3 are prevalent in several brain regions including: the subiculum (SUB), retrosplenial cortex (RSC), and diffuse layers of the superficial and deep cortices; the inferior colliculis (IC), pontine nucleus (PN), and cerebellum (CB). High power photomicrographs of panels A through F are shown in figure 4.
Figure 4.
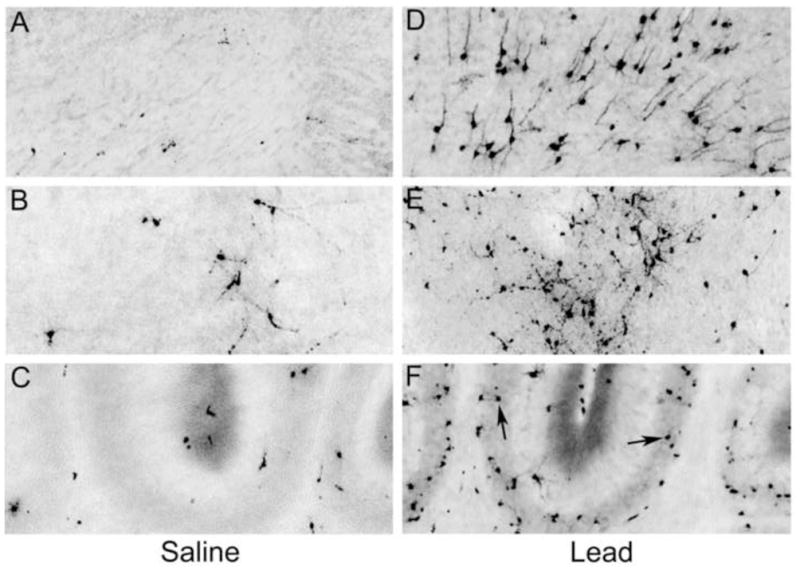
Panels A, B, and C (control animal) and panels D, E, and F (lead exposed animal) represent their respective images from Figure 3 at a higher magnification. Panels A and D compare a region of deep cortical layers - the pattern of caspase-3 activation in the saline treated animal (A) is more sparse and random compared to that seen in the lead-treated animal (D). Panels B and E compare an area of the caudate/putamen in which there is clearly more caspase-3 positive cells in the lead treated animal (E) versus the saline treated animal (B). Panels C and F demonstrate the vermion region of the cerebellum. The black arrows represent increased caspase-3 activation in the internal granular cell layer of the lead treated animal (F) versus the saline control (C).
Lead treatment at P7 caused significant brain damage compared to normal levels of neuroapoptosis observed in saline controls [F (1,14) = 6.46, p = 0.02]. Lead-treated animals had increased cell death in the cortex, hippocampus, caudate-putamen, and thalamus compared to saline controls [F (1,14) = 19.5, 8.40, 4.15, 4.53, respectively; Fig. 5a].
Figure 5.
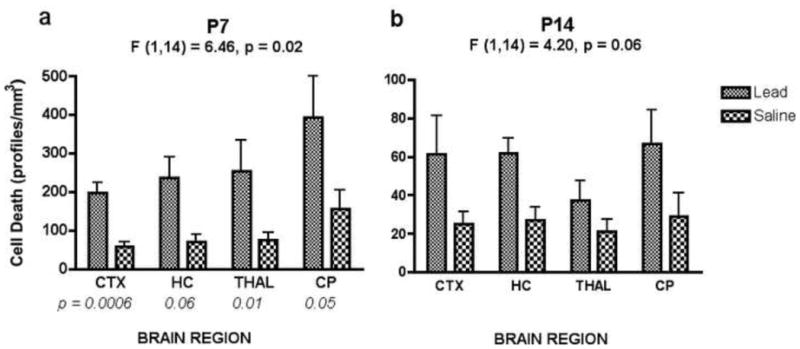
Results of quantification of cell death in P7 and P14 mice according to brain region (Mean ± SEM; n = 8). A) In animals treated at P7, results showed a significant overall main effect of lead exposure, with every brain region showing an increase in cell death compared to saline controls. Probability values for significance of individual planned comparisons between groups for each brain region are listed below each set of bars. B) At P14, despite increased cell death in each brain region, there was no significant overall treatment effect. Also, note the scale difference of the y-axes for the two age groups. CTX = cortex, HC = hippocampus, THAL = thalamus, CP = caudate/putamen.
Consistent with the window of vulnerability seen with NMDA antagonist induced apoptosis, lead exposure at P14 did not cause a significant increase of apoptosis above that in controls. ANOVA results showed no overall significant main effect of treatment for P14 animals compared to saline controls [F (1,14) = 4.20, p = 0.06; Fig. 5b].
3.3 Electron microscopy
Apoptosis was originally defined using ultrastructural criteria and EM histological evaluation remains the gold standard for determining whether the observed neurodegeneration is apoptotic in nature [46]. Therefore, EM analysis was performed for ultrastructural qualification of the observed neurodegeneration in order to confirm that it is an apoptotic process. Regions identified as having silver- and AC3-positive neurons were selected for further examination by EM. Photomicrographs revealed that the degenerating neurons were condensed, with clumped chromatin and fragmentation of the nuclear membrane, verifying that the neurodegenerative process was apoptotic in nature (Figure 1b).
3.4 Lead Levels
Blood lead levels obtained 8 h after initial treatment are presented in Figure 6. The mean blood level (± SEM) was 0.15 (± 0.05) μg/mL in the control group (n = 8) and 8.10 (± 1.34) μg/mL in the lead exposed group (n = 9). Although the mean lead blood levels are lower than expected after a relatively large acute exposure, lead has very complex absorption and distribution phases that may be responsible for producing lower than expected lead levels. Blood lead levels in human children lower than 10 μg/dl (the accepted international safe limit) have been shown to cause intellectual impairment (Canfield et al., 2003a,b). Therefore, the levels produced in our experimental animals are consistent with human levels that have been shown to have a negative impact on neurodevelopmental outcome.
Figure 6.
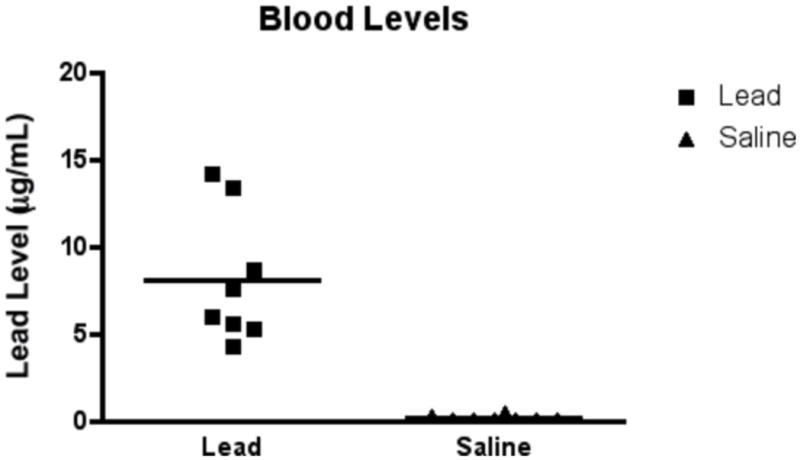
Blood lead levels obtained 8 h after initial treatmenton P7 animals. The mean blood level (± SEM) was 0.15 (± 0.05) μg/mL in the control group (n = 8) and 8.10 (± 1.34) μg/mL in the lead exposed group (n = 9).
4. Discussion
We have demonstrated that acute lead exposure produces blood lead levels near the accepted international safe limit, and triggers a wave of apoptotic neurodegeneration in the neonatal mouse brain. Lead-induced developmental neuroapoptosis was detected in a number of brain regions. The most heavily affected regions included superficial and deep cortical layers, the caudate nucleus, and the subiculum. Results of electron microscopy confirmed that the degenerating neurons met the ultrastructural criteria for apoptosis. Consistent with the role of caspase-3 in apoptosis, we also found that the dying neurons expressed activated caspase-3 early in the degenerative process.
While in vitro and indirect evidence for lead-induced neuronal cell death exists (He et al., 2000), we believe this is the first report documenting specific cortical and subcortical neurons undergoing lead-induced apoptotic degeneration in an in vivo neurodevelopmental model. Fox and colleagues have demonstrated toxicity and cellular death in vivo in retinal rod and bipolar cells [50]. They exposed immature rats (0–21 days of age) and adult rats to low or moderate doses of lead. Ultrastructural changes consistent with the classical morphological features of apoptosis were seen in degenerating rod and bipolar cells. Although adult animals exhibited this retinal degeneration, a pronounced age-dependence occurred with immature animals being much more sensitive. This is consistent with the age sensitivity noted in our findings and previous reports of age sensitive apoptosis after exposure to NMDA antagonists (Dribben et al, 2009; Ikonomidou et al., 1999).
Many of the studies addressing neurotoxicity associated with lead exposure involve chronic dosing regimens that are more consistent with environmental exposure in children. Clinical evidence has clearly established that chronic exposure causes cognitive deficits in humans (Baghurst et al., 1992; Bellinger 2004; Lanphear et al., 2005), and these results have been been corroborated with behavioral studies in animals after chronic dosing (Brockel et al., 1998; Moriera et al., 2001). Although many of the studies using chronic dosing effectively demonstrate neurotoxicity by cellular markers or indirect methods, it is difficult to directly visualize the pathomorphological consequences of the toxic effects of lead. Liu et al. (2010) have demonstrated a dose-dependent increase in apoptosis of rat hippocampal neurons by both an increase in the expression of apoptosis-related genes (XIAP mRNA) and direct visualization of neurons by TUNEL staining. Animals exposed to lead acetate for 6-weeks demonstrated chronic toxicity (with significant changes in the group with low blood lead level ranging from 4.52 to 11.40 μg/dl). However, in contrast to our studies, those animals were 30 days old at the initiation of exposure, placing them well beyond the proposed window of vulnerability of developing neurons in rodents (Rice and Barone, 2000). Although acute lead exposures are rare, it provides a method for the direct observations of the cytotoxic actions of lead, and previous studies examining ultrastructural changes utilized acute dosing regimens (Bouldin and Krigman, 1975; Press 1977). It remains that the ultimate consequences of lead exposure, whether acute or chronic, on the structural and functional integrity of the adult brain are unknown. Behavioral studies suggest that the exposure causes permanent changes in the brain that lead to significant functional deficit. In our study, we used acute dosing to identify potentially important pathomorphological changes that could occur as the result of chronic exposure and be ultimately responsible for some of the neuropsychiatric disturbances associated with chronic lead exposure. Chronic lead exposure at levels experienced by children, is occurring during the susceptible neurodevelopmental period, and does result in the cognitive and behavioral disturbances of lead poisoned children. Future studies are needed to investigate the hypothesis that apoptotic neurodegeneration caused by chronic exposure is a contributing factor in the poor neurodevelopmental outcome of children exposed to lead.
While lead has a multitude of neurotoxic effects, the specific ages at which the CNS was susceptible to neurotoxic properties of lead and the pattern of specific neuronal populations undergoing degeneration are similar to that seen with NMDA antagonist induced apoptotic neurodegeneration (Dribben et al., 2009; Ikonomidou et al. 1999). These similarities suggest that interference with NMDA neurotransmission could underlie the neurotoxic potential of lead. Lead can bind at divalent cationic metal sites intrinsic to the NMDA receptor complex to directly inhibit functioning of the NMDA receptor, substitute for calcium during activation of the NMDA channel, and/or induce alterations in NMDA receptor subunit expression (Lasley et al., 2001; Guilarte et al., 1998; Toscano et al., 2002). Lead can also inhibit voltage-gated calcium channels or exploit these channels as a means of entry into cells (Kerper and Hinkle,1997; Peng, 2002). Interfering with calcium entry into cells can disrupt intracellular calcium concentrations effecting cellular activity and calcium mediated second messenger systems, such as protein kinase C, that are dependent on NMDA neurotransmission for normal function (Cremin et al., 2002). Elucidating the exact mechanism of action of lead in producing apoptosis will require additional investigation.
Although education, prevention, and sound public health policies are the key to preventing the devastating neurotoxic effects of lead, there is no way to escape the environmental burden of lead and the inevitable exposure of humans and animals. In our study we have demonstrated that acute lead exposure can induce apoptosis in developing neurons. Expanding our understanding of the mechanism of neuronal injury and death after exposure to lead will provide a basis to understand the potential underlying pathophysiology, develop potential protective strategies and improved treatments, and/or identify individuals or populations at risk.
Highlights.
Neurtoxicity can occur after exposureto lead in immature brains.
Various histological techniques identified increased apoptosis in young mice.
Caspase-3 is an immunohistochemical marker for apoptotic cell death.
Damage was assessed by identifying activated caspase-3 positive neurons.
Significant damage occurred in postnatal day 7 mice but was absent in day 14 mice.
Acknowledgments
This work was supported by NIH grants T32DA07261 (WHD), 1K08NS048113-01A2 (WHD), T32 MH14677 (CC), and P30HD062171 (NBF).
Footnotes
Publisher's Disclaimer: This is a PDF file of an unedited manuscript that has been accepted for publication. As a service to our customers we are providing this early version of the manuscript. The manuscript will undergo copyediting, typesetting, and review of the resulting proof before it is published in its final citable form. Please note that during the production process errors may be discovered which could affect the content, and all legal disclaimers that apply to the journal pertain.
References
- Anastasio NC, Xia Y, O’Connor ZR, Johnson KM. Differential role of N-methyl-D-aspartate receptor subunits 2A and 2B in mediating phencyclidine-induced perinatal neuronal apoptosis and behavioral deficits. Neuroscience. 2009;163:1181–91. doi: 10.1016/j.neuroscience.2009.07.058. [DOI] [PMC free article] [PubMed] [Google Scholar]
- Audesirk G. Electrophysiology of lead intoxication: effects on voltage-sensitive ion channels. Neurotoxicology. 1993;14:137–47. [PubMed] [Google Scholar]
- Baghurst PA, Tong S, Sawyer MG, Burns J, McMichael AJ. Environmental exposure to lead and children’s intelligence at the age of seven years. The Port Pirie Cohort Study. N Engl J Med. 1992;327:1279–84. doi: 10.1056/NEJM199210293271805. [DOI] [PubMed] [Google Scholar]
- Bellinger DC. Lead. Pediatrics. 2004;113:1016–22. [PubMed] [Google Scholar]
- Binns HJ, Campbell C, Brown MJ Centers for Disease Control and Prevention Advisory Committee on Childhood Lead Poisoning Prevention. Interpreting and managing blood lead levels of less than 10 microg/dL in children and reducing childhood exposure to lead: recommendations of the Centers for Disease Control and Prevention Advisory Committee on Childhood Lead Poisoning Prevention. Pediatrics. 2007;120:e1285–98. doi: 10.1542/peds.2005-1770. [DOI] [PubMed] [Google Scholar]
- Bouldin TW, Krigman MR. Acute lead encephalopathy in the guinea pig. Acta Neuropathol. 1975;33(3):185–90. doi: 10.1007/BF00688392. [DOI] [PubMed] [Google Scholar]
- Brockel BJ, Cory-Slechta DA. Lead, attention, and impulsive behavior: changes in a fixed-ratio waiting-for-reward paradigm. Pharmacol Biochem Behav. 1998;60:545–52. doi: 10.1016/s0091-3057(98)00023-9. [DOI] [PubMed] [Google Scholar]
- Busselberg D. Calcium channels as target sites of heavy metals. Toxicol Lett. 1995;82–83:255–61. doi: 10.1016/0378-4274(95)03559-1. [DOI] [PubMed] [Google Scholar]
- Canfield RL, Henderson CR, Jr, Cory-Slechta DA, Cox C, Jusko TA, Lanphear BP. Intellectual impairment in children with blood lead concentrations below 10 microg per deciliter. N Engl J Med. 2003;348:1517–26. doi: 10.1056/NEJMoa022848. [DOI] [PMC free article] [PubMed] [Google Scholar]
- Canfield RL, Kreher DA, Cornwell C, Henderson CR., Jr Low-level lead exposure, executive functioning, and learning in early childhood. Child Neuropsychol. 2003;9:35–53. doi: 10.1076/chin.9.1.35.14496. [DOI] [PubMed] [Google Scholar]
- Carpenter DO, Matthews MR, Parsons PJ, Hori N\. Long-term potentiation in the piriform cortex is blocked by lead. Cell Mol Neurobiol. 1994;14:723–33. doi: 10.1007/BF02088680. [DOI] [PMC free article] [PubMed] [Google Scholar]
- Chiodo LM, Jacobson SW, Jacobson JL. Neurodevelopmental effects of postnatal lead exposure at very low levels. Neurotoxicol Teratol. 2004;26:359–71. doi: 10.1016/j.ntt.2004.01.010. [DOI] [PubMed] [Google Scholar]
- Chisolm JJ., Jr Evolution of the management and prevention of childhood lead poisoning: dependence of advances in public health on technological advances in the determination of lead and related biochemical indicators of its toxicity. Environ Res. 2001;86:111–21. doi: 10.1006/enrs.2001.4260. [DOI] [PubMed] [Google Scholar]
- Chisolm JJ., Jr The road to primary prevention of lead toxicity in children. Pediatrics. 2001;107:581–3. doi: 10.1542/peds.107.3.581. [DOI] [PubMed] [Google Scholar]
- Corso TD, Sesma MA, Tenkova TI, Der TC, Wozniak DF, Farber NB, Olney JW. Multifocal brain damage induced by phencyclidine is augmented by pilocarpine. Brain Res. 1997;752:1–14. doi: 10.1016/s0006-8993(96)01347-9. [DOI] [PubMed] [Google Scholar]
- Cremin JD, Jr, Smith DR. In vitro vs. in vivo Pb effects on brain protein kinase C activity. Environ Res. 2002;90:191–9. doi: 10.1016/s0013-9351(02)00007-5. [DOI] [PubMed] [Google Scholar]
- DeOlmos JS, Ingram WR. An improved cupric-silver method for impregnation of axonal and terminal degeneration. Brain Res. 1971;33:523–9. doi: 10.1016/0006-8993(71)90130-2. [DOI] [PubMed] [Google Scholar]
- Dikranian K, Ishimaru MJ, Tenkova T, Labruyere J, Qin YQ, Ikonomidou C, Olney JW. Apoptosis in the in vivo mammalian forebrain. Neurobiol Dis. 2001;8:359–79. doi: 10.1006/nbdi.2001.0411. [DOI] [PubMed] [Google Scholar]
- Dikranian K, Qin YQ, Labruyere J, Nemmers B, Olney JW. Ethanol-induced neuroapoptosis in the developing rodent cerebellum and related brain stem structures. Brain Res Dev Brain Res. 2005;155:1–13. doi: 10.1016/j.devbrainres.2004.11.005. [DOI] [PubMed] [Google Scholar]
- Dobbing J, Sands J. Comparative aspects of the brain growth spurt. Early Hum Dev. 1979;3:79–83. doi: 10.1016/0378-3782(79)90022-7. [DOI] [PubMed] [Google Scholar]
- Dribben WH, Creeley CE, Wang HH, Smith DJ, Farber NB, Olney JW. High dose magnesium sulfate exposure induces apoptotic cell death in the developing neonatal mouse brain. Neonatology. 2009;96:23–32. doi: 10.1159/000201327. [DOI] [PMC free article] [PubMed] [Google Scholar]
- Farber NB, Creeley CE, Olney JW. Alcohol-induced neuroapoptosis in the fetal macaque brain. Neurobiol Dis. 2010;40:200–6. doi: 10.1016/j.nbd.2010.05.025. [DOI] [PMC free article] [PubMed] [Google Scholar]
- Fox DA, Campbell ML, Blocker YS. Functional alterations and apoptotic cell death in the retina following developmental or adult lead exposure. Neurotoxicology. 1997;18:645–64. [PubMed] [Google Scholar]
- Fredriksson A, Archer T. Neurobehavioural deficits associated with apoptotic neurodegeneration and vulnerability for ADHD. Neurotox Res. 2004;6:435–56. doi: 10.1007/BF03033280. [DOI] [PubMed] [Google Scholar]
- Fredriksson A, Pontén E, Gordh T, Eriksson P. Neonatal exposure to a combination of N-methyl-D-aspartate and gamma-aminobutyric acid type A receptor anesthetic agents potentiates apoptotic neurodegeneration and persistent behavioral deficits. Anesthesiology. 2007;107:427–36. doi: 10.1097/01.anes.0000278892.62305.9c. [DOI] [PubMed] [Google Scholar]
- Goldstein GW. Evidence that lead acts as a calcium substitute in second messenger metabolism. Neurotoxicology. 1993;14:97–101. [PubMed] [Google Scholar]
- Guilarte TR, Miceli RC. Age-dependent effects of lead on [3H]MK-801 binding to the NMDA receptor-gated ionophore: in vitro and in vivo studies. Neurosci Lett. 1992;148:27–30. doi: 10.1016/0304-3940(92)90796-a. [DOI] [PubMed] [Google Scholar]
- Guilarte TR, Miceli RC, Jett DA. Neurochemical aspects of hippocampal and cortical Pb2+ neurotoxicity. Neurotoxicology. 1994;15:459–66. [PubMed] [Google Scholar]
- Guilarte TR, Miceli RC, Jett DA. Biochemical evidence of an interaction of lead at the zinc allosteric sites of the NMDA receptor complex: effects of neuronal development. Neurotoxicology. 1995;16:63–71. [PubMed] [Google Scholar]
- Guilarte TR. Glutamatergic system and developmental lead neurotoxicity. Neurotoxicology. 1997;18:665–72. [PubMed] [Google Scholar]
- Guilarte TR, McGlothan JL. Hippocampal NMDA receptor mRNA undergoes subunit specific changes during developmental lead exposure. Brain Res. 1998;790:98–107. doi: 10.1016/s0006-8993(98)00054-7. [DOI] [PubMed] [Google Scholar]
- Guilarte TR, McGlothan JL. Selective decrease in NR1 subunit splice variant mRNA in the hippocampus of Pb2+-exposed rats: implications for synaptic targeting and cell surface expression of NMDAR complexes. Brain Res Mol Brain Res. 2003;113:37–43. doi: 10.1016/s0169-328x(03)00083-4. [DOI] [PubMed] [Google Scholar]
- Gundersen HJ, Bagger P, Bendtsen TF, et al. The new stereological tools: dissector, fractionator, nucleator and point sampled intercepts and their use in pathological research and diagnosis. APMIS. 1988;96:857–881. doi: 10.1111/j.1699-0463.1988.tb00954.x. [DOI] [PubMed] [Google Scholar]
- Hansen HH, Briem T, Dzietko M, Sifringer M, Voss A, Rzeski W, Zdzisinska B, Thor F, Heumann R, Stepulak A, Bittigau P, Ikonomidou C. Mechanisms leading to disseminated apoptosis following NMDA receptor blockade in the developing rat brain. Neurobiol Dis. 2004;16:440–53. doi: 10.1016/j.nbd.2004.03.013. [DOI] [PubMed] [Google Scholar]
- He L, Poblenz AT, Medrano CJ, Fox DA. Lead and calcium produce rod photoreceptor cell apoptosis by opening the mitochondrial permeability transition pore. J Biol Chem. 2000;275:12175–84. doi: 10.1074/jbc.275.16.12175. [DOI] [PubMed] [Google Scholar]
- Ikonomidou C, Bosch F, Miksa M, Bittigau P, Vöckler J, Dikranian K, Tenkova TI, Stefovska V, Turski L, Olney JW. Blockade of NMDA receptors and apoptotic neurodegeneration in the developing brain. Science. 1999;283:70–4. doi: 10.1126/science.283.5398.70. [DOI] [PubMed] [Google Scholar]
- Jevtovic-Todorovic V, Hartman RE, Izumi Y, Benshoff ND, Dikranian K, Zorumski CF, Olney JW, Wozniak DF. Early exposure to common anesthetic agents causes widespread neurodegeneration in the developing rat brain and persistent learning deficits. J Neurosci. 2003;23(3):876–82. doi: 10.1523/JNEUROSCI.23-03-00876.2003. [DOI] [PMC free article] [PubMed] [Google Scholar]
- Kerper LE, Hinkle PM. Cellular uptake of lead is activated by depletion of intracellular calcium stores. J Biol Chem. 1997;272:8346–52. doi: 10.1074/jbc.272.13.8346. [DOI] [PubMed] [Google Scholar]
- Komuro H, Rakic P. Modulation of neuronal migration by NMDA receptors. Science. 1993;260:95–7. doi: 10.1126/science.8096653. [DOI] [PubMed] [Google Scholar]
- Lanphear BP, Hornung R, Khoury J, Yolton K, Baghurst P, Bellinger DC, Canfield RL, Dietrich KN, Bornschein R, Greene T, Rothenberg SJ, Needleman HL, Schnaas L, Wasserman G, Graziano J, Roberts R. Low-level environmental lead exposure and children’s intellectual function: an international pooled analysis. Environ Health Perspect. 2005;113:894–9. doi: 10.1289/ehp.7688. [DOI] [PMC free article] [PubMed] [Google Scholar]
- Lasley SM, Green MC, Gilbert ME. Rat hippocampal NMDA receptor binding as a function of chronic lead exposure level. Neurotoxicol Teratol. 2001;23:185–9. doi: 10.1016/s0892-0362(01)00116-7. [DOI] [PubMed] [Google Scholar]
- Lewis J. Lead Poisoning: A Historical Perspective. [September 13, 2010];EPA Journal. 1985 Accessed online at http://www.epa.gov/history/topics/perspect/lead.htm.
- Liu J, Han D, Li Y, Zheng L, Gu C, Piao Z, Au WW, Xu X, Huo X. Lead affects apoptosis and related gene XIAP and Smac expression in the hippocampus of developing rats. Neurochem Res. 2010;35:473–9. doi: 10.1007/s11064-009-0083-9. [DOI] [PubMed] [Google Scholar]
- Lorenzo AV, Gewirtz M, Averill D. CNS lead toxicity in rabbit offspring. Environ Res. 1978;17:131–50. doi: 10.1016/0013-9351(78)90067-1. [DOI] [PubMed] [Google Scholar]
- Lyall A, Swanson J, Liu C, Blumenthal TD, Turner CP. Neonatal exposure to MK801 promotes prepulse-induced delay in startle response time in adult rats. Exp Brain Res. 2009;197:215–22. doi: 10.1007/s00221-009-1906-2. [DOI] [PMC free article] [PubMed] [Google Scholar]
- Markowitz G, Rosner D. Cater to the children: the role of the lead industry in a public health tragedy, 1900–1955. Am J Public Health. 2000;90:36–46. doi: 10.2105/ajph.90.1.36. [DOI] [PMC free article] [PubMed] [Google Scholar]
- McCauley PT, Bull RJ, Tonti AP, Lutkenhoff SD, Meister MV, Doerger JU, Stober JA. The effect of prenatal and postnatal lead exposure on neonatal synaptogenesis in rat cerebral cortex. J Toxicol Environ Heal th. 1982;10:639–51. doi: 10.1080/15287398209530283. [DOI] [PubMed] [Google Scholar]
- Moreira EG, Vassilieff I, Vassilieff VS. Developmental lead exposure: behavioral alterations in the short and long term. Neurotoxicol Teratol. 2001;23:489–95. doi: 10.1016/s0892-0362(01)00159-3. [DOI] [PubMed] [Google Scholar]
- Nikizad H, Yon JH, Carter LB, Jevtovic-Todorovic V. Early exposure to general anesthesia causes significant neuronal deletion in the developing rat brain. Ann N Y Acad Sci. 2007;1122:69–82. doi: 10.1196/annals.1403.005. [DOI] [PubMed] [Google Scholar]
- Olney JW, Tenkova T, Dikranian K, Muglia LJ, Jermakowicz WJ, D’Sa C, Roth KA. Ethanol-induced caspase-3 activation in the in vivo developing mouse brain. Neurobiol Dis. 2002;9:205–19. doi: 10.1006/nbdi.2001.0475. [DOI] [PubMed] [Google Scholar]
- Olney JW, Wozniak DF, Jevtovic-Todorovic V, Farber NB, Bittigau P, Ikonomidou C. Drug-induced apoptotic neurodegeneration in the developing brain. Brain Pathol. 2002;12:488–98. doi: 10.1111/j.1750-3639.2002.tb00467.x. [DOI] [PMC free article] [PubMed] [Google Scholar]
- Peng S, Hajela RK, Atchison WD. Characteristics of block by Pb2+ of function of human neuronal L-, N-, and R-type Ca2+ channels transiently expressed in human embryonic kidney 293 cells. Mol Pharmacol. 2002;62:1418–30. doi: 10.1124/mol.62.6.1418. [DOI] [PubMed] [Google Scholar]
- Pesić V, Milanović D, Tanić N, Popić J, Kanazir S, Jevtović-Todorović V, Ruzdijić S. Potential mechanism of cell death in the developing rat brain induced by propofol anesthesia. Int J Dev Neurosci. 2009;27:279–87. doi: 10.1016/j.ijdevneu.2008.12.005. [DOI] [PMC free article] [PubMed] [Google Scholar]
- Press MF. Lead encephalopathy in neonatal Long-Evans rats: morphologic studies. J Neuropathol Exp Neurol. 1977;36:169–93. doi: 10.1097/00005072-197701000-00014. [DOI] [PubMed] [Google Scholar]
- Rice D, Barone S. Critical periods of vulnerability for the developing nervous system: evidence from human and animal models. Environ Health Perspect. 2000;108(S3):535–544. [Google Scholar]
- Schulte S, Muller WE, Friedberg KD. In vitro and in vivo effects of lead on specific 3H-PN200-110 binding to dihydropyridine receptors in the frontal cortex of the mouse brain. Toxicology. 1995;97:113–21. doi: 10.1016/0300-483x(94)02930-s. [DOI] [PubMed] [Google Scholar]
- Simons TJ. Lead-calcium interactions in cellular lead toxicity. Neurotoxicology\ 1993;14:77–85. [PubMed] [Google Scholar]
- Slikker W, Jr, Zou X, Hotchkiss CE, Divine RL, Sadovova N, Twaddle NC, Doerge DR, Scallet AC, Patterson TA, Hanig JP, Paule MG, Wang C. Ketamine-induced neuronal cell death in the perinatal rhesus monkey. Toxicol Sci. 2007;98:145–58. doi: 10.1093/toxsci/kfm084. [DOI] [PubMed] [Google Scholar]
- Soriano SG, Liu Q, Li J, Liu JR, Han XH, Kanter JL, Bajic D, Ibla JC. Ketamine activates cell cycle signaling and apoptosis in the neonatal rat brain. Anesthesiology. 2010;112:1155–63. doi: 10.1097/ALN.0b013e3181d3e0c2. [DOI] [PubMed] [Google Scholar]
- Struzynska L, Walski M, Gadamski R, Dabrowska-Bouta B, Rafalowska U. Lead-induced abnormalities in blood-brain barrier permeability in experimental chronic toxicity. Mol Chem Neuropatho. 1997;31(3):207–24. doi: 10.1007/BF02815125. [DOI] [PubMed] [Google Scholar]
- Toscano CD, Hashemzadeh-Gargari H, McGlothan JL, Guilarte TR. Developmental Pb2+ exposure alters NMDAR subtypes and reduces CREB phosphorylation in the rat brain. Brain Res Dev Brain Res. 2002;139:217–26. doi: 10.1016/s0165-3806(02)00569-2. [DOI] [PubMed] [Google Scholar]
- West MJ, Slomainka L, Gundersen HJ. Unbiased stereological estimation of the total number of neurons in the subdivisions of the rat hippocampus using the optical fractionator. Anat Rec. 1991;231:482–497. doi: 10.1002/ar.1092310411. [DOI] [PubMed] [Google Scholar]
- White LD, Cory-Slechta DA, Gilbert ME, Tiffany-Castiglioni E, Zawia NH, Virgolini M, Rossi-George A, Lasley SM, Qian YC, Basha MR. New and evolving concepts in the neurotoxicology of lead. Toxicol Appl Pharmacol. 2007;225:1–27. doi: 10.1016/j.taap.2007.08.001. [DOI] [PubMed] [Google Scholar]
- Winder C, Garten LL, Lewis PD. The morphological effects of lead on the developing central nervous system. Neuropathol Appl Neurobiol. 1983;9:87–108. doi: 10.1111/j.1365-2990.1983.tb00328.x. [DOI] [PubMed] [Google Scholar]
- Winneke G, Lilienthal H, Krämer U. The neurobehavioural toxicology and teratology of lead. Arch Toxicol Suppl. 1996;18:57–70. doi: 10.1007/978-3-642-61105-6_7. [DOI] [PubMed] [Google Scholar]
- Wozniak DF, Hartman RE, Boyle MP, Vogt SK, Brooks AR, Tenkova T, Young C, Olney JW, Muglia LJ. Apoptotic neurodegeneration induced by ethanol in neonatal mice is associated with profound learning/memory deficits in juveniles followed by progressive functional recovery in adults. Neurobiol Dis. 2004;17:403–14. doi: 10.1016/j.nbd.2004.08.006. [DOI] [PubMed] [Google Scholar]
- Xu J, Ji LD, Xu LH. Lead-induced apoptosis in PC 12 cells: involvement of p53, Bcl-2 family and caspase-3. Toxicol Lett. 2006;166:160–7. doi: 10.1016/j.toxlet.2006.06.643. [DOI] [PubMed] [Google Scholar]
- Young C, Roth KA, Klocke BJ, West T, Holtzman DM, Labruyere J, Qin YQ, Dikranian K, Olney JW. Role of caspase-3 in ethanol-induced developmental neurodegeneration. Neurobiol Dis. 2005;20:608–14. doi: 10.1016/j.nbd.2005.04.014. [DOI] [PubMed] [Google Scholar]
- Young C, Straiko MM, Johnson SA, Creeley C, Olney JW. Ethanol causes and lithium prevents neuroapoptosis and suppression of pERK in the infant mouse brain. Neurobiol Dis. 2008;31:355–60. doi: 10.1016/j.nbd.2008.05.009. [DOI] [PMC free article] [PubMed] [Google Scholar]
- Yuede CM, Wozniak DF, Creeley CE, Taylor GT, Olney JW, Farber NB. Behavioral consequences of NMDA antagonist-induced neuroapoptosis in the infant mouse brain. PLoS One. 2010;5:e11374. doi: 10.1371/journal.pone.0011374. [DOI] [PMC free article] [PubMed] [Google Scholar]
- Zhang XY, Liu AP, Ruan DY, Liu J. Effect of developmental lead exposure on the expression of specific NMDA receptor subunit mRNAs in the hippocampus of neonatal rats by digoxigenin-labeled in situ hybridization histochemistry. Neurotoxicol Teratol. 2002;24:149–60. doi: 10.1016/s0892-0362(01)00210-0. [DOI] [PubMed] [Google Scholar]
- Zou X, Patterson TA, Divine RL, Sadovova N, Zhang X, Hanig JP, Paule MG, Slikker W, Jr, Wang C. Prolonged exposure to ketamine increases neurodegeneration in the developing monkey brain. Int J Dev Neurosci. 2009;27:727–31. doi: 10.1016/j.ijdevneu.2009.06.010. [DOI] [PubMed] [Google Scholar]