

Abstract
Increased deposition of specific extracellular matrix (ECM) components is a characteristic of insulin-resistant skeletal muscle. Hyaluronan (HA) is a major constituent of the ECM. The hypotheses that 1) HA content is increased in the ECM of insulin-resistant skeletal muscle and 2) reduction of HA in the muscle ECM by long-acting pegylated human recombinant PH20 hyaluronidase (PEGPH20) reverses high-fat (HF) diet–induced muscle insulin resistance were tested. We show that muscle HA was increased in HF diet–induced obese (DIO) mice and that treatment of PEGPH20, which dose-dependently reduced HA in muscle ECM, decreased fat mass, adipocyte size, and hepatic and muscle insulin resistance in DIO mice at 10 mg/kg. Reduced muscle insulin resistance was associated with increased insulin signaling, muscle vascularization, and percent cardiac output to muscle rather than insulin sensitization of muscle per se. Dose-response studies revealed that PEGPH20 dose-dependently increased insulin sensitivity in DIO mice with a minimally effective dose of 0.01 mg/kg. PEGPH20 at doses of 0.1 and 1 mg/kg reduced muscle HA to levels seen in chow-fed mice, decreased fat mass, and increased muscle glucose uptake. These findings suggest that ECM HA is a target for treatment of insulin resistance.
The extracellular matrix (ECM) is important to cellular functions (1,2). An increase in specific components that comprise the matrix and the basement membrane is a characteristic of metabolic disorders including insulin resistance, obesity, and diabetes (3–5). Collagens I, III, and IV, the most abundant structural components of the ECM (6), are increased in insulin-resistant muscle (3,7). Collagen VI, the collagen isoform enriched in adipose tissue, is increased in adipose tissue of obese subjects (4). Previous studies show that hyaluronan (HA), an anionic, nonsulfated glycosaminoglycan is increased in injured aorta of insulin-resistant rats (8) and pancreatic islets of nonobese diabetic mice (9). Increased HA is also seen in the kidney with diabetes (5,10). Collectively, increased ECM deposition is associated with metabolic disorders in a variety of tissues.
HA, as a major component of the ECM, has multiple functions, including creating space between cells and facilitating cell migration (11). HA is synthesized by HA synthases and degraded by hyaluronidases. In humans, there are six hyaluronidase genes identified thus far. These are HYAL1, HYAL2, HYAL3, HYAL4, PH20, and HYALP1 (12). PH20 is the only identified hyaluronidase with significant enzyme activity at neutral pH. This characteristic of PH20 has created a role for the enzyme in facilitating dispersion of pharmaceutical agents through interstitial space (13). PH20 has a short serum half-life (<3 min) (14), which makes its intravenous applications impractical. The synthesis of a pegylated variant of the soluble recombinant human PH20 hyaluronidase (PEGPH20) extends the serum half-life of the enzyme to >10 h (14–17).
Although increases in HA in the serum, aorta, and kidney have been shown to be associated with insulin resistance (5,8,18), the role of HA in insulin-resistant skeletal muscle is unknown. The hypotheses that 1) HA content is increased in the ECM of insulin-resistant skeletal muscle and 2) reduction of HA in the muscle ECM by PEGPH20 treatment reverses diet-induced muscle insulin resistance were tested in the present studies. High-fat (HF) diet–induced obese (DIO) mice were used as a model of insulin resistance (19), and hyperinsulinemic-euglycemic clamps (ICvs) coupled with isotopic techniques (20) were used to assess insulin action in conscious, unrestrained, and stress-free mice. The results of this study demonstrate for the first time the critical role of HA in the pathogenesis of insulin resistance.
RESEARCH DESIGN AND METHODS
Mouse models.
Male C57BL/6J mice were fed a chow (chow fed) or HF diet (DIO), which contains 60% of calories as fat, for 16–20 weeks. The Vanderbilt Animal Care and Use Committee approved all animal procedures.
PEGPH20 treatment regimens
Pharmacokinetics of PEGPH20 in chow-fed mice.
Sixteen-week-old chow-fed mice received an intravenous injection of PEGPH20 at 10 mg/kg through the tail vein. Mice had free access to food and water throughout the experiment and were killed 4–72 h after the bolus.
Acute reduction of HA in DIO mice.
Eighteen-week-old DIO mice received an intravenous injection of vehicle (10 mmol/L histidine, 130 mmol/L NaCl at pH 6.5) or PEGPH20 at 10 mg/kg through the tail vein. The hyperinsulinemic-euglycemic clamp (ICv) was performed 3 days after the bolus.
Chronic reduction of HA in DIO mice.
Fifteen-week-old DIO mice received injections of vehicle or PEGPH20 at 10 mg/kg intravenously once every 3 days for 24 days (q3dx9). Body weight and food consumption were measured during the treatment. Energy expenditure (EE) and physical activity were measured for 3 days after the first injection. Mouse body composition was determined using nuclear magnetic resonance. ICv was performed 3 days after the last treatment.
Dose-dependent action of PEGPH20 in DIO mice.
Fifteen-week-old DIO mice received injections of vehicle or PEGPH20 at 0.001, 0.01, 0.1, and 1 mg/kg intravenously (q3dx9). Body weight, food consumption, EE, and physical activity were measured as described above. ICv was performed 3 days after the last treatment.
Hyperinsulinemic-euglycemic clamp.
Catheters were implanted in a carotid artery and a jugular vein of mice for sampling and intravenous infusions 5 days before hyperinsulinemic-euglycemic clamp (ICv) (20). ICv (4 mU/kg/min) was performed on 5 h–fasted mice (20). [3-3H]glucose was infused to determine glucose fluxes (21). Blood glucose was clamped at ∼150 mg/dL using a variable glucose infusion rate (GIR). Mice received washed erythrocytes from donors to prevent hematocrit fall. ICv was achieved by assessment of blood glucose every 10 min with GIR adjusted as needed. Blood was taken at 80–120 min for the determination of [3-3H]glucose. Clamp insulin was determined at t = 100 and 120 min. At 120 min, the clamp was sustained and a 13 µCi 2[14C]deoxyglucose ([14C]2DG) bolus was administered. Blood was taken at 2–35 min for [14C]2DG determination. After the last sample, mice were anesthetized and tissues were excised.
ICv plasma and tissue sample processing.
Plasma insulin and radioactivity of [3-3H]glucose, [14C]2DG, and [14C]2DG-6-phosphate were determined as previously described (22). Glucose appearance (Ra), endogenous glucose appearance (EndoRa), and glucose disappearance (Rd) rates were determined using non–steady-state equations (23). The glucose metabolic index (Rg) was calculated as previously described (24). Liver triglyceride was measured using the GPO triglyceride kit in ∼100 mg of frozen liver.
Percent cardiac output to muscle.
Percent cardiac output to muscle was assessed as previously described (25). After the final arterial blood sample of ICv, 50 μL of 15-μm microspheres was injected into the carotid artery. Gastrocnemius was then excised. Microspheres were isolated and fluorescence measured as previously described (25). Microsphere mixing was assumed if the microsphere content in the right and left kidney were within 10%.
Immunohistochemistry.
HA, collagen IV (ColIV), and CD31 were assessed by immunohistochemistry in paraffin-embedded tissue sections with the following primary antibodies: biotinylated HA binding protein, anti-ColIV, or anti-CD31. Slides were lightly counterstained with Mayer’s hematoxylin. The EnVision+HRP/DAB System was used to produce visible staining. Images were captured using a Q-Imaging Micropublisher camera mounted on an Olympus upright microscope. Immunostaining was quantified by the ImageJ Software.
Immunoprecipitation and immunoblotting.
Gastrocnemius was homogenized as previously described (3). Protein (40 μg) was applied to SDS-PAGE gel. Phosphorylated and total Akt/PKB were probed using phospho-Akt (Ser473) and Akt antibodies. For immunoprecipitation, 500 μg protein was incubated with 3 μg insulin receptor substrate 1 (IRS1) antibody (26). Then, 20 μL protein A/G PLUS-Agarose was added and incubated. The mixture was centrifuged and the supernatant removed. The beads were washed four times and centrifugation was repeated. Beads were resuspended and applied to SDS-PAGE gel. Immunoblots were probed with primary antibodies for phospho-IRS1 (Tyr612) and the p85 subunit of phosphoinositide 3-kinase.
Uptake of 2[3H]deoxyglucose ([3H]2DG) in isolated muscle.
Fifteen-week-old DIO mice were intravenously treated with vehicle or PEGPH20 at 10 mg/kg for 24 days (q3dx9). On day 27, mice were anesthetized and soleus and extensor digitorum longus (EDL) muscles were excised. Glucose uptake in isolated muscles was measured as before (27). In brief, soleus and EDL were treated with or without insulin at 10 mU/mL for 30 min. [3H]2DG uptake was measured 10 min after adding cold 2DG (1 mmol/L), [3H]2DG (0.25 μCi/mL), and D-[14C]mannitol (0.16 μCi/mL).
Determination of adipocyte size.
Paraffin-embedded perigonadal adipose tissue sections were stained with Toluidine Blue O. Adipocyte size and distribution range were determined by manual measurements of cell diameters of at least 100 adipocytes for each mouse.
Gene expression in adipose tissue.
RNA was isolated from 100 mg of perigonadal adipose tissue using the RNeasy minikit. cDNA was synthesized using the iScript cDNA synthesis kit. Real-time PCR analysis was performed on a Bio-Rad iQ5 machine using Taqman gene expression assays. 18S was quantified for each sample, and final relative concentration was determined using the delta delta threshold cycle (Ct) method (28).
Statistical analysis.
Data are expressed as mean ± SEM. Statistical analyses were performed using Student t test or two-way ANOVA followed by Tukey post hoc tests as appropriate. The significance level was P < 0.05.
RESULTS
Twenty weeks of HF diet increased muscle HA by twofold (Fig. 1A). To determine whether the presence of HA contributes to muscle insulin resistance, PEGPH20 was injected into mice to reduce HA. One injection of PEGPH20 at 10 mg/kg in chow-fed mice decreased HA by 80% 4 h after the intravenous administration (Fig. 1B). This decrease was sustained for at least 72 h after the bolus. Measurements of PEGPH20 activity in plasma showed that PEGPH20 had an early-phase half-life of 2.2 h and a late-phase half-life of 23 h using biexponential decay analysis (Fig. 1C). In DIO mice, repeated injections of PEGPH20 at 10 mg/kg over a 27-day period removed 90% of muscle HA (Fig. 1D).
FIG. 1.

HF feeding increases muscle HA content, and treatment with PEGPH20 in mice reduces HA in muscle. A: Immunohistochemical detection of HA in gastrocnemius of chow- and HF-fed mice. Data are quantified by measuring the integrated intensity of the staining and normalized to chow-fed mice. n = 5–6. *P < 0.05 vs. chow. B: Chow-fed mice were intravenously injected with PEGPH20, and HA content in gastrocnemius muscle was assessed by immunohistochemistry over time after the bolus. Data are normalized to time 0. n = 3. *P < 0.05 vs. 0 h. C: Plasma PEGPH20 activity was measured in mice from B to determine the half-life. n = 3. D: Immunohistochemical detection of HA in gastrocnemius muscle of vehicle- or chronic PEGPH20–treated DIO mice. Data are normalized to vehicle-treated HF-fed mice. n = 6. *P < 0.05 vs. vehicle HF. All data are represented as mean ± SEM. (A high-quality color representation of this figure is available in the online issue.)
The first injection of PEGPH20 in DIO mice caused an ∼10% decrease in body weight (Fig. 2A). Subsequent injections did not affect body weight, and the mice gained weight similarly to the vehicle-treated controls (0.12 ± 0.03 g/day in vehicle vs. 0.09 ± 0.03 g/day in PEGPH20). The initial decrease in body weight was likely due to decreased food consumption in PEGPH20-treated mice (Fig. 2B). Food intake rapidly increased thereafter. Food intake was measured after the fifth injection of PEGPH20 and was normal. Injections of PEGPH20 decreased fat mass by ∼35% after nine injections (Fig. 2C) but did not change the lean mass (Fig. 2D). EE during the light cycles was the same between groups for the 3 days after the first injection (Fig. 2E). In contrast, EE during the first two dark cycles was significantly lower in PEGPH20-treated mice. Ambulatory activity was significantly lower in the PEGPH20-treated mice during both light and dark cycles after the first injection (Fig. 2F). Physical activity in PEGPH20-treated mice was markedly improved by the third night.
FIG. 2.
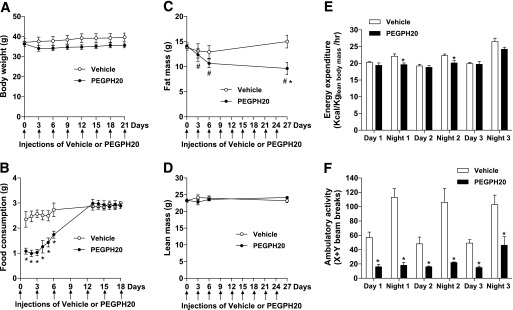
Treatment of PEGPH20 in DIO mice causes a transient body weight loss. DIO mice were treated with either vehicle or PEGPH20 for 24 days. Body weight (A), food consumption (B), fat mass (C), and lean mass (D) were assessed over time. n = 10. *P < 0.05 vs. vehicle and #P < 0.05 vs. day 0. EE (E) and physical activity (F) were assessed in mice for 3 days after the first injection of vehicle or PEGPH20. n = 6. *P < 0.05 vs. vehicle. All data are represented as mean ± SEM.
To determine the role of acute HA reduction in insulin resistance, ICv was performed in DIO mice 3 days after the first injection of PEGPH20. Body weights were not different between vehicle- and acute PEGPH20–treated mice (Table 1). One injection of PEGPH20 did not affect basal fasting glucose, plasma insulin, or nonesterified fatty acid (NEFA) concentrations. ICv glucose was 150 mg/dL in both groups (Table 1 and Fig. 3A). Arterial insulin was equivalently elevated and arterial NEFA was equivalently decreased in both groups during the ICv (Table 1). GIR was comparable between groups, indicating unaffected insulin sensitivity (Fig. 3B). Likewise, muscle Rg was not statistically different between the two groups (Fig. 3C). EndoRa and Rd were similar between the two groups at the basal state and during the ICv (Fig. 3D).
TABLE 1.
Basal and clamp characteristics of HF-fed C57BL/6J mice treated with vehicle or PEGPH20
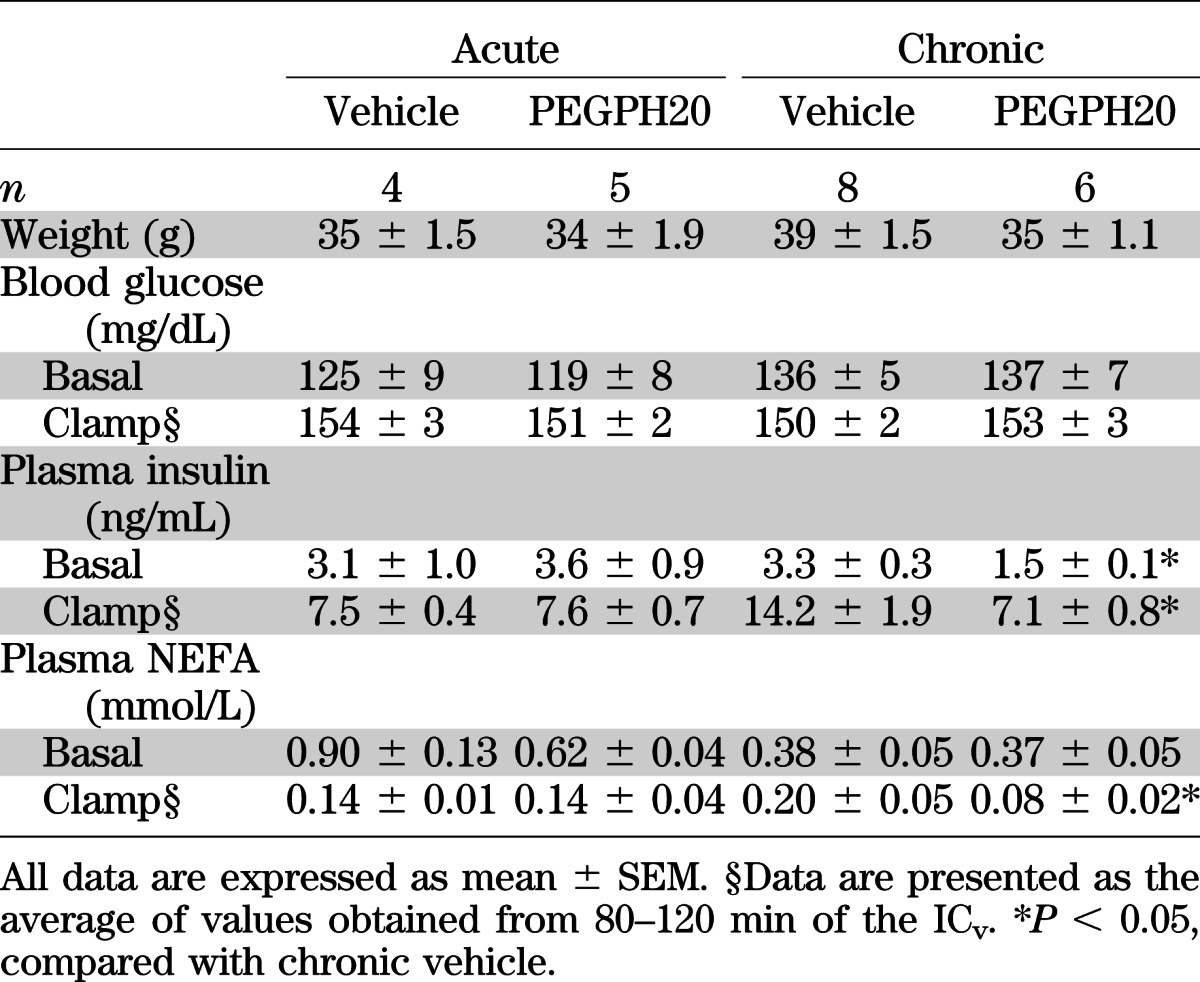
FIG. 3.
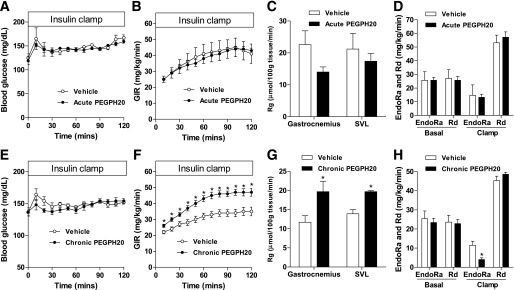
Chronic, but not acute, treatment of PEGPH20 increases insulin sensitivity in DIO mice. DIO mice received one (acute) or multiple (chronic) intravenous injections of vehicle or PEGPH20. ICv was performed 3 days after the injection to determine blood glucose (A and E); GIR (B and F); Rg (C and G), an index of muscle glucose uptake; and endogenous glucose production (EndoRa) and glucose disappearance rate (Rd) (D and H). n = 4–8. *P < 0.05 vs. vehicle. All data are represented as mean ± SEM.
We next investigated the effects of a chronic HA reduction in insulin-resistant DIO mice. Body weights, basal arterial glucose, and NEFA were the same between vehicle- and chronic PEGPH20–treated mice (Table 1). Basal arterial insulin, however, was decreased by ∼50%, reflecting improved insulin sensitivity. ICv glucose was 150 mg/dL in both groups (Table 1 and Fig. 3E). Consistent with lower basal insulin, ICv insulin in chronic PEGPH20–treated mice was ∼50% of that in vehicle-treated mice (Table 1). Arterial NEFA during the ICv was more suppressed in chronic PEGPH20–treated mice despite lower insulin. Moreover, GIR was higher in chronic PEGPH20–treated mice, demonstrating a profound improvement in insulin action (Fig. 3F). Rg in gastrocnemius and superficial vastus lateralis was also increased in PEGPH20-treated mice (Fig. 3G). Basal EndoRa and Rd were similar in both groups (Fig. 3H). EndoRa during the ICv was suppressed to a greater extent in chronic PEGPH20–treated mice. This decreased hepatic insulin resistance with chronic PEGPH20 treatment was not associated with decreased liver triglyceride content (Fig. 5D). Despite increased muscle Rg, Rd during the ICv was not increased in chronic PEGPH20–treated mice, suggesting that other tissues offset the increased Rg responses (Fig. 2C).
FIG. 5.

Chronic PEGPH20 treatment decreases adipocyte size and gene expression of the inflammatory markers. A: Immunochemical detection of HA and Toluidine Blue O staining in the perigonadal adipose tissue of vehicle and chronic PEGPH20-treated DIO mice. B: Adipocyte size was determined by manual measurements of adipocyte diameters of at least 100 adipocytes per mouse. C: Gene expression in perigonadal adipose tissue. Data were normalized to 18S expression. Mθ, macrophage; M1, proinflammatory markers; M2, anti-inflammatory markers. D: Liver triglyceride content in vehicle- and chronic PEGPH20-treated DIO mice. n = 6–8. *P < 0.05 vs. vehicle. All data are represented as mean ± SEM. (A high-quality color representation of this figure is available in the online issue.)
Increased muscle Rg in chronic PEGPH20-treated mice was consistent with increased insulin signaling in the muscle (Figs. 4A and B). Tyrosine phosphorylation of IRS1 and IRS1-associated p85 subunit of the phosphoinositide 3-kinase was increased in chronic PEGPH20–treated mice. Phosphorylation of Akt as well as total Akt was also increased in chronic PEGPH20–treated mice.
FIG. 4.
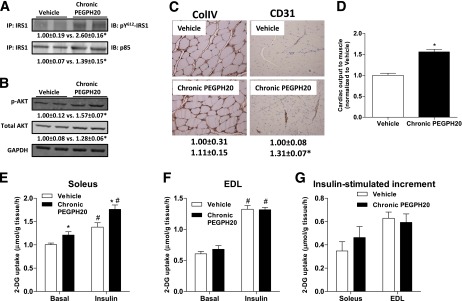
Effects of chronic PEGPH20 on muscle in DIO mice. A: Gastrocnemius muscle was collected at the end of the ICv. Tyrosine phosphorylation of IRS1 and IRS1-associated p85 were assessed by immunoprecipitation and Western blotting. B: Protein expression of Akt and phosphorylated Akt was assessed by Western blotting in muscle homogenates. C: Protein expression of collagen IV (ColIV) and CD31 were measured by immunohistochemistry in gastrocnemius muscle collected at the end of the ICv. ColIV expression was measured by the integrated intensity of staining. Muscle vascularity was determined by counting CD31-positive structures. D: Cardiac output to muscle was assessed by microspheres that were injected to the arterial catheter after the ICv. Data were normalized to vehicle. n = 4–8. *P < 0.05 vs. vehicle. E–G: Soleus and EDL muscles were isolated from mice chronically treated with vehicle or PEGPH20 for 24 days. In vitro glucose uptake was measured using 2-[3H]deoxyglucose on day 27. n = 7–9. *P < 0.05 vs. vehicle and #P < 0.05 vs. basal. All data are represented as mean ± SEM. GAPDH, glyceraldehyde-3-phosphate dehydrogenase. (A high-quality color representation of this figure is available in the online issue.)
Chronic HA depletion did not affect muscle ColIV (Fig. 4C). We have shown that reversal of muscle insulin resistance during an HF diet feeding was associated with increased muscle vascularization (3). Similarly, increased muscle insulin action in the PEGPH20-treated DIO mice was associated with an increased expression of the vascular marker CD31 (Fig. 4C). Increased muscle vascularization was also consistent with a 1.5-fold increase in the fraction of injected microspheres deposited in the skeletal muscle of PEGPH20-treated mice (Fig. 4D).
To further define whether the effects of chronic HA reduction were due to insulin sensitization of muscle per se, glucose uptake was assessed in isolated muscle. [3H]2DG uptake in isolated slow-twitch, oxidative-rich soleus was higher in the basal state and during insulin stimulation in PEGPH20-treated mice (Fig. 4E). However, the insulin-stimulated increment in [3H]2DG uptake was similar in both groups (Fig. 4G). [3H]2DG uptake was the same between groups in the predominantly fast-twitch, glycolytic EDL in both basal and insulin-stimulated states (Figs. 4F and G).
To understand why chronic PEGPH20 treatment decreased fat mass of the DIO mice, we examined the effects on adipose tissue. HA was expressed in the ECM of the adipose tissue in the vehicle-treated mice, and repeated injections of PEGPH20 depleted its presence (Fig. 5A). Toluidine Blue O staining revealed a significant reduction in adipocyte size in mice treated with PEGPH20 (Figs. 5A and B). We further examined the expression of the inflammation- and macrophage-specific genes in adipose tissue. Although there was no difference in the gene expression of macrophage markers F4/80, CD11c, and CD68, gene expression of some proinflammatory markers, IL-12 and IL-1b, was decreased by chronic PEGPH20. Gene expression of the anti-inflammatory markers IL-10, CD163, Mgl1, and Arg1 as well as the adipocyte markers ADRP and PPARγ was not affected (Fig. 5C).
We next evaluated the efficacy of lower doses of PEGPH20 in enhancing insulin action. Body weights of the DIO mice were not different between groups over the treatment (Fig. 6A). Body weight gain over the 24-day treatment was, however, lower in mice treated with 0.1 and 1 mg/kg PEGPH20 (Fig. 6B). Fat mass gain was decreased by PEGPH20 in a dose-dependent manner, and mice treated with 1 mg/kg PEGPH20 actually lost 1.5 g fat. Despite dose-dependent decreases in body weight gain and fat mass gain, lean mass gain was dose-dependently increased by PEGPH20. Food consumption was dose-dependently decreased after the first PEGPH20 injection (Fig. 6C). The dose dependency of food consumption was transient. EE was also transiently decreased in mice treated with 1 mg/kg PEGPH20 (Fig. 6D). PEGPH20 at other doses did not decrease EE after the first injection. PEGPH20 at 0.001 and 0.01 mg/kg increased EE at day 2. EE remained the same or was increased by PEGPH20 after six injections. Physical activity was transiently decreased in mice treated with 0.1 and 1 mg/kg PEGPH20 and was fully recovered by the second day (Fig. 6E). Physical activity was the same between vehicle- and PEGPH20-treated mice after six injections. To evaluate the minimally effective dose of PEGPH20 in improving insulin action, ICvs were performed. ICv glucose was 150 mg/dL in all groups (Fig. 6F). GIR was dose-dependently increased by PEGPH20. The minimally effective dose was 0.01 mg/kg (Fig. 6G). Muscle Rg was increased in mice treated with 0.1 and 1 mg/kg PEGPH20 (Fig. 6H). Increased GIR and muscle Rg with increasing concentrations of PEGPH20 was associated with a dose-dependent decrease in muscle HA content (Fig. 6I). Although 0.001 mg/kg PEGPH20 did not decrease muscle HA and 10 mg/kg PEGPH20 nearly depleted HA, PEGPH20 at 0.01, 0.1, and 1 mg/kg normalized HA levels to those seen in chow-fed vehicle mice.
FIG. 6.

Dose-dependent effect of chronic PEGPH20. DIO mice were treated with vehicle or PEGPH20 at 0.001, 0.01, 0.1, and 1 mg/kg for 24 days. Body weight (A), body composition changes (B), food consumption (C), EE (D), and physical activity (E) were measured over the treatment. n = 4–6. *P < 0.05 vs. vehicle. ICv was performed 3 days after the last injection. Blood glucose (F), GIR (G), and muscle Rg (H) during the ICv were determined. n = 4–6. ξP < 0.05 vs. vehicle; *P < 0.05 vs. vehicle. I: Dose-dependent effect of chronic PEGPH20 on HA content in the gastrocnemius of DIO mice. Dashed lines indicate HA content in chow-fed vehicle mice or HF-fed vehicle mice. Filled areas indicate the SEM of individual line values. n = 4–5. y = −0.44log(x) + 0.622. r2 = 0.9581. All data are represented as mean ± SEM. SVL, superficial vastus lateralis.
DISCUSSION
ECM remodeling in insulin-resistant skeletal muscle is of potential significance for muscle metabolism (3,7). In the current study, we demonstrate for the first time that HA in the muscle ECM is linked to muscle insulin resistance, as sustained reduction of HA by PEGPH20 reverses HF diet–induced muscle insulin resistance. The fact that chronic, but not acute, reduction of HA improves muscle insulin action suggests that HA in the muscle ECM is not simply a physical barrier but causes long-term adaptations in the muscle, including increased muscle vascularization and improved accessibility of muscle to metabolic substances such as glucose and insulin. The reversal of HF diet–induced insulin resistance by chronic HA reduction is not limited to skeletal muscle. Insulin’s ability to suppress adipocyte lipolysis and hepatic glucose production was also greatly improved with chronic PEGPH20 treatment. These results reveal the importance of HA turnover in the regulation of whole-body glucose flux. Following the proof of principle that HA is inversely related to insulin action, we set out to determine the minimally effective dose of PEGPH20 that improves insulin action. This is extremely important for developing a safe and tolerable dose to administer to insulin-resistant humans.
A single intravenous dose of PEGPH20 at 10 mg/kg has been previously shown to cause a transient body weight loss of ∼10% in young adult mice (14). We observed the same response in DIO mice. We further showed that this initial loss of body weight was likely due to decreased food consumption and occurred despite a decrease in EE after a single injection of PEGPH20. Physical activity of the DIO mice was also decreased by the initial injection. As mice received more injections of 10 mg/kg PEGPH20, food consumption was rapidly restored to quantities seen in the control mice. The EE and physical activity that were decreased after the initial injection of PEGPH20 were also transient. Potential medical complications of an injection of PEGPH20 include inflammation and joint pain (29). This may explain the initial decrease in activity and related responses. Nevertheless, the results of the present studies, as well as other work (14), suggest that chronic injections of PEGPH20 are well tolerated in mice as there are no overt adverse effects.
Acute reduction of HA by a single injection of PEGPH20 did not affect insulin action in DIO mice. As noted above, the acute response to PEGPH20 was accompanied by a transient decrease in food consumption and decreased physical activity. Although caloric restriction increases insulin sensitivity (30,31), reduced activity countered an increase in insulin action (32). An alternate explanation for the absence of an acute increase in insulin action is that transient responses to acute PEGPH20 mask an improvement in insulin action.
The effect of chronic treatment with PEGPH20 on skeletal muscle insulin action was clearly evident by increased [14C]2DG uptake in the muscle of PEGPH20-treated mice in vivo during the ICv. This augmentation was not observed in isolated muscle in vitro. Isolated muscle in vitro lacks the intact physiological interactions between muscle fibers and surrounding matrix and capillaries. These results suggest that the main site of action of PEGPH20 is extramyocellular. The surrounding ECM and capillaries in muscle control the delivery of hormones and glucose (and other nutrients) to muscle in vivo. In vitro, when the extracellular barrier of glucose uptake is removed and the muscle cells are freely accessible to insulin and glucose, the beneficial effects of PEGPH20 are absent. These results clearly demonstrate that the improved interstitial delivery or the vascular access of the hormones and glucose (and other nutrients) is responsible for the increased insulin action in response to PEGPH20. We have seen this disassociation between in vivo and in vitro glucose uptake with factors that influence the extramyocellular barrier. Bonner et al. (26) showed that deletion of vascular endothelial growth factor inhibits glucose uptake in vivo, but not in vitro. The importance of the extramyocellular response to the increased muscle insulin action with PEGPH20 in vivo is consistent with increased muscle vascularization and a greater percent cardiac output going to muscle. These results were consistent with previous studies (3) and further emphasize that the endothelial/vascular adaptation that occurs with chronic remodeling of muscle ECM is a pivotal event in the pathogenesis of insulin resistance. An increase in basal muscle glucose uptake was observed in isolated soleus, but not EDL, suggesting that chronic PEGPH20 treatment has a non–insulin-stimulated effect on slow-twitch, oxidative fibers but not fast-twitch, glycolytic muscle fibers.
Chronic treatment of PEGPH20 also reversed HF diet–induced insulin resistance in other insulin-sensitive tissues, in addition to skeletal muscle. Suppression of hepatic glucose production by insulin was also increased in chronic PEGPH20–treated mice. Suppression of plasma NEFA concentration was accentuated during the ICv in the PEGPH20-treated mice, indicating increased suppression of lipolysis by insulin. The relationship between the greater suppressions of lipolysis and hepatic glucose production is consistent with the “single gateway hypothesis” proposed by Bergman et al. (33). These findings reveal the importance of HA turnover in the regulation of whole-body glucose flux and are consistent with the importance of HA to metabolism in insulin-sensitive tissue (Supplementary Fig. 1).
Adiposity is an important risk factor for the development of insulin resistance among other things. Body fat mass and adipocyte size negatively correlate to insulin sensitivity (34,35). Adipose tissue inflammation is causatively linked to insulin resistance (36,37). Here we found that increased insulin action in the PEGPH20-treated mice is associated with decreased body fat mass, decreased adipocyte size, and decreased gene expression of the proinflammatory markers including IL-12 and IL-1b in adipose tissue. Interestingly, the expression of the anti-inflammatory markers and total macrophage markers such as F4/80, CD11c, and CD68 were unchanged. The unchanged expression of F4/80, CD11c, and CD68 was consistent with an unchanged number of crown-like structures determined by Toluidine Blue O staining of adipose tissue in vehicle and PEGPH20-treated mice (Supplementary Fig. 2). These results suggest that despite the same numbers of macrophages infiltrated in the adipose tissue of DIO mice, the classical activation, but not the alternative activation, of these macrophages might be decreased by chronic PEGPH20 treatment (38).
HA binds to proteins and by doing so influences cellular functions (39). Although the mechanisms that link increased ECM HA to HF diet–induced insulin resistance are not fully understood, we speculate that CD44, the main cell-surface receptor for HA, is coupled in the process as genetic deletion of CD44 ameliorates HF diet–induced insulin resistance and adipose tissue inflammation (40). CD44 is expressed in a large number of mammalian cell types, including endothelial cells (41,42). It has been shown that CD44 is involved in the regulation of angiogenesis and endothelial cell proliferation (43,44). It is likely that increased HA-CD44 interaction regulates insulin sensitivity by influencing the endothelial/vascular function. Moreover, we showed that DIO mice treated with PEGPH20 decreased inflammation in adipose tissue, same as mice lacking CD44 (40). These results suggest that the HA-CD44 interaction may also regulate the inflammatory response in adipose tissue, which influences insulin action. Other than binding to CD44, HA also binds to HA-mediated motility receptor (RHAMM) and activates intracellular signaling (45) and has many other functions such as cell proliferation, aggregation, migration, and activation. The role of these events in regulating glucose homeostasis remains to be determined.
Insulin resistance is a risk factor for many metabolic disorders, including type 2 diabetes and cardiovascular diseases (46–48). Identifying cost-effective therapeutic targets for insulin resistance is of great importance considering the high prevalence of the metabolic syndrome in modern societies. We discovered that PEGPH20 treatment exhibits a dose-dependent increase in whole-body insulin sensitivity in DIO mice with a minimal effect dose of 0.01 mg/kg and a maximal response dose of 1 mg/kg. At a dose of 0.01 mg/kg, the transient adverse effects seen with higher doses, including decreased food intake, EE, and physical activity, were absent. Importantly, PEGPH20 was effective at doses that normalized muscle HA to levels in chow-fed lean mice. These findings strongly suggest that elevated muscle HA is causative to muscle insulin resistance in DIO mice. Promisingly, we provide evidence that PEGPH20 dose-dependently decreases fat mass and increases lean mass, indicating that PEGPH20 promotes a metabolically healthier state. These dose-response studies in mice are important in developing optimal therapeutic regimens.
In summary, our studies show that an increase in the ECM HA is linked to HF diet–induced insulin resistance. Pharmacological treatment with PEGPH20 improves muscle vascularity and reverses insulin resistance. Moreover, the adipose and hepatic insulin resistance of HF feeding is improved with PEGPH20. These findings are consistent with previous findings from us (3) and others (2), suggesting that ECM remodeling associated with excess caloric intake is an important component of the pathogenesis of insulin resistance. We have shown previously that ECM constituents that act through integrin receptors improve insulin action. Here we show for the first time that HA is elevated in DIO mice and that this increase is a major contributor to insulin resistance. Treatment with the pegylated variant of hyaluronidase effectively normalizes HA content in muscle and improves insulin action.
Supplementary Material
ACKNOWLEDGMENTS
This work was supported by National Institutes of Health grants DK-054902 (D.H.W.), DK-059637 (Mouse Metabolic Phenotyping Center, D.H.W.), and DK-020593 (Vanderbilt Diabetes Research and Training Center).
This work was supported in part by a grant from Halozyme Therapeutics, Inc. L.H.B. was an employee of Halozyme Therapeutics, Inc. C.B.T. is an employee of Halozyme Therapeutics, Inc. No other potential conflicts of interest relevant to this article were reported.
L.K. designed the experiments, researched data, contributed to discussion, and wrote the manuscript. L.L., A.K., J.S.B., W.H.M., and D.P.B. researched data. L.H.B., A.H.H., and C.B.T. contributed to discussion and reviewed and edited the manuscript. D.H.W. designed the experiments, contributed to discussion, and reviewed and edited the manuscript. L.K. is the guarantor of this work and, as such, had full access to all the data in the study and takes responsibility for the integrity of the data and the accuracy of the data analysis.
Parts of this study were presented in poster form at the 71st Scientific Sessions of the American Diabetes Association, San Diego, California, 24–28 June 2011.
The authors thank Corey D. Webb (Vanderbilt University) for his help on the Toluidine Blue O staining of the adipose tissue.
Footnotes
This article contains Supplementary Data online at http://diabetes.diabetesjournals.org/lookup/suppl/doi:10.2337/db12-1502/-/DC1.
See accompanying commentary, p. 1816.
REFERENCES
- 1.Huang G, Greenspan DS. ECM roles in the function of metabolic tissues. Trends Endocrinol Metab 2012;23:16–22 [DOI] [PMC free article] [PubMed] [Google Scholar]
- 2.Coletta DK, Mandarino LJ. Mitochondrial dysfunction and insulin resistance from the outside in: extracellular matrix, the cytoskeleton, and mitochondria. Am J Physiol Endocrinol Metab 2011;301:E749–E755 [DOI] [PMC free article] [PubMed] [Google Scholar]
- 3.Kang L, Ayala JE, Lee-Young RS, et al. Diet-induced muscle insulin resistance is associated with extracellular matrix remodeling and interaction with integrin alpha2beta1 in mice. Diabetes 2011;60:416–426 [DOI] [PMC free article] [PubMed] [Google Scholar]
- 4.Pasarica M, Gowronska-Kozak B, Burk D, et al. Adipose tissue collagen VI in obesity. J Clin Endocrinol Metab 2009;94:5155–5162 [DOI] [PMC free article] [PubMed] [Google Scholar]
- 5.Lewis A, Steadman R, Manley P, et al. Diabetic nephropathy, inflammation, hyaluronan and interstitial fibrosis. Histol Histopathol 2008;23:731–739 [DOI] [PubMed] [Google Scholar]
- 6.Aumailley M, Gayraud B. Structure and biological activity of the extracellular matrix. J Mol Med (Berl) 1998;76:253–265 [DOI] [PubMed] [Google Scholar]
- 7.Berria R, Wang L, Richardson DK, et al. Increased collagen content in insulin-resistant skeletal muscle. Am J Physiol Endocrinol Metab 2006;290:E560–E565 [DOI] [PubMed] [Google Scholar]
- 8.Chajara A, Raoudi M, Delpech B, Leroy M, Basuyau JP, Levesque H. Increased hyaluronan and hyaluronidase production and hyaluronan degradation in injured aorta of insulin-resistant rats. Arterioscler Thromb Vasc Biol 2000;20:1480–1487 [DOI] [PubMed] [Google Scholar]
- 9.Weiss L, Slavin S, Reich S, et al. Induction of resistance to diabetes in non-obese diabetic mice by targeting CD44 with a specific monoclonal antibody. Proc Natl Acad Sci USA 2000;97:285–290 [DOI] [PMC free article] [PubMed] [Google Scholar]
- 10.Melin J, Hellberg O, Funa K, Hällgren R, Larsson E, Fellström BC. Ischemia-induced renal expression of hyaluronan and CD44 in diabetic rats. Nephron, Exp Nephrol 2006;103:e86–e94 [DOI] [PubMed] [Google Scholar]
- 11.Toole BP. Hyaluronan: from extracellular glue to pericellular cue. Nat Rev Cancer 2004;4:528–539 [DOI] [PubMed] [Google Scholar]
- 12.Jiang D, Liang J, Noble PW. Hyaluronan as an immune regulator in human diseases. Physiol Rev 2011;91:221–264 [DOI] [PMC free article] [PubMed] [Google Scholar]
- 13.Bookbinder LH, Hofer A, Haller MF, et al. A recombinant human enzyme for enhanced interstitial transport of therapeutics. J Control Release 2006;114:230–241 [DOI] [PubMed] [Google Scholar]
- 14.Thompson CB, Shepard HM, O’Connor PM, et al. Enzymatic depletion of tumor hyaluronan induces antitumor responses in preclinical animal models. Mol Cancer Ther 2010;9:3052–3064 [DOI] [PubMed] [Google Scholar]
- 15.Jiang P, Li X, Thompson CB, et al. Effective targeting of the tumor microenvironment for cancer therapy. Anticancer Res 2012;32:1203–1212 [PubMed] [Google Scholar]
- 16.Jacobetz MA, Chan DS, Neesse A, et al. Hyaluronan impairs vascular function and drug delivery in a mouse model of pancreatic cancer. Gut 2013;62:112–120 [DOI] [PMC free article] [PubMed] [Google Scholar]
- 17.Provenzano PP, Cuevas C, Chang AE, Goel VK, Von Hoff DD, Hingorani SR. Enzymatic targeting of the stroma ablates physical barriers to treatment of pancreatic ductal adenocarcinoma. Cancer Cell 2012;21:418–429 [DOI] [PMC free article] [PubMed] [Google Scholar]
- 18.Dasu MR, Devaraj S, Park S, Jialal I. Increased toll-like receptor (TLR) activation and TLR ligands in recently diagnosed type 2 diabetic subjects. Diabetes Care 2010;33:861–868 [DOI] [PMC free article] [PubMed] [Google Scholar]
- 19.Surwit RS, Kuhn CM, Cochrane C, McCubbin JA, Feinglos MN. Diet-induced type II diabetes in C57BL/6J mice. Diabetes 1988;37:1163–1167 [DOI] [PubMed] [Google Scholar]
- 20.Ayala JE, Bracy DP, McGuinness OP, Wasserman DH. Considerations in the design of hyperinsulinemic-euglycemic clamps in the conscious mouse. Diabetes 2006;55:390–397 [DOI] [PubMed] [Google Scholar]
- 21.Berglund ED, Li CY, Poffenberger G, et al. Glucose metabolism in vivo in four commonly used inbred mouse strains. Diabetes 2008;57:1790–1799 [DOI] [PMC free article] [PubMed] [Google Scholar]
- 22.Ayala JE, Bracy DP, Julien BM, Rottman JN, Fueger PT, Wasserman DH. Chronic treatment with sildenafil improves energy balance and insulin action in high fat-fed conscious mice. Diabetes 2007;56:1025–1033 [DOI] [PubMed] [Google Scholar]
- 23.Steele R, Wall JS, De Bodo RC, Altszuler N. Measurement of size and turnover rate of body glucose pool by the isotope dilution method. Am J Physiol 1956;187:15–24 [DOI] [PubMed] [Google Scholar]
- 24.Kraegen EW, James DE, Jenkins AB, Chisholm DJ. Dose-response curves for in vivo insulin sensitivity in individual tissues in rats. Am J Physiol 1985;248:E353–E362 [DOI] [PubMed] [Google Scholar]
- 25.Lee-Young RS, Griffee SR, Lynes SE, et al. Skeletal muscle AMP-activated protein kinase is essential for the metabolic response to exercise in vivo. J Biol Chem 2009;284:23925–23934 [DOI] [PMC free article] [PubMed] [Google Scholar]
- 26.Bonner JS, Lantier L, Hasenour CM, James FD, Bracy DP, Wasserman DH. Muscle-Specific vascular endothelial growth factor deletion induces muscle capillary rarefaction creating muscle insulin resistance. Diabetes. 21 September 2012 [Epub ahead of print] [DOI] [PMC free article] [PubMed] [Google Scholar]
- 27.Jørgensen SB, Viollet B, Andreelli F, et al. Knockout of the alpha2 but not alpha1 5′-AMP-activated protein kinase isoform abolishes 5-aminoimidazole-4-carboxamide-1-beta-4-ribofuranosidebut not contraction-induced glucose uptake in skeletal muscle. J Biol Chem 2004;279:1070–1079 [DOI] [PubMed] [Google Scholar]
- 28.Livak KJ, Schmittgen TD. Analysis of relative gene expression data using real-time quantitative PCR and the 2(-Delta Delta C(T)) Method. Methods 2001;25:402–408 [DOI] [PubMed] [Google Scholar]
- 29.Whatcott CJ, Han H, Posner RG, Hostetter G, Von Hoff DD. Targeting the tumor microenvironment in cancer: why hyaluronidase deserves a second look. Cancer Discov 2011;1:291–296 [DOI] [PMC free article] [PubMed] [Google Scholar]
- 30.Redman LM, Ravussin E. Caloric restriction in humans: impact on physiological, psychological, and behavioral outcomes. Antioxid Redox Signal 2011;14:275–287 [DOI] [PMC free article] [PubMed] [Google Scholar]
- 31.Niskanen L, Uusitupa M, Sarlund H, Siitonen O, Paljärvi L, Laakso M. The effects of weight loss on insulin sensitivity, skeletal muscle composition and capillary density in obese non-diabetic subjects. Int J Obes Relat Metab Disord 1996;20:154–160 [PubMed] [Google Scholar]
- 32.Toledo FG, Menshikova EV, Ritov VB, et al. Effects of physical activity and weight loss on skeletal muscle mitochondria and relationship with glucose control in type 2 diabetes. Diabetes 2007;56:2142–2147 [DOI] [PubMed] [Google Scholar]
- 33.Bergman RN, Bradley DC, Ader M. On insulin action in vivo: the single gateway hypothesis. Adv Exp Med Biol 1993;334:181–198 [DOI] [PubMed] [Google Scholar]
- 34.Frederiksen L, Nielsen TL, Wraae K, et al. Subcutaneous rather than visceral adipose tissue is associated with adiponectin levels and insulin resistance in young men. J Clin Endocrinol Metab 2009;94:4010–4015 [DOI] [PubMed] [Google Scholar]
- 35.O’Connell J, Lynch L, Cawood TJ, et al. The relationship of omental and subcutaneous adipocyte size to metabolic disease in severe obesity. PLoS ONE 2010;5:e9997. [DOI] [PMC free article] [PubMed] [Google Scholar]
- 36.Hotamisligil GS. Inflammation and metabolic disorders. Nature 2006;444:860–867 [DOI] [PubMed] [Google Scholar]
- 37.Shoelson SE, Lee J, Goldfine AB. Inflammation and insulin resistance. J Clin Invest 2006;116:1793–1801 [DOI] [PMC free article] [PubMed] [Google Scholar]
- 38.Gordon S. Alternative activation of macrophages. Nat Rev Immunol 2003;3:23–35 [DOI] [PubMed] [Google Scholar]
- 39.Toole BP. Hyaluronan is not just a goo! J Clin Invest 2000;106:335–336 [DOI] [PMC free article] [PubMed] [Google Scholar]
- 40.Kodama K, Horikoshi M, Toda K, et al. Expression-based genome-wide association study links the receptor CD44 in adipose tissue with type 2 diabetes. Proc Natl Acad Sci USA 2012;109:7049–7054 [DOI] [PMC free article] [PubMed] [Google Scholar]
- 41.Aruffo A, Stamenkovic I, Melnick M, Underhill CB, Seed B. CD44 is the principal cell surface receptor for hyaluronate. Cell 1990;61:1303–1313 [DOI] [PubMed] [Google Scholar]
- 42.Su AI, Wiltshire T, Batalov S, et al. A gene atlas of the mouse and human protein-encoding transcriptomes. Proc Natl Acad Sci USA 2004;101:6062–6067 [DOI] [PMC free article] [PubMed] [Google Scholar]
- 43.Cao G, Savani RC, Fehrenbach M, et al. Involvement of endothelial CD44 during in vivo angiogenesis. Am J Pathol 2006;169:325–336 [DOI] [PMC free article] [PubMed] [Google Scholar]
- 44.Päll T, Pink A, Kasak L, et al. Soluble CD44 interacts with intermediate filament protein vimentin on endothelial cell surface. PLoS ONE 2011;6:e29305. [DOI] [PMC free article] [PubMed] [Google Scholar]
- 45.Turley EA, Austen L, Vandeligt K, Clary C. Hyaluronan and a cell-associated hyaluronan binding protein regulate the locomotion of ras-transformed cells. J Cell Biol 1991;112:1041–1047 [DOI] [PMC free article] [PubMed] [Google Scholar]
- 46.Samuel VT, Petersen KF, Shulman GI. Lipid-induced insulin resistance: unravelling the mechanism. Lancet 2010;375:2267–2277 [DOI] [PMC free article] [PubMed] [Google Scholar]
- 47.Tritos NA, Mantzoros CS. Clinical review 97: syndromes of severe insulin resistance. J Clin Endocrinol Metab 1998;83:3025–3030 [DOI] [PubMed] [Google Scholar]
- 48.Fourlanos S, Narendran P, Byrnes GB, Colman PG, Harrison LC. Insulin resistance is a risk factor for progression to type 1 diabetes. Diabetologia 2004;47:1661–1667 [DOI] [PubMed] [Google Scholar]
Associated Data
This section collects any data citations, data availability statements, or supplementary materials included in this article.